

Abstract
Key points
Carbonic anhydrase (CA) inhibitors such as acetazolamide inhibit hypoxic pulmonary vasoconstriction (HPV) in humans and other mammals, but the mechanism of this action remains unknown.
It has been postulated that carbonic anhydrase may act as a nitrous anhydrase in vivo to generate nitric oxide (NO) from nitrite and that this formation is increased in the presence of acetazolamide.
Acetazolamide reduces HPV in pigs without evidence of any NO generation, whereas nebulized sodium nitrite reduces HPV by NO formation; however; combined infusion of acetazolamide with sodium nitrite inhalation did not further increase exhaled NO concentration over inhaled nitrite alone in pigs exposed to alveolar hypoxia.
We conclude that acetazolamide does not function as either a nitrous anhydrase or a nitrite reductase in the lungs of pigs, and probably other mammals, to explain its vasodilating actions in the pulmonary or systemic circulations.
Abstract
The carbonic anhydrase (CA) inhibitors acetazolamide and its structurally similar analogue methazolamide prevent or reduce hypoxic pulmonary vasoconstriction (HPV) in dogs and humans in vivo, by a mechanism unrelated to CA inhibition. In rodent blood and isolated blood vessels, it has been reported that inhibition of CA leads to increased generation of nitric oxide (NO) from nitrite and vascular relaxation in vitro. We tested the physiological relevance of augmented NO generation by CA from nitrite with acetazolamide in anaesthetized pigs during alveolar hypoxia in vivo. We found that acetazolamide prevents HPV in anaesthetized pigs, as in other mammalian species. A single nebulization of sodium nitrite reduces HPV, but this action wanes in the succeeding 3 h of hypoxia as nitrite is metabolized and excreted. Pulmonary artery pressure reduction and NO formation as measured by exhaled gas concentration from inhaled sodium nitrite were not increased by acetazolamide during alveolar hypoxia. Thus, our data argue against a physiological role of carbonic anhydrase as a nitrous anhydrase or nitrite reductase as a mechanism for its inhibition of HPV in the lung and blood in vivo.
Keywords: hypoxic pulmonary vasoconstriction, carbonic anhydrase, nitrite, acetazolamide, pig, hypoxia
Key points
Carbonic anhydrase (CA) inhibitors such as acetazolamide inhibit hypoxic pulmonary vasoconstriction (HPV) in humans and other mammals, but the mechanism of this action remains unknown.
It has been postulated that carbonic anhydrase may act as a nitrous anhydrase in vivo to generate nitric oxide (NO) from nitrite and that this formation is increased in the presence of acetazolamide.
Acetazolamide reduces HPV in pigs without evidence of any NO generation, whereas nebulized sodium nitrite reduces HPV by NO formation; however; combined infusion of acetazolamide with sodium nitrite inhalation did not further increase exhaled NO concentration over inhaled nitrite alone in pigs exposed to alveolar hypoxia.
We conclude that acetazolamide does not function as either a nitrous anhydrase or a nitrite reductase in the lungs of pigs, and probably other mammals, to explain its vasodilating actions in the pulmonary or systemic circulations.
Introduction
Nitrite (NO2 −) and nitrate (NO3 −) are important physiological storage forms of nitric oxide (NO). Nitrite is metabolized to NO within blood and tissues and exerts NO‐dependent vasorelaxation and cytoprotective effects in animal models of hypoxia or systemic organ ischaemia–reperfusion (I–R) injuries (Lundberg et al. 2008; van Faassen et al. 2009). Under acidic ischaemic conditions, NO formation from nitrite can occur by non‐enzymic disproportionation (Zweier et al. 1995). In addition, several enzymic nitrite reductases have been identified, including haemoglobin, myoglobin and neuroglobin, the molybdo‐flavoenzymes xanthine oxidoreductase (XOR), aldehyde oxidase (AO), and components of the mitochondrial respiratory chain (van Faassen et al. 2009). Another mechanism by which NO can be catalytically generated by haemoglobin from nitrite is via reaction of two molecules of nitrite to generate dinitrogen trioxide (N2O3) which then spontaneously homolyzes to NO and NO2 (Lundberg et al. 2008). Aamand et al. (2009) proposed another enzyme that might act as a similar nitrous anhydrase, reporting that the ubiquitous enzyme carbonic anhydrase (CA) generates high levels of NO with addition of nitrite to rodent tissues and blood in vitro. They also surprisingly found increased NO‐dependent vasorelaxation in rat aortic strings when CA was inhibited by two different inhibitors, acetazolamide (ACZ) and dorzolamide.
Using alveolar hypoxia as a stimulus for hypoxic pulmonary vasoconstriction (HPV), Hunter et al. (2004) found that inhalation of sodium nitrite (NaNO2) prevented the increase in pulmonary artery pressure (PAP) and pulmonary vascular resistance (PVR) in anaesthetized sheep and that this effect was linked to NO formation. Since CA is abundantly expressed within the pulmonary capillary endothelium and alveolar epithelium (Effros et al. 1981; Lönnerholm 1982), CA mediated‐generation of NO from nitrite might be involved, although many of the other nitrite reductases mentioned above are also present in the lung.
Of relevance, ACZ reduces and in some cases even prevents HPV during acute alveolar hypoxia in isolated lungs (Deem et al. 2000), unanaesthetized dogs (Höhne et al. 2004) and humans (Teppema et al. 2007; Ke et al. 2013) by a mechanism unrelated to CA inhibition (Höhne et al. 2007). Shimoda et al. (2007) found that in pulmonary artery smooth muscle cells the hypoxia‐induced cytosolic calcium (Ca2+) increase that initiates HPV is blocked by ACZ independently of CA inhibition by using N‐methyl‐acetazolamide (NMA), a molecule lacking CA inhibitory properties by methylation of the critical free amine group of the sulfonamide moiety of ACZ responsible for binding to CA. In translating these findings to the in vivo situation, we confirmed that prevention of HPV with ACZ was also independent of CA inhibition in unanaesthetized dogs by showing equivalent effects of NMA (Pickerodt et al. 2014).
Nonetheless, the ACZ‐ and NMA‐sensitive pathway(s) responsible for pulmonary vasodilatation during alveolar hypoxia remain unidentified. In work in isolated rat pulmonary vascular smooth muscle cells, our data point to an effect of acetazolamide in preventing the initial release of sarcoplasmic reticulum calcium into the cytoplasm or possibly by scavenging of reactive oxygen species (Shimoda et al. 2007). However, given the findings by Aamand et al. (2009) that CA and its inhibitors facilitate generation of NO from nitrite in vitro, we believed it necessary to test whether increased NO formation from nitrite might constitute a mechanism for the inhibition of HPV by acetazolamide in vivo. Here, we tested the physiological relevance of augmented NO generation from nitrite with carbonic anhydrase inhibition by acetazolamide during alveolar hypoxia in anaesthetized pigs.
Methods
Ethical approval
All animal care and procedures were approved by the Charité – Universitätsmedizin and the Governmental Animal Protection Committee (LAGeSO; Approval Number: G 0249/13) following the principles of laboratory animal care of the European and German Society of Laboratory Animal Science Associations (FELASA; GV‐SOLAS). All experiments were performed in deeply anaesthetized juvenile male pigs (body weight (BW): 24.2 ± 2.1 kg; n = 27). Animals were obtained from the Central Animal Facilities of the Charité – Universitätsmedizin Berlin and were killed at the end of the experiments with thiopental and potassium chloride in deep general anaesthesia, which is in conformation with the local regulations. The authors further conform to the principles and regulations as published by The Journal of Physiology (Grundy, 2015).
The animals were housed under standardized conditions and were provided a standardized diet (Uni 2000, Raiffeisen Waren GmbH, Kassel, Germany) for at least 7 days before the experiment. Health status was checked and recorded daily and body temperature and body weight were measured weekly.
After intramuscular premedication with ketamine (Medistar GmbH, Ascheberg, Germany), xylazine (CP‐Pharma, Burgdorf, Germany) and azaperon (Janssen GmbH, Neuss, Germany), a venous catheter was inserted into an ear vein (20 G Venflon Pro; Becton Dickinson, Helsingborg, Sweden). Following an intravenous (i.v.) bolus of 200 ml balanced crystalloid solution, a continuous infusion of 8 ml kg−1 h−1 was maintained throughout the experiment (Sterofundin ISO; B. Braun, Melsungen, Germany). Following an i.v. bolus of 100–200 μg fentanyl (Janssen GmbH), the animals were placed in supine position on a padded table. A custom‐made face mask was attached, equipped with a 2.5 cm ID Y‐piece connecting it to a ventilator (Evita Infinity V500; Dräger, Lübeck, Germany) set in CPAP mode (positive end‐expiratory pressure; PEEP = 1 cmH2O). During instrumentation, the fraction of inspired oxygen () was set to 1.0. Intravenous anaesthesia was induced with thiopental (0.13 mg kg−1 min−1; Rotexmedica GmbH, Trittau, Germany), fentanyl (0.08–0.12 μg kg−1 min−1) and maintained until the end of the experiment. After local anaesthesia (lidocaine 2%; B. Braun) animals were tracheotomized (Tracoe 8.5; Nieder‐Olm, Germany) and the ventilator was set to pressure controlled ventilation with a tidal volume () of 8 ml (kg body weight)−1 (pressure controlled‐volume guaranteed (PC‐VG) modus of the ventilator) and PEEP of 5 cmH2O. The inspiratory to expiratory time ratio (I:E) was set at 1:1.5 and the respiratory rate (RR) was adjusted to maintain an arterial partial pressure of carbon dioxide () of 40 mmHg. End‐expiratory partial pressure of carbon dioxide () was measured using a mainstream infrared sensor (CapnoPlus; Dräger).
All animals were instrumented as follows. The urinary bladder was catheterized (14 Ch; Rüsch, Kernen, Germany) and an arterial line (18 G; Vygon, Aachen, Germany) was inserted via the right femoral artery and advanced into the abdominal aorta. A pulmonary artery catheter (5 F, No. 132F5; Edwards, Unterschleissheim, Germany) and a central venous catheter (9.5 F; Vygon) were inserted via the right external jugular vein. These catheters were used for continuous systemic and pulmonary blood pressure monitoring, intermittent cardiac output (CO) measurements and blood sampling. All pressure transducers were adjusted to the level of the right atrium of the heart.
Thereafter, a 45 min period prior to the start of the experiment was used to calibrate the chemiluminescence analyser (NOA) for measurement of gaseous NO (Sievers NOA 280i, Analytix Ltd, Boldon, UK). First, the ventilator was connected to a nitric oxide‐free gas generator (Eco Physics GmbH, Munich, Germany) in order to eliminate any small amount of NO that may exist in the hospital's gas supply system. Second, a two‐point calibration of the NOA was performed using a calibration gas containing < 1 part per billion (ppb) nitric oxide as a zero reference, followed by a certified calibration gas containing 500 p.p.b. nitric oxide in nitrogen (Westfalen AG, Muenster, Germany). Third, gas for NO measurements was taken from the expiratory limb of the Y‐piece connecting the respiratory circuit to the tracheal cannula. Fourth, ambient air – and inspiratory NO and NO2 concentrations – were measured with a separate chemiluminescence analyser (CLD 700 AL; Eco Physics) during some of the experiments to control for pollution of both ambient air and inspiratory gas mixtures from the environment and the hospital's central gas supply with nitric oxide. When used, inhaled sodium nitrite (iNaNO2) was nebulized into the inspiratory limb of the respiratory circuit (Aeroneb Pro; Aerogen, Galway, Ireland).
Only after tolerating all surgical procedures without clinical signs of pain in response to surgical stimuli (movements, increases in blood pressure, respiratory or heart rate) animals received a continuous i.v. infusion of 2.5 μg kg−1 min−1 pancuronium (Inresa, Freiburg, Germany).
Four groups of animals were studied:
Controls (n = 8);
Acetazolamide (Diamox, Mercury Pharmaceuticals, London, UK) intravenously: loading dose of 2 mg kg−1 i.v. 30 min prior to the start of the experiment, followed by a continuous infusion of 2 mg kg−1 h−1 (ACZ i.v.; n = 7);
Sodium nitrite (Sigma Aldrich, St Louis, MO, USA) inhaled: 15 mg min−1 over 30 min beginning with the onset of alveolar hypoxia (iNaNO2; n = 6);
Combined administration of ACZ and iNaNO2; both as described above (ACZ i.v.+iNaNO2) (n = 6).
In control experiments, pigs were ventilated with a of 0.5 (50% O2, 50% N2) for the first hour (baseline), followed by breathing a gas mixture containing 14.5% O2 and 85.5% N2 for 3 h (hypoxia hours I, II and III). We used a of 0.5 in the normoxic period in order to insure that no HPV existed anywhere in the lungs before we imposed the inspired hypoxic gas to evoke HPV. This time course was the same for all further experiments, but the was reduced to 0.12 in all CA‐inhibited animals during the hypoxia period. This was necessary to maintain an equal stimulus for HPV (alveolar oxygen tension) because of the strong inhibitory effect of carbonic anhydrase inhibitors on rapid red cell CO2–HCO3 − equilibration and the subsequent need for higher alveolar ventilation by an increase in respiratory rate to achieve comparable blood values (see Results section).
Exhaled nitric oxide (NOex), heart rate (HR), mean arterial blood pressure (MAP), central venous pressure (CVP), mean pulmonary artery pressure (MPAP), respiratory rate, and airway pressures during inspiration (positive inspiratory pressure; PIP) and end‐expiration (PEEP) were continuously measured and recorded using a digital data acquisition system (LabChart, ADInstruments, Colorado Springs, USA). All further standard respiratory parameters were saved in 5 min intervals by the mechanical ventilator and later stored on a personal computer.
Haemodynamic measurements (cardiac output (CO), pulmonary capillary wedge pressure (PCWP)), calculation of systemic (SVR) and pulmonary (PVR) vascular resistance, as well as the withdrawal of blood samples for measurements of plasma nitrite and nitrate, arterial and mixed venous blood gases, actual bicarbonate, base excess and plasma electrolytes were performed at 30 min intervals. Plasma NO2 − and NO3 − were measured using the Griess reaction (Nitrite/Nitrate Assay: R&D systems, Wiesbaden, Germany). For analysis of acid–base balance, the hydrogen ion concentrations corresponding to each individual arterial pH (pHa) value at a given time point were averaged in each group. Subsequently, the resulting mean H+ concentrations were converted into the logarithmic pH value.
Urine flow and urinary concentrations of sodium, potassium and creatinine were determined for the baseline and the hypoxia periods. To assess glomerular filtration rate (GFR), exogenous creatinine clearance (priming dose 1.4 g over 30 min before the start of experiments, maintenance infusion 4.7 mg min−1) was calculated by the standard clearance formula. Urinary and plasma sodium, potassium and creatinine concentrations were measured by the routine clinical laboratories of the Charité – Universitätsmedizin Berlin.
Statistical analysis
All values are given as means ± standard deviation (SD). After testing for normal distribution of the data, a two‐way analysis of variance and multiple comparison tests were applied to quantify the effects of treatment (group) and time on respiratory, haemodynamic and blood gas measurements at the end of each experimental hour. All tests were two‐sided. When statistical significance was indicated, post hoc analysis of intra‐group differences over time and between‐group differences (at equal time points) were performed with Student's paired (intra‐group) and unpaired (between‐group) t tests and adjusted for multiple comparisons using the Holm‐Bonferroni procedure. Analysis was performed using GraphPad Prism (GraphPad Software Inc., La Jolla, CA, USA) Statistical significance was assumed at P < 0.05.
Results
Arterial blood gases, ventilation and acid–base status
In controls, arterial partial pressure of oxygen () decreased from 254 ± 17 during baseline to 50–54 mmHg during the three hypoxic hours I–III (P < 0.001; Table 1). During baseline measurements, was similar regardless of the protocol compared to controls (range of mean values: 250–268 mmHg; n.s.; Table 1). With hypoxia (hours I–III) was lower compared to the baseline and did not differ between groups (range of mean values: 47–54 mmHg). The was kept constant (range: 41–43 mmHg) over time and did not differ between groups. Figure 1 A and B depicts these changes.
Table 1.
Arterial blood gases, respiratory parameters, exhaled nitric oxide and nitrite blood concentration in controls, with i.v. acetazolamide, inhaled sodium nitrite and combined i.v. acetazolamide + inhaled sodium nitrite during hyperoxic baseline and hypoxia
| Baseline 1 h | Hypoxia I 1st h | Hypoxia II 2nd h | Hypoxia III 3rd h | ||||||||||||||
|---|---|---|---|---|---|---|---|---|---|---|---|---|---|---|---|---|---|
| n | Mean | SD | Sig. | Mean | SD | Sig. | Mean | SD | Sig. | Mean | SD | Sig. | |||||
| (mmHg) | |||||||||||||||||
| Controls | 8 | 254 | ± | 17 | 54 | ± | 4 | * | 51 | ± | 6 | * | 50 | ± | 5 | * | |
| ACZ i.v. | 7 | 261 | ± | 13 | 53 | ± | 2 | * | 51 | ± | 3 | * | 51 | ± | 3 | * | |
| iNaNO2 | 6 | 250 | ± | 17 | 53 | ± | 4 | * | 51 | ± | 5 | * | 47 | ± | 5 | * | |
| ACZ i.v. + iNaNO2 | 6 | 268 | ± | 16 | 50 | ± | 4 | * | 49 | ± | 3 | * | 51 | ± | 2 | * | |
| (mmHg) | |||||||||||||||||
| Controls | 8 | 41 | ± | 1 | 41 | ± | 1 | * | 41 | ± | 1 | * | 41 | ± | 1 | * | |
| ACZ i.v. | 7 | 42 | ± | 4 | 44 | ± | 4 | * | 43 | ± | 4 | * | 43 | ± | 3 | * | |
| iNaNO2 | 6 | 41 | ± | 1 | 42 | ± | 1 | * | 41 | ± | 1 | * | 41 | ± | 1 | * | |
| ACZ i.v. + iNaNO2 | 6 | 42 | ± | 2 | 43 | ± | 1 | * | 41 | ± | 1 | * | 41 | ± | 1 | * | |
| (l min−1) | |||||||||||||||||
| Controls | 8 | 4.2 | ± | 1.2 | 4.0 | ± | 0.9 | 4.1 | ± | 1.3 | 4.2 | ± | 1.2 | ||||
| ACZ i.v. | 7 | 8.1 | ± | 2.0 | † | 9.2 | ± | 2.4 | * , † | 10.0 | ± | 2.5 | * , † | 9.6 | ± | 2.6 | * , † |
| iNaNO2 | 6 | 4.5 | ± | 0.8 | 4.3 | ± | 0.9 | 4.6 | ± | 0.7 | 4.9 | ± | 0.7 | ||||
| ACZi.v. + iNaNO2 | 6 | 7.2 | ± | 3.5 | † | 7.9 | ± | 3.4 | † | 9.6 | ± | 2.5 | * , † | 8.9 | ± | 2.2 | * , † |
| VT (ml) | |||||||||||||||||
| Controls | 8 | 220 | ± | 23 | 220 | ± | 25 | 220 | ± | 25 | 220 | ± | 24 | ||||
| ACZ i.v. | 7 | 225 | ± | 12 | 226 | ± | 14 | 225 | ± | 12 | 224 | ± | 16 | ||||
| iNaNO2 | 6 | 210 | ± | 8 | 210 | ± | 8 | 211 | ± | 5 | 209 | ± | 6 | ||||
| ACZ i.v. + iNaNO2 | 6 | 216 | ± | 24 | 218 | ± | 24 | 216 | ± | 23 | 217 | ± | 24 | ||||
| RR (1 min−1) | |||||||||||||||||
| Controls | 8 | 18 | ± | 3 | 17 | ± | 2 | 17 | ± | 3 | 18 | ± | 4 | ||||
| ACZ i.v. | 7 | 34 | ± | 7 | † | 39 | ± | 10 | * , † | 43 | ± | 11 | * , † | 41 | ± | 11 | * , † |
| iNaNO2 | 6 | 20 | ± | 3 | 19 | ± | 4 | 20 | ± | 3 | 21 | ± | 3 | ||||
| ACZ i.v. + iNaNO2 | 6 | 32 | ± | 16 | † | 35 | ± | 16 | † | 43 | ± | 11 | * , † | 40 | ± | 9 | * , † |
| NOex (p.p.b.) | |||||||||||||||||
| Controls | 8 | 2 | ± | 1 | 3 | ± | 1 | 3 | ± | 1 | 2 | ± | 1 | ||||
| ACZ i.v. | 7 | 2 | ± | 1 | 3 | ± | 1 | 3 | ± | 1 | 3 | ± | 1 | ||||
| iNaNO2 | 6 | 2 | ± | 1 | 46 | ± | 10 | * , † | 27 | ± | 7 | * , † | 20 | ± | 4 | * , † | |
| ACZ i.v. + iNaNO2 | 6 | 2 | ± | 0 | 22 | ± | 2 | * , † | 13 | ± | 2 | * , † | 11 | ± | 1 | * , † | |
| NOrelease (nl min−1) | |||||||||||||||||
| Controls | 8 | 9 | ± | 2 | 10 | ± | 1 | 11 | ± | 2 | 10 | ± | 2 | ||||
| ACZ i.v. | 7 | 21 | ± | 10 | 26 | ± | 13 | 33 | ± | 14 | 30 | ± | 18 | ||||
| iNaNO2 | 6 | 10 | ± | 5 | 198 | ± | 54 | * , † | 126 | ± | 43 | * , † | 97 | ± | 29 | * , † | |
| ACZ i.v. + iNaNO2 | 6 | 18 | ± | 8 | 173 | ± | 61 | * , † | 125 | ± | 29 | * , † | 98 | ± | 19 | * , † | |
| Nitrite (μmol l−1) | |||||||||||||||||
| Controls | 8 | 0.6 | ± | 0.3 | 0.8 | ± | 0.6 | 0.6 | ± | 0.3 | 0.6 | ± | 0.3 | ||||
| ACZ i.v. | 7 | 1.3 | ± | 0.4 | 1.1 | ± | 0.3 | 1.0 | ± | 0.3 | 1.1 | ± | 0.4 | ||||
| iNaNO2 | 6 | 1.2 | ± | 0.9 | 35.4 | ± | 23.0 | * , † | 7.6 | ± | 5.6 | 4.1 | ± | 2.8 | |||
| ACZ i.v. + iNaNO2 | 6 | 0.8 | ± | 0.6 | 48.4 | ± | 25.8 | * , † | 8.2 | ± | 6.1 | 2.5 | ± | 1.9 | |||
, arterial oxygen tension; , arterial carbon dioxide tension; , expiratory minute ventilation; , tidal volume; RR, respiratory rate; NOex, exhaled nitric oxide; NOrelease, nitric oxide release rate. ACZ, acetazolamide; iNaNO2, inhaled sodium nitrite; n, number of experiments; SD, standard deviation. Sig., significance: * P < 0.05 vs. baseline; † P < 0.05 vs. controls.
Figure 1.
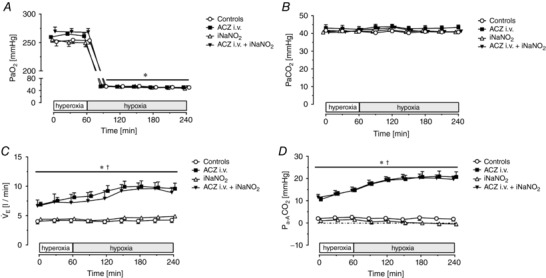
Arterial gas exchange parameters and ventilation
Time course of mean arterial blood partial pressure of oxygen () (A), mean arterial blood partial pressure of carbon dioxide () (B), expiratory minute ventilation ( E) (C) and differences of arterial to alveolar partial pressure of oxygen () (D). Measurements were performed in 30 min intervals during 1 h of hyperoxia ( = 0.5) and during 3 h of isobaric hypoxia ( = 0.145–0.12) in control animals (n = 8), and pigs treated with i.v. ACZ (n = 7), inhaled NaNO2 (n = 6) and combined i.v. ACZ + iNaNO2 (n = 6). Values are means ± SD. * P < 0.05 vs. hyperoxia; † P < 0.05 vs. controls.
The minute ventilation ( E) necessary to achieve stable blood values was 4.2 ± 1.2 l min−1 in the control group at baseline and did not change over time (Table 1 and Fig. 1 C). In iNaNO2‐treated animals, E was fully comparable to the control group at all time points. Baseline E in the ACZ i.v. group was 8.1 ± 2.0 l min−1 (P = 0.0012 vs. controls) and increased to 9.6 ± 2.6 l min−1 (P < 0.0001 vs. baseline) after the third hour of hypoxia. The E of animals treated with combined ACZ i.v. + iNANO2 was also higher at baseline than in controls (7.2 ± 3.5 l min−1) and increased to 8.9 ± 2.2 l min−1 at the end of the experiment (see Table 1). Thus, E was consistently higher whenever intravenous ACZ was administered compared to untreated control animals. These differences in minute ventilation were fully accounted for by differences in respiratory rate, as was fixed at 8 ml kg−1 body weight by the experimental design (see Methods section). RR was 18 ± 3 1 min−1 at baseline in the control group and did not change over time. In the ACZ i.v.‐ and the ACZ i.v.+ iNaNO2 group, baseline RR values were 34 ± 7 and 32 ± 16 min−1, respectively, and increased to 41 ± 11 and 40 ± 9 min−1 after the third hour of hypoxia. In contrast, VT was maintained constant and did not differ between groups (range: 210 ± 10 to 226 ± 15 ml; Table 1). The higher E necessary to achieve comparable blood in all CA‐inhibited animals was paralleled by an increase in the difference of arterial to alveolar ( difference) when compared to control animals (Fig. 1 D).
The arterial pH (pHa) value was 7.49 at baseline in control animals and slightly decreased over time to a pHa of 7.46 after 3 h of hypoxia. Actual arterial bicarbonate (aHCO3−) and actual base excess (aBE) also decreased over time in controls (Baseline aHCO3 −: 30.8 ± 1.6 mmol l−1; Hypoxia III aHCO3 −: 28.7 ± 2.4 mmol l−1; Baseline aBE: 6.7 ± 1.6 mmol l−1; Hypoxia III: 4.9 ± 2.6 mmol l−1). In contrast, the pHa decreased towards the end of the experiment compared to controls whenever carbonic anhydrase was inhibited with ACZ (pHa 7.42, both with ACZ i.v. and ACZ i.v. + iNaNO2 after the third hour of hypoxia). This was due to a decrease in arterial blood bicarbonate concentration and aBE (Table 2) in the ACZ i.v. and ACZ i.v. + iNaNO2 group compared to their respective baseline values. Administration of inhaled sodium nitrite alone reduced pHa and aBE after hypoxia I and II compared to control experiments, yet both pHa and aBE were fully comparable to control animals at the end of the experiments.
Table 2.
Arterial hydrogen ion concentration, arterial pH, actual bicarbonate concentration, actual base excess and plasma potassium concentration in controls, with i.v. acetazolamide, inhaled sodium nitrite and combined i.v. acetazolamide + inhaled sodium nitrite during hyperoxic baseline and hypoxia
| Baseline 1 h | Hypoxia I 1st h | Hypoxia II 2nd h | Hypoxia III 3rd h | ||||||||||||||
|---|---|---|---|---|---|---|---|---|---|---|---|---|---|---|---|---|---|
| n | Mean | SD | Sig. | Mean | SD | Sig. | Mean | SD | Sig. | Mean | SD | Sig. | |||||
| H+ (nm l−1) | |||||||||||||||||
| Controls | 8 | 32.6 | ± | 1.6 | 33.5 | ± | 2.0 | 35.1 | ± | 4.2 | 34.9 | ± | 2.6 | * | |||
| ACZ i.v. | 7 | 33.7 | ± | 1.8 | 36.9 | ± | 2.0 | *,† | 36.8 | ± | 2.5 | * | 37.9 | ± | 2.0 | *,† | |
| iNaNO2 | 6 | 34.8 | ± | 2.6 | 37.0 | ± | 3.4 | *,† | 37.4 | ± | 3.0 | *,† | 36.8 | ± | 3.4 | * | |
| ACZ i.v. + iNaNO2 | 6 | 36.2 | ± | 4.2 | † | 38.7 | ± | 2.6 | *,† | 37.8 | ± | 1.6 | *,† | 38.2 | ± | 1.8 | *,† |
| pHa | |||||||||||||||||
| Controls | 8 | 7.49 | ± | 7.48 | ± | 7.46 | ± | 7.46 | ± | * | |||||||
| ACZ i.v. | 7 | 7.47 | ± | 7.43 | ± | *,† | 7.43 | ± | * | 7.42 | ± | *,† | |||||
| iNaNO2 | 6 | 7.46 | ± | 7.43 | ± | *,† | 7.43 | ± | *,† | 7.43 | ± | * | |||||
| ACZ i.v. + iNaNO2 | 6 | 7.44 | ± | † | 7.41 | ± | *,† | 7.42 | ± | *,† | 7.42 | ± | *,† | ||||
| HCO3 − (mmol l−1) | |||||||||||||||||
| Controls | 8 | 30.8 | ± | 1.6 | 30.3 | ± | 2.0 | 29.2 | ± | 2.7 | * | 28.7 | ± | 2.4 | * | ||
| ACZ i.v. | 7 | 29.5 | ± | 1.8 | 27.8 | ± | 1.7 | * | 27.6 | ± | 1.7 | * | 27.0 | ± | 1.9 | * | |
| iNaNO2 | 6 | 28.9 | ± | 2.2 | 27.8 | ± | 2.1 | 27.1 | ± | 2.1 | * | 27.2 | ± | 2.8 | * | ||
| ACZ i.v. + iNaNO2 | 6 | 28.3 | ± | 1.9 | 27.2 | ± | 2.0 | 26.3 | ± | 1.2 | * | 26.1 | ± | 1.2 | * | ||
| aBE (mm) | |||||||||||||||||
| Controls | 8 | 6.7 | ± | 1.6 | 6.5 | ± | 1.9 | 6.0 | ± | 2.3 | 4.9 | ± | 2.6 | * | |||
| ACZ i.v. | 7 | 6.0 | ± | 1.9 | 3.7 | ± | 1.8 | *,† | 3.5 | ± | 1.8 | * | 2.9 | ± | 1.8 | * | |
| iNaNO2 | 6 | 5.0 | ± | 2.4 | 3.7 | ± | 2.4 | † | 3.0 | ± | 2.5 | *,† | 3.2 | ± | 3.1 | * | |
| ACZ i.v. + iNaNO2 | 6 | 4.3 | ± | 2.4 | † | 2.8 | ± | 2.1 | *,† | 2.3 | ± | 1.4 | *,† | 2.0 | ± | 1.4 | *,† |
| P K (mm) | |||||||||||||||||
| Controls | 8 | 4.2 | ± | 0.3 | 4.4 | ± | 0.5 | 4.6 | ± | 0.7 | * | 4.6 | ± | 0.8 | * | ||
| ACZ i.v. | 7 | 4.0 | ± | 0.3 | 4.0 | ± | 0.3 | 4.0 | ± | 0.3 | † | 4.0 | ± | 0.3 | † | ||
| iNaNO2 | 6 | 4.2 | ± | 0.2 | 4.4 | ± | 0.2 | 4.3 | ± | 0.3 | 4.2 | ± | 0.4 | ||||
| ACZ i.v. + iNaNO2 | 6 | 3.9 | ± | 0.2 | 4.1 | ± | 0.4 | 4.1 | ± | 0.4 | 4.1 | ± | 0.3 | ||||
H+, arterial hydrogen ion concentration; pHa, arterial pH; HCO3 −, arterial bicarbonate concentration; aBE, base excess; P K, plasma potassium concentration. ACZ, acetazolamide; iNaNO2, inhaled sodium nitrite; n, number of experiments. Sig., significance: * P < 0.05 vs. baseline; † P < 0.05 vs. controls.
Pulmonary and systemic haemodynamics
Heart rate (baseline and over time) did not differ between groups. Mean arterial pressure at baseline (Controls: 87 ± 8 mmHg) did not differ between groups. Compared to baseline, MAP was slightly lower during 3 h of alveolar hypoxia in the control group (78 ± 6, 75 ± 11 and 77 ± 14 mmHg during Hypoxia I–III; P < 0.05 vs. baseline only after Hypoxia II). With ACZ i.v., baseline MAP was slightly, but insignificantly lower compared to controls (77 ± 10 mmHg) and did not decrease during hypoxia (Table 3). In both, the iNaNO2 and the ACZ i.v. + iNaNO2 groups, MAP was lower during the first 2 h of hypoxia than during baseline. This effect disappeared after 3 h of hypoxia (Table 3). Regardless of the treatment, MAP was not different from controls during the experiment.
Table 3.
Systemic and pulmonary haemodynamic parameters in controls, with i.v. acetazolamide, inhaled sodium nitrite and combined acetazolamide i.v. + inhalation of sodium nitrite during hyperoxic baseline and hypoxia
| Baseline 1 h | Hypoxia I 1st h | Hypoxia II 2nd h | Hypoxia III 3rd h | ||||||||||||||
|---|---|---|---|---|---|---|---|---|---|---|---|---|---|---|---|---|---|
| n | Mean | SD | Sig. | Mean | SD | Sig. | Mean | SD | Sig. | Mean | SD | Sig. | |||||
| HR (1 min−1) | |||||||||||||||||
| Controls | 8 | 83 | ± | 18 | 89 | ± | 19 | 88 | ± | 21 | 94 | ± | 24 | ||||
| ACZ i.v. | 7 | 75 | ± | 7 | 82 | ± | 11 | 84 | ± | 13 | 88 | ± | 14 | ||||
| iNaNO2 | 6 | 80 | ± | 14 | 103 | ± | 36 | * | 98 | ± | 32 | 107 | ± | 33 | * | ||
| ACZ i.v. + iNaNO2 | 6 | 82 | ± | 17 | 90 | ± | 22 | 95 | ± | 30 | 101 | ± | 34 | ||||
| MAP (mmHg) | |||||||||||||||||
| Controls | 8 | 87 | ± | 8 | 78 | ± | 6 | 75 | ± | 11 | * | 77 | ± | 14 | |||
| ACZ i.v. | 7 | 77 | ± | 10 | 68 | ± | 13 | 69 | ± | 15 | 70 | ± | 16 | ||||
| iNaNO2 | 6 | 79 | ± | 9 | 60 | ± | 9 | * | 64 | ± | 4 | * | 68 | ± | 7 | ||
| ACZ i.v. + iNaNO2 | 6 | 79 | ± | 6 | 56 | ± | 19 | * | 62 | ± | 18 | * | 75 | ± | 24 | ||
| CO (l min−1) | |||||||||||||||||
| Controls | 8 | 1.8 | ± | 0.2 | 1.9 | ± | 0.7 | 2.1 | ± | 0.9 | 2.0 | ± | 08 | ||||
| ACZ i.v. | 7 | 2.1 | ± | 0.4 | 2.4 | ± | 0.4 | 2.7 | ± | 0.7 | * | 2.5 | ± | 0.3 | |||
| iNaNO2 | 6 | 1.9 | ± | 0.3 | 2.0 | ± | 0.6 | 2.0 | ± | 0.6 | 2.3 | ± | 0.5 | ||||
| ACZ i.v. + iNaNO2 | 6 | 2.0 | ± | 0.7 | 2.2 | ± | 1.1 | 2.3 | ± | 1.1 | 2.4 | ± | 1.1 | ||||
| SVR (dyn s cm−5) | |||||||||||||||||
| Controls | 8 | 3896 | ± | 648 | 3485 | ± | 1002 | * | 3214 | ± | 1070 | * | 3238 | ± | 924 | * | |
| ACZ i.v. | 7 | 2939 | ± | 412 | 2268 | ± | 667 | † | 2114 | ± | 664 | * , † | 2187 | ± | 610 | * , † | |
| iNaNO2 | 6 | 3224 | ± | 554 | 2492 | ± | 585 | * | 2502 | ± | 603 | 2320 | ± | 584 | * | ||
| ACZ i.v. + iNaNO2 | 6 | 3410 | ± | 994 | 2202 | ± | 956 | * , † | 2253 | ± | 625 | * | 2575 | ± | 786 | * | |
| CVP (mmHg) | |||||||||||||||||
| Controls | 8 | 1 | ± | 2 | 2 | ± | 1 | 1 | ± | 1 | 1 | ± | 1 | ||||
| ACZ i.v. | 7 | 1 | ± | 2 | 2 | ± | 2 | 2 | ± | 2 | 2 | ± | 2 | ||||
| iNaNO2 | 6 | 3 | ± | 1 | 3 | ± | 1 | 3 | ± | 1 | 4 | ± | 1 | ||||
| ACZ i.v. + iNaNO2 | 6 | 2 | ± | 2 | 2 | ± | 1 | 2 | ± | 1 | 2 | ± | 1 | ||||
| MPAP (mmHg) | |||||||||||||||||
| Controls | 8 | 14 | ± | 2 | 26 | ± | 5 | * | 27 | ± | 4 | * | 28 | ± | 4 | * | |
| ACZ i.v. | 7 | 12 | ± | 3 | 17 | ± | 4 | * , † | 16 | ± | 2 | * , † | 19 | ± | 4 | * , † | |
| iNaNO2 | 6 | 13 | ± | 2 | 19 | ± | 3 | * , † | 26 | ± | 5 | * | 29 | ± | 3 | * | |
| ACZ i.v. + iNaNO2 | 6 | 12 | ± | 1 | 16 | ± | 5 | * , † | 17 | ± | 6 | * , † | 21 | ± | 7 | * , † | |
| PVR (dyn s cm−5) | |||||||||||||||||
| Controls | 8 | 493 | ± | 120 | 1046 | ± | 420 | * | 1010 | ± | 385 | * | 1045 | ± | 314 | * | |
| ACZ i.v. | 7 | 327 | ± | 42 | 410 | ± | 52 | † | 378 | ± | 85 | † | 474 | ± | 107 | † | |
| iNaNO2 | 6 | 356 | ± | 96 | 628 | ± | 198 | * , † | 913 | ± | 313 | * | 890 | ± | 237 | * | |
| ACZ i.v. + iNaNO2 | 6 | 331 | ± | 94 | 470 | ± | 118 | † | 457 | ± | 78 | † | 566 | ± | 132 | * , † | |
| PCWP (mmHg) | |||||||||||||||||
| Controls | 8 | 3 | ± | 1 | 4 | ± | 1 | 4 | ± | 1 | 4 | ± | 1 | ||||
| ACZ i.v. | 7 | 4 | ± | 2 | 4 | ± | 2 | 4 | ± | 2 | 4 | ± | 1 | ||||
| iNaNO2 | 6 | 5 | ± | 1 | 4 | ± | 1 | 4 | ± | 1 | 4 | ± | 1 | ||||
| ACZ i.v. + iNaNO2 | 6 | 4 | ± | 1 | 4 | ± | 1 | 4 | ± | 0 | 4 | ± | 0 | ||||
HR, heart rate; MAP, mean arterial pressure; CO, cardiac output; SVR, systemic vascular resistance; CVP, central venous pressure; MPAP, mean pulmonary artery pressure; PVR, pulmonary vascular resistance; PCWP, pulmonary capillary wedge pressure. ACZ, acetazolamide; iNaNO2, inhaled sodium nitrite; n, number of experiments. Sig., significance: * P < 0.05 vs. baseline; † P < 0.05 vs. controls.
Central venous pressure (mean value range: 1–4 mmHg) did not change over time and was fully comparable to controls in all treatment groups during the experimental time course. The pulmonary capillary wedge pressure at baseline and during the 3 h of hypoxia were fully comparable between the groups and did not change over time compared to their respective baseline values (range of values 2–7 mmHg; see Table 3).
Cardiac output in the control group was 1.8 ± 0.2 l min−1 at baseline and 1.9 ± 0.7, 2.1 ± 0.9 and 2.0 ± 0.8 l min−1 during 3 h of hypoxia. CO was not different from these values at equal time points in any of the treatment groups. Compared to baseline (2.1 ± 0.4 l min−1), cardiac output increased with ACZ i.v. after 2 h of hypoxia to 2.7 ± 0.7 l min−1 (Table 3).
At comparable CO and MAP values, systemic vascular resistance was 3896 ± 648 dyn s cm−5 after baseline measurements in the control group and decreased to 3485 ± 1002, 3214 ± 1070 and 3238 ± 924 dyn s cm−5 after Hypoxia I, II and III, respectively (P < 0.05; Table 3). At baseline, SVR was fully comparable between the control and all further groups. With ACZ i.v., the SVR was lower compared to controls during hypoxia (Baseline: 2939 ± 412; Hypoxia I–III: 2268 ± 667, 2114 ± 664 and 2187 ± 610 dyn s cm−5, respectively; P < 0.05 vs. controls). In the ACZ i.v. + iNaNO2 group, SVR was lower compared to controls only after 1 h of hypoxia (2202 ± 956 dyn s cm−5; P < 0.05). Systemic vascular resistance decreased in all experimental groups with the onset of hypoxia and was lower in all groups compared to baseline at the end of the experiment (P < 0.05 vs. baseline at Hypoxia III; see Table 3).
Baseline mean pulmonary artery pressure and pulmonary vascular resistance were comparable in all groups (Table 3, Fig. 2 A and B). In controls, MPAP increased from 14 ± 2 mmHg after baseline to 28 ± 4 mmHg after 3 h of hypoxia (P < 0.05), while pulmonary vascular resistance increased from 493 ± 120 dyn s cm−5 (baseline) to 1045 ± 314 dyn s cm−5 at the end of the protocol (P < 0.05, Fig. 2 B). With intravenous ACZ, MPAP was 12 ± 3 mmHg at baseline and 17 ± 4, 16 ± 2 and 19 ± 4 mmHg during Hypoxia I–III, respectively. Thus, MPAP with acetazolamide was consistently lower compared to controls during the 3 h of alveolar hypoxia. PVR with ACZ i.v. was 327 ± 42 dyn s cm−5 (baseline), did not increase during Hypoxia I–III (410 ± 52, 378 ± 85 and 474 ± 107 dyn s cm−5 ; n.s.) and was lower at P < 0.0001 during Hypoxia I–III compared to controls. MPAP (19 ± 3 mmHg; P = 0.0039) and PVR (628 ± 198 dyn s cm−5; P = 0.004) were lower with iNaNO2 during Hypoxia I but fully comparable to controls during Hypoxia II + III (MPAP: 26 ± 5 and 29 ± 3 mmHg, respectively; PVR: 913 ± 313 and 890 ± 237 dyn s cm−5, respectively). Thus, iNaNO2 prevented HPV only during the first hour of hypoxia. Combined administration of intravenous ACZ and inhaled NaNO2 reduced MPAP and PVR during Hypoxia I–III compared to the control group (Fig. 2 A and B), yet MPAP and PVR increased during the third hour of hypoxia compared to their baseline values (P < 0.05).
Figure 2. Pulmonary haemodynamics and lung nitric oxide release.

Time course of mean pulmonary arterial pressure (MPAP) (A), mean pulmonary vascular resistance (PVR) (B), and nitric oxide release rate (NO release) (C), Measurements were performed continuously and values were obtained in 30 min intervals during 1 h of hyperoxia ( = 0.5) and during 3 h of isobaric hypoxia ( = 0.145–0.12) in control animals (n = 8), and pigs treated with i.v. ACZ (n = 7), inhaled NaNO2 (n = 6) and combined i.v. ACZ + iNaNO2 (n = 6). Values are means ± SD. * P < 0.05 vs. hyperoxia; † P < 0.05 vs. controls.
Exhaled nitric oxide and nitrite measurements
Exhaled nitric oxide was 2 p.p.b. in all groups at baseline (see Table 1). In controls and ACZ i.v. treated animals, NOex did not change during the subsequent 3 h of hypoxia (see Table 1). Inhalation of NaNO2 led to an immediate increase in exhaled NO and NOex was higher during hypoxia (46 ± 10, 27 ± 7 and 20 ± 4 p.p.b. in the first, second and third hours of hypoxia, respectively; P < 0.05 vs. baseline and vs. controls). Inhalation of sodium nitrite after complete inhibition of carbonic anhydrase with acetazolamide during alveolar hypoxia also increased NOex compared to baseline and to control animals. Yet given the ∼2‐fold increase in E with carbonic anhydrase inhibition, the absolute values of exhaled NO were lower during hypoxia (Hypoxia I: 22 ± 2 p.p.b.; Hypoxia II: 13 ± 2 p.p.b.; Hypoxia III: 11 ± 1 p.p.b.) compared to nitrite inhalation alone. We therefore normalized NO concentrations to E to assess the NO release rate in the exhaled gas (NOrelease) as amount over time (nl min−1). In controls, NOrelease was 9 ± 2 nl min−1 at baseline and 10 ± 1, 11 ± 2 and 10 ± 2 nl min−1 during Hypoxia I, II and III, respectively. With ACZ i.v., NO production was 21 ± 10 nl min−1 (baseline) and 26 ± 13, 33 ± 14 and 30 ± 18 nl min−1 during Hypoxia I–III, respectively (this difference was not statistically significant, with P > 0.05 vs. controls at all time points; see Fig. 2 C). Nitric oxide release rate was increased with inhalation of NaNO2 during hypoxia (iNaNO2: 198 ± 54, 126 ± 43 and 97 ± 29 nl min−1 during Hypoxia I—III, respectively) yet fully comparable between the iNaNO2 and the ACZ + iNaNO2 group (ACZ + iNaNO2: 173 ± 61, 125 ± 29 and 98 ± 19 nl min−1 during Hypoxia I, II and III, respectively). Thus, the NO release rate was independent of carbonic anhydrase inhibition (Fig. 2 C).
Nitrite concentration in arterial blood during baseline was 0.6 ± 0.3 in controls and 1.3 ± 0.4 μmol l−1 (P > 0.05) in ACZ i.v.‐treated animals and remained unchanged during hypoxia in both groups (Table 1). At baseline, arterial nitrite concentration was comparable to controls in animals treated either with iNaNO2 or ACZ + iNaNO2 (1.2 ± 0.9 and 0.8 ± 0.6 μmol l−1). In both groups, blood NO2 concentration increased to 34.4 ± 23 and 48.4 ± 25.8 μmol l−1, respectively, after Hypoxia I (P < 0.05; for time course of nitrite blood concentration see Table 1).
Renal function and urinary excretion data
Urine output at baseline was comparable in all groups (Table 4). With alveolar hypoxia, urine output decreased as compared to baseline in controls.
Table 4.
Renal excretion parameters in controls, with i.v. acetazolamide, inhaled sodium nitrite and combined acetazolamide i.v. + inhalation of sodium nitrite during hyperoxic baseline and hypoxia
| Baseline 1 h | Hypoxia I 1st h | Hypoxia II 2nd h | Hypoxia III 3rd h | ||||||||||||||
|---|---|---|---|---|---|---|---|---|---|---|---|---|---|---|---|---|---|
| n | Mean | SD | Sig. | Mean | SD | Si.g | Mean | SD | Sig. | Mean | SD | Sig. | |||||
| U (ml h−1 kg−1) | |||||||||||||||||
| Controls | 8 | 96 | ± | 44 | 21 | ± | 6 | * | 21 | ± | 12 | * | 24 | ± | 15 | * | |
| ACZ i.v. | 7 | 95 | ± | 65 | 34 | ± | 17 | * | 33 | ± | 12 | * | 47 | ± | 21 | * | |
| iNaNO2 | 6 | 64 | ± | 22 | 25 | ± | 15 | * | 20 | ± | 6 | * | 25 | ± | 12 | * | |
| ACZ i.v. + iNaNO2 | 6 | 97 | ± | 69 | 32 | ± | 13 | * | 37 | ± | 20 | * | 45 | ± | 16 | * | |
| UNa (μmol min−1 kg−1) | |||||||||||||||||
| Controls | 8 | 2.3 | ± | 1.3 | 0.6 | ± | 0.4 | 0.3 | ± | 0.3 | * | 0.5 | ± | 0.7 | |||
| ACZ i.v. | 7 | 3.4 | ± | 4.0 | 1.1 | ± | 1.0 | * | 1.2 | ± | 1.0 | * | 2.7 | ± | 2.2 | ||
| iNaNO2 | 6 | 1.4 | ± | 0.9 | 0.4 | ± | 0.4 | 0.3 | ± | 0.2 | 0.7 | ± | 1.0 | ||||
| ACZ i.v. + iNaNO2 | 6 | 4.4 | ± | 3.2 | 1.2 | ± | 0.8 | * | 1.8 | ± | 2.2 | * | 2.8 | ± | 2.2 | ||
| UK (μmol min−1 kg−1) | |||||||||||||||||
| Controls | 8 | 1.0 | ± | 0.4 | 0.3 | ± | 0.1 | * | 0.7 | ± | 0.5 | 1.1 | ± | 0.9 | |||
| ACZ i.v. | 7 | 2.6 | ± | 0.6 | † | 1.5 | ± | 0.5 | * , † | 1.7 | ± | 0.3 | * , † | 2.1 | ± | 0.6 | † |
| iNaNO2 | 6 | 1.3 | ± | 0.5 | 0.6 | ± | 0.4 | * | 0.8 | ± | 0.5 | 1.4 | ± | 0.9 | |||
| ACZ i.v. + iNaNO2 | 6 | 2.3 | ± | 0.8 | † | 1.4 | ± | 1.2 | * , † | 1.9 | ± | 1.1 | † | 2.8 | ± | 1.1 | † |
| GFR (ml min−1 kg−1) | |||||||||||||||||
| Controls | 8 | 1.83 | ± | 0.36 | 1.37 | ± | 0.30 | * | 1.63 | ± | 0.37 | * | 1.68 | ± | 0.52 | * | |
| ACZ i.v. | 7 | 1.48 | ± | 0.19 | 1.22 | ± | 0.21 | 1.36 | ± | 0.17 | * | 1.36 | ± | 0.22 | |||
| iNaNO2 | 6 | 2.21 | ± | 0.46 | 1.48 | ± | 0.60 | * | 2.04 | ± | 0.43 | * | 2.08 | ± | 0.51 | * | |
| ACZ i.v. + iNaNO2 | 6 | 1.42 | ± | 0.23 | 1.13 | ± | 0.45 | 1.33 | ± | 0.41 | 1.48 | ± | 0.50 | ||||
U, urinary flow rate; UNa , urinary sodium excretion; UK , urinary potassium excretion; GFR, glomerular filtration rate. ACZ, acetazolamide; iNaNO2, inhaled sodium nitrite; n, number of experiments. Sig., significance: * P < 0.05 vs. baseline; † P < 0.05 vs. controls.
Urine output also decreased during hypoxia with intravenous ACZ, iNaNO2 and combined ACZ i.v. + iNaNO2 compared to baseline, but was not different between groups during the experimental time course. GFR was not different between groups during baseline or hypoxia. Regardless of the intervention, GFR was lower compared to baseline in all groups during hypoxia, but this effect was lost with ACZ i.v. and combined ACZ i.v. + iNaNO2 at the end of the experiment (see Table 4).
Sodium and potassium excretion in urine were slightly reduced with alveolar hypoxia in control animals. Whenever acetazolamide was administered, excretion of sodium decreased only for the first 2 h of hypoxia and was comparable to baseline at the end of the experiment. In contrast, urinary potassium excretion was increased when compared to control animals after baseline and during hypoxia whenever acetazolamide was given (Table 4). Inhalation of sodium nitrite alone had no effect on urinary electrolyte excretion after baseline or during hypoxia and sodium and potassium excretion were comparable to control animals at all time points.
Discussion
The most important results of our experiments are that (1) acetazolamide prevents hypoxic pulmonary vasoconstriction in anaesthetized pigs, (2) a single 30 min inhalation of sodium nitrite reduces HPV acutely, but that this action wanes in the succeeding 3 h of hypoxia as nitrite is metabolized and excreted, and (3) pulmonary artery pressure reduction and nitric oxide production from inhaled NaNO2 are not increased with inhibition of carbonic anhydrase by acetazolamide during alveolar hypoxia in vivo. Therefore, our data argue against a physiological role of carbonic anhydrase as a nitrite reductase or nitrous anhydrase in the lung and blood.
Acetazolamide and hypoxic pulmonary vasoconstriction
We show for the first time that the carbonic anhydrase inhibitor acetazolamide prevents hypoxic pulmonary vasoconstriction in the pig lung. This is in support of previous data from other tissues and animals – ranging from pulmonary artery smooth muscle cells (PASMC) in rats to isolated perfused lungs in rabbits and finally to dogs and humans – showing prevention of hypoxia‐mediated increases in intracellular calcium in PASMC as well as reduction of pulmonary artery pressure and right heart afterload (PVR) with acetazolamide during hypoxia (Deem et al. 2000; Höhne et al. 2004, 2007; Shimoda et al. 2007; Teppema et al. 2007; Ke et al. 2013; Pickerodt et al. 2014).
First, by setting tidal volumes, respiratory rate, measurement of end‐expiratory CO2 and adjusting , we tightly controlled the alveolar partial pressure of oxygen () in these experiments. We thus show that reduction of PAP and PVR with intravenous ACZ is not due to the higher minute ventilation and resultant higher with full CA inhibition (Table 1, Fig. 1 C). This is important, as the decrease in is the major stimulus for HPV (Sylvester et al. 2012, Swenson, 2013). Second, pulmonary vascular resistance is mathematically coupled to cardiac output and increases in CO at equal MPAP could thus lead to a reduction in PVR (Hannon et al. 1990). It is important to note that the reduction in PVR with ACZ was not due to differences in cardiac output (Table 3). The independence of differences in and CO in these experiments supports our earlier findings in the fully awake beagle dog (Höhne et al. 2004; Pickerodt et al. 2014). Third, by using pressure‐controlled, volume‐guaranteed ventilation with fixed inspiratory to expiratory time ratios, we ensured that differences in nitric oxide release were not due to uncontrolled higher expiratory flow rates between protocols (Silkoff et al. 1997). To this end – at equal tidal volumes but higher respiratory rate – expiratory flow was higher with combined ACZ i.v. + iNaNO2 compared to iNaNO2 alone (Table 1). Thus, if differences in expiratory flow rate were to explain our results, comparable NO release would, in contrast, argue for reduced NO release with combined ACZ i.v. + iNaNO2 compared to iNaNO2 alone (Silkoff et al. 1997). Fourth, by precluding admixture of the inspired gas mixtures with any ambient nitric oxide, we exclude the possibility that the pulmonary vascular effects of acetazolamide stem from accidental administration of exogenous NO from ambient air. This is of relevance as Benzing et al. (1999) showed that unintended inhalation of nitric oxide from contaminated compressed air may reduce pulmonary vascular resistance in patients mechanically ventilated for acute lung injury.
We have recently compared different routes of administration of ACZ and their respective effects on the pulmonary vascular response to acute alveolar hypoxia in the beagle dog. We now found a more left‐shifted dose–response curve for carbonic anhydrase inhibition at equal dosing in the pig compared to the dog. This is most probably due to the lower plasma albumin concentration of the pig (2.4–3.3 g dl−1), resulting in lower plasma‐protein binding of ACZ and higher concentration of the free drug in plasma (Hannon et al. 1990).
Of note, complete inhibition of carbonic anhydrase in these experiments was manifested by the higher minute ventilation purposely generated by imposing a higher respiratory rate, which was necessary to achieve equal blood arterial partial pressure of CO2, higher arterial H+ concentration in conjunction with decreasing arterial base excess and increased urinary potassium excretion. With this degree of CA inhibition, the changes in blood pH probably underestimated the degree of lung tissue acidosis and hypercapnia. This is of relevance since a multitude of experimental animal studies show that both hyper‐ and isocapnic acidosis increase HPV in mammals (Sylvester et al. 2012; Swenson, 2013). Thus, the effective pulmonary artery pressure reduction of acetazolamide needs to be viewed against this higher background stimulus for HPV brought about by full carbonic anhydrase inhibition.
Effects of acetazolamide on systemic haemodynamics
We observed reductions in systemic vascular resistance (SVR) with acetazolamide, inhaled nitrite and when both were administered together. The reduction in SVR in the inhaled nitrite groups are likely to be the results of absorption of some portion of the inhaled NO2 dose and then conversion to NO in the systemic circulation. With acetazolamide, the reduction of SVR is probably a result of CA‐mediated peripheral vasodilatation. This has been shown in other studies and may represent a direct effect of acetazolamide on opening calcium‐activated potassium (BK) channels to cause more membrane polarization and vasorelaxation (Pickkers et al. 2001).
Inhaled sodium nitrite and hypoxic pulmonary vasoconstriction
We found that iNaNO2 reduced hypoxic pulmonary vasoconstriction during the first hour of isobaric hypoxia, but that MPAP and PVR were comparable to control animals after the second and third hour of hypoxia (Fig. 2 A, Table 3). In line with the increase in MPAP and PVR occurring beyond 1 h after inhalation of sodium nitrite, exhaled NO production dropped (Fig. 2 C) and nitrite concentration in arterial blood decreased as well (Table 1). Although in the absence of inhaled nitrite the main source of exhaled NO is the upper airways (Silkhoff et al. 1998) and NO in exhaled gas is not considered a valid measurement of vascular nitric oxide generation, the partitioning of NO production from inhaled nitrite between the airways and alveoli has not been studied. It is likely with the evident absorption and rise in measurable blood nitrite concentrations that some of the exhaled NO was generated at the alveolar level, given its far greater surface area. Hunter et al. (2004) also measured reduced efficacy against HPV in line with decreasing exhaled NO concentrations 1 h after iNaNO2 in newborn lambs. While the long‐term effects of iNaNO2 in human non‐hypoxic pulmonary arterial hypertension are currently under investigation (NCT01725269), two recent studies show significant salutary pulmonary vascular effects 1 h after inhalation in patients with heart failure with preserved ejection fraction (Borlaug et al. 2016; Simon et al. 2016).
CA‐mediated NO generation from nitrite and hypoxic pulmonary vasoconstriction
While we have established incontrovertibly that CA inhibition is not the basis for acetazolamide‐mediated HPV reduction, Aamand et al. (2009) interestingly found that NO generation from nitrite is catalysed by carbonic anhydrase and increased by acetazolamide and other CA inhibitors in rodent tissue and blood and that NO‐dependent vasorelaxation in rat aortic strings is increased when CA was inhibited. This points to a possible action of these drugs on CA separate from any binding to the internal active site that activates water and catalyses the reversible reaction of CO2, HCO3 −, and H+. While Strange et al. (1995) showed that the catalytic structures of several bacterial nitrite reductases and mammalian CA share striking similarities in their metal site geometry, this concept is vitiated by the fact that inhibitors binding and occupying the active site of the enzyme should in principle reduce nitrite reduction or nitrous anhydrase activity, not enhance it. In support of this, Liu et al. (2015) could only demonstrate trivial red cell CA‐mediated NO generation from nitrite in isolated erythrocytes and what little was found was reduced by dorzolamide, rather than enhanced. Furthermore, there is no convincing structure within the active site of CA or elsewhere in the protein capable of supporting the one electron reduction of nitrite to form NO or N2O3 (Andring et al. 2018).
Effects of acetazolamide and inhaled nitrite on renal function
We found no significant changes in the renal excretion of sodium and potassium, GFR and urine volume with nitrite administration either with or without acetazolamide. Although we did not measure urinary nitrite excretion, the similarities in the decline of blood nitrite concentration after inhalation with and without acetazolamide suggest that renal carbonic anhydrase inhibition probably does not alter urinary nitrite elimination. This contrasts with an enhanced excretion of endogenous nitrite observed in humans given acetazolamide (Carta & Supuran, 2013) that was taken as evidence for a role of renal CA in filtered nitrite reabsorption.
Limitations of the study
We cannot absolutely claim that pre‐capillary NO generation in our experiments did not increase since our total exhaled NO production measurements are dominated by the substantial contribution of airway epithelial‐mediated NO formation. However, in an earlier study (Vaughan et al. 2003), we showed a statistically significant 5 p.p.b. (10%) rise in exhaled NO when acetylcholine was infused to directly stimulate vascular endothelial cell NOS activity, increase NO generation and cause a reduction in hypoxic pulmonary vasoconstriction. Thus we believe that had acetazolamide stimulated NO production to a level sufficient to affect pulmonary vascular tone, we should have been able to detect it. Furthermore, the possible augmentation of NO production from nitrite by acetazolamide via the putative involvement of carbonic anhydrase (CA) should also be relevant to the airways, which also contain CA. That we did not see any differences gives more support that CA does not appear to mediate NO production from nitrite in the lung.
Another limitation in the study was the need to increase minute ventilation in the pigs treated with acetazolamide. Increasing ventilation to prevent arterial hypercapnia and systemic CO2 retention with acetazolamide will raise the alveolar and reduce the alveolar . Either or both will reduce the magnitude of HPV for any given . However, in the isolated rabbit lung (Deem et al. 2000), where these systemic complications are not present, the magnitude of inhibition by acetazolamide is on par with what is found in most intact animal studies where some degree of change in alveolar and occur. In the dog studies of Höhne et al. (2004), we controlled for the rise in the alveolar induced by spontaneous hyperventilation in the unanaesthetized dogs by lowering the and found that the strength of the effect of acetazolamide on HPV was not significantly altered over this difference in alveolar created by lowering the from 0.12 to 0.10. In the experiments presented here, we also controlled for the increase in alveolar with higher minute ventilation lowering the from 0.145 to 0.12. Thus, we have addressed the issue raised here and can exclude the contribution of higher with ACZ and thus less stimulus for HPV.
A further limitation is that of the failure of end‐capillary equilibration of blood bicarbonate and with red cell CA inhibition, so that the partial pressure values measured at equilibrium in the blood gas analyser lead to an overestimation of the true arterial . This has been a classic unresolved and difficult problem in CA physiology since the earliest experiments with acetazolamide in the 1950s and short of having intravascular electrode measurements, it is not easy to predict what the true prevailing in vivo conditions are. By purposefully hyperventilating the pigs to prevent overt CO2 retention, we probably created a state of relative respiratory alkalosis in the pulmonary microvasculature. The effect of this alone would be to lower HPV, but this would be countered to some extent by the metabolic acidosis caused by renal CA inhibition, as evidenced by the falling blood bicarbonate and base excess values.
In conclusion, we have found no significant additional NO release either in exhaled gas or serum with or without inhaled nitrite when acetazolamide is given in high concentration, nor any greater reduction in hypoxic pulmonary vascular resistance when acetazolamide was added to inhaled nitrite. These findings do not provide any evidence or support for CA being a nitrite reductase or nitrous anhydrase in vivo in either normoxia or hypoxia. Thus, HPV inhibition by acetazolamide and its structurally similar analogues, such as NMA and methazolamide (Lundberg et al. 2008), must involve other mechanisms. These same considerations are likely to rule out the possibility that acetazolamide and other CA inhibitors are vasodilators in the systemic circulation based upon an ability to enhance NO generation from nitrite, as it has been proposed by others (Aamand et al. (2009); Carta & Supuran, 2013).
Additional information
Competing interests
All authors declare no conflict of interests, financial or otherwise.
Author contributions
All experiments were performed at the Department of Experimental Medicine (FEM), Charité – Universitätsmedizin Berlin, Germany. P.A.P., R.C.E.F., T.B., W.B., E.R.S. are responsible for the concept of the experimental work. P.A.P., S.K., A.G.L., P.L., K.V. performed all experiments. S.K., P.L. designed all graphs. T.B. and E.R.S. analysed all data. P.A.P., M.R., R.C.E.F., T.B., W.B. and E.R.S. interpreted the results. P.A.P. and E.R.S. drafted the article, which was revised and further edited by P.A.P., M.R., R.C.E.F., T.B., W.B. and E.R.S. All authors approved the final version of the manuscript. P.A.P. (philipp.pickerodt@charite.de) is the person responsible for research governance.
Funding
This study was supported by a grant from the Deutsche Forschungsgemeinschaft (DFG) to Philipp Pickerodt and Willehad Boemke (Pi 795/2‐2). Erik Swenson received support for this work from the Department of Veterans Affairs as part of his clinical and research duties at the VA Puget Sound Health Care System. Parts of this work have been presented at the ‘Hypoxia Symposium 2015’, Lake Louise, Canada and during the meeting of the American Thoracic Society 2016, San Francisco, USA.
Acknowledgements
The authors are indebted to Birgit Brandt and Sabine Molling for expert technical assistance.
Biography
Erik R. Swenson is a physician‐scientist at the VA Puget Sound Health Care System, directs the pulmonary function/exercise laboratory, and is a Professor of Medicine and Physiology at the University of Washington. He is the editor of High Altitude Medicine and Biology, section editor for the Annals of the American Thoracic Society and on the editorial boards of the Journal of Applied Physiology and American Journal of Respiratory and Critical Care Medicine. His research interests include high altitude medicine and adaptation, exercise, gas exchange, acid–base and pulmonary vascular physiology, comparative physiology and carbonic anhydrase and its inhibitors in numerous organ systems.

Edited by: Harold Schultz & Larissa Shimoda
References
- Aamand R, Dalsgaard T, Jensen FB, Simonsen U, Roepstorff A & Fago A (2009). Generation of nitric oxide from nitrite by carbonic anhydrase: a possible link between metabolic activity and vasodilation. Am J Physiol Heart Circ Physiol 297, H2068–H2074. [DOI] [PubMed] [Google Scholar]
- Andring JT, Lomelino CL, Tu C, Silverman DN, McKenna R & Swenson ER (2018). Carbonic anhydrase II does not exhibit nitrate reductase or nitrous anhydrase activity. Free Rad Biol Med 117, 1–5. [DOI] [PubMed] [Google Scholar]
- Benzing A, Loop T, Mols G & Geiger K (1999). Unintended inhalation of nitric oxide by contamination of compressed air: physiologic effects and interference with intended nitric oxide inhalation in acute lung injury. Anesthesiology 91, 945–950. [DOI] [PubMed] [Google Scholar]
- Borlaug BA, Melenovsky V & Koepp KE (2016). Inhaled sodium nitrite improves rest and exercise hemodynamics in heart failure with preserved ejection fraction. Circ Res 119, 880–886. [DOI] [PMC free article] [PubMed] [Google Scholar]
- Carta F & Supuran CT (2013). Diuretics with carbonic anhydrase inhibitory action: a patent and literature review (2005‐2013). Expert Opin Ther Pat 23, 681–691. [DOI] [PubMed] [Google Scholar]
- Chobanyan‐Jürgens K, Schwarz A, Böhmer A, Beckmann B, Gutzki FM, Michaelsen JT, Stichtenoth DO & Tsikas D (2012). Renal carbonic anhydrases are involved in the reabsorption of endogenous nitrite. Nitric Oxide 26, 126–131. [DOI] [PubMed] [Google Scholar]
- Deem S, Hedges RG, Kerr ME & Swenson ER (2000). Acetazolamide reduces hypoxic pulmonary vasoconstriction in isolated perfused rabbit lungs. Respir Physiol 123, 109–119. [DOI] [PubMed] [Google Scholar]
- Effros RM, Mason G & Silverman P (1981). Assymetric distribution of carbonic anhydrase in the alveolar‐capillary barrier. J Appl Physiol 51, 190–193. [DOI] [PubMed] [Google Scholar]
- Ganz W, Donoso R, Marcus HS, Forrester JS & Swan HJ (1971). A new technique for measurement of cardiac output by thermodilution in man. Am J Cardiol 27, 392–396. [DOI] [PubMed] [Google Scholar]
- Grundy D (2015). Principles and standards for reporting animal experiments in The Journal of Physiology and Experimental Physiology . J Physiol 593, 2547–2549. [DOI] [PMC free article] [PubMed] [Google Scholar]
- Hannon JP, Bossone CA & Wade CE (1990). Normal physiological values for conscious dogs in biomedical research. Lab Anim Sci 40, 293–298. [PubMed] [Google Scholar]
- Höhne C, Krebs MO, Seiferheld M, Boemke W, Kaczmarczyk G & Swenson ER (2004). Acetazolamide prevents hypoxic pulmonary vasoconstriction in conscious dogs. J Appl Physiol 97, 515–521. [DOI] [PubMed] [Google Scholar]
- Höhne C, Pickerodt PA, Francis RC, Boemke W & Swenson ER (2007). Pulmonary vasodilation by acetazolamide during hypoxia is unrelated to carbonic anhydrase inhibition. Am J Physiol Lung Cell Mol Physiol 292, L178–L184. [DOI] [PubMed] [Google Scholar]
- Hunter CJ, Dejam A, Blood AB, Shields H, Kim‐Shapiro DB, Machado RF, Tarekegn S, Mulla N, Hopper AO, Schechter AN, Power GG & Gladwin MT (2004). Inhaled nebulized nitrite is a hypoxia‐sensitive NO‐dependent selective pulmonary vasodilator. Nat Med 10, 1122–1127. [DOI] [PubMed] [Google Scholar]
- Ke T, Wang J, Swenson ER, Zhang X, Hu Y, Chen Y, Liu M, Zhang W, Zhao F, Shen X, Yang Q, Chen J & Luo W (2013). Effect of acetazolamide and gingko biloba on the human pulmonary vascular response to an acute altitude ascent. High Alt Med Biol 14, 162–167. [DOI] [PMC free article] [PubMed] [Google Scholar]
- Liu C, Wajih N, Liu X, Basu S, Janes J, Marvel M, Keggi C, Helms CC, Lee AN, Belanger AM, Diz DI, Laurienti PJ, Caudell DL, Wang J, Gladwin MT & Kim‐Shapiro DB (2015). Mechanisms of human erythrocytic bioactivation of nitrite. J Biol Chem 290, 1281–1294. [DOI] [PMC free article] [PubMed] [Google Scholar]
- Lönnerholm G (1982). Pulmonary carbonic anhydrase in the human, monkey, and rat. J Appl Physiol 52, 352–356. [DOI] [PubMed] [Google Scholar]
- Lundberg JO, Weitzberg E & Gladwin MT (2008). The nitrate‐nitrite‐nitric oxide pathway in physiology and therapeutics. Nat Rev Drug Discov 7, 156–167. [DOI] [PubMed] [Google Scholar]
- Pickerodt PA, Francis RC, Höhne C, Neubert F, Telalbasic S, Boemke W & Swenson ER (2014). Pulmonary vasodilation by acetazolamide during hypoxia: impact of methyl‐group substitutions and administration route in conscious, spontaneously breathing dogs. J Appl Physiol 116, 715–723. [DOI] [PMC free article] [PubMed] [Google Scholar]
- Pickkers P, Hughes AD, Russel FG, Thien T, & Smits P (2001). In vivo evidence for K(Ca) channel opening properties of acetazolamide in the human vasculature. Br J Pharmacol 132, 443–450. [DOI] [PMC free article] [PubMed] [Google Scholar]
- Shimoda LA, Luke T, Sylvester JT, Shih HW, Jain A & Swenson ER (2007). Inhibition of hypoxia‐induced calcium responses in pulmonary arterial smooth muscle by acetazolamide is independent of carbonic anhydrase inhibition. Am J Physiol Lung Cell Mol Physiol 292, L1002–L1012. [DOI] [PubMed] [Google Scholar]
- Silkoff PE, McClean PA, Caramori M, Slutsky AS & Zamel N (1998). A significant proportion of exhaled nitric oxide arises in larger airways in normal subjects. Respir Physiol 113, 33–38. [DOI] [PubMed] [Google Scholar]
- Silkoff PE, McClean PA, Slutsky AS, Furlott HG, Hofstein E, Wakita S, Chapman KR, Szalai JP & Zamel N (1997). Marked flow‐dependency of exhaled nitric oxide using a new technique to exclude nasal nitric oxide. Am J Respir Crit Care Med 155, 260–267. [DOI] [PubMed] [Google Scholar]
- Simon MA, Vanderpool RR, Nouraie M, Bachman TN, White PM, Sugahara M, Gorcsan J 3rd, Parsley EL & Gladwin MT (2016). Acute hemodynamic effects of inhaled sodium nitrite in pulmonary hypertension associated with heart failure with preserved ejection fraction. JCI Insight 1, e89620. [DOI] [PMC free article] [PubMed] [Google Scholar]
- Strange RW, Murphy LM, Dodd FE, Abraham ZH, Eady RR, Smith BE & Hasnain SS (1995). The substrate‐binding site in Cu nitrite reductase and its similarity to Zn carbonic anhydrase. Nat Struct Biol 2, 187–292. [DOI] [PubMed] [Google Scholar]
- Swenson ER (2013). Hypoxic pulmonary vasoconstriction. High Alt Med Biol 14, 101–110. [DOI] [PubMed] [Google Scholar]
- Sylvester JT, Shimoda LA, Aaronson PI & Ward JP (2012). Hypoxic pulmonary vasoconstriction. Physiol Rev 92, 367–520. [DOI] [PMC free article] [PubMed] [Google Scholar]
- Teppema LJ, Balanos GM, Steinback CD, Brown AD, Foster GE, Duff HJ, Leigh R & Poulin MJ (2007). Effects of acetazolamide on ventilatory, cerebrovascular, and pulmonary vascular responses to hypoxia. Am J Respir Crit Care Med 175, 277–281. [DOI] [PubMed] [Google Scholar]
- van Faassen EE, Bahrami S, Feelisch M, Hogg N, Kelm M, Kim‐Shapiro DB, Kozlov AV, Li H, Lundberg JO, Mason R, Nohl H, Rassaf T, Samouilov A, Slama‐Schwok A, Shiva S, Vanin AF, Weitzberg E, Zweier J & Gladwin MT (2009). Nitrite as a regulator of hypoxic signaling in mammalian physiology. Med Res Rev 29, 683–741. [DOI] [PMC free article] [PubMed] [Google Scholar]
- Vaughan DJ, Brogan TV, Kerr ME, Deem S, Luchtel DL & Swenson ER (2003). Contributions of nitric oxide synthase isozymes to exhaled nitric oxide and hypoxic pulmonary vasoconstriction in rabbit lungs. Am J Physiol Lung Cell Mol Physiol 284, L834–L843. [DOI] [PubMed] [Google Scholar]
- Zweier JL, Wang P, Samouilov A & Kuppusamy P (1995): Enzyme‐independent formation of nitric oxide in biological tissues. Nat Med 8, 804–809. [DOI] [PubMed] [Google Scholar]