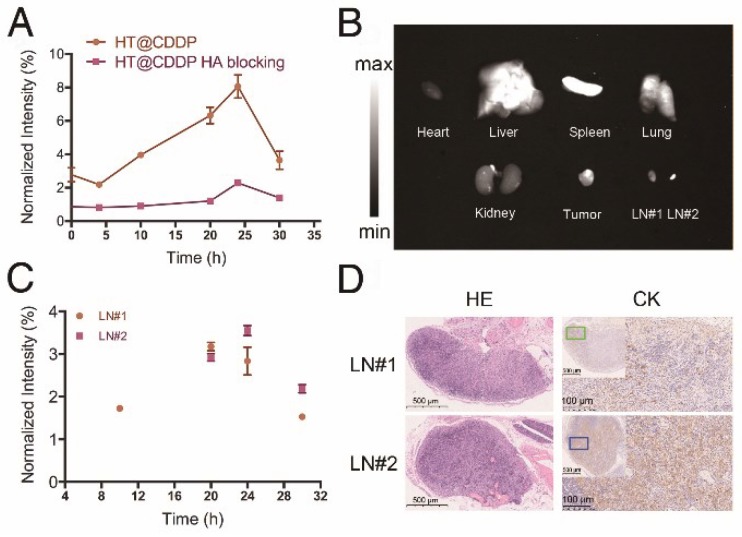
Figure 8.
The fluorescence intensity of tumor, metastatic lymph nodes and dissected organs. (A) The NIR-II SBR (signal intensity-to- -background ratio) of tumors in the HT@CDDP and HA blocking groups at different time points. Data shown here are mean ± SE (n=3). (B) NIR-II imaging of dissected organs, tumor tissues, and lymph nodes at 30 h postinjection. (C) The NIR-II signal intensity of lymph nodes at different time points. The results represent mean ± SE (n=3). (D) HE and CK staining of LN#1 and LN#2.

