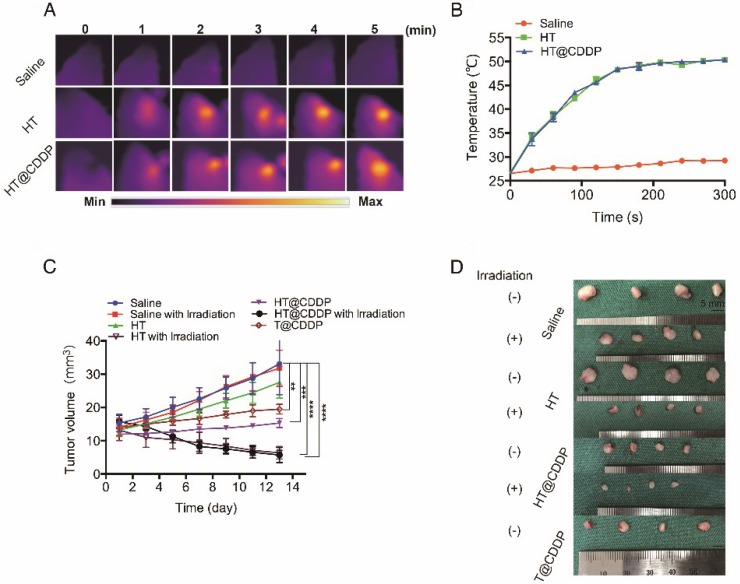
Figure 9.
The photothermal property in vivo and anti-tumor ability of NPs. (A) Heat map of the tumors in vivo after injecting HT@CDDP and HT. The range min-max represents 24.2℃ -54.3 ℃. (B) The in vivo temperature curves. The results represent mean ± SE (n=4). (C) In vivo anti-tumor efficacy is detected by tumor volumes and the results are expressed as the mean ± SE (n = 4), *P < 0.05, **P < 0.01. (D) Mice tumor photographs.

