Figure 2.
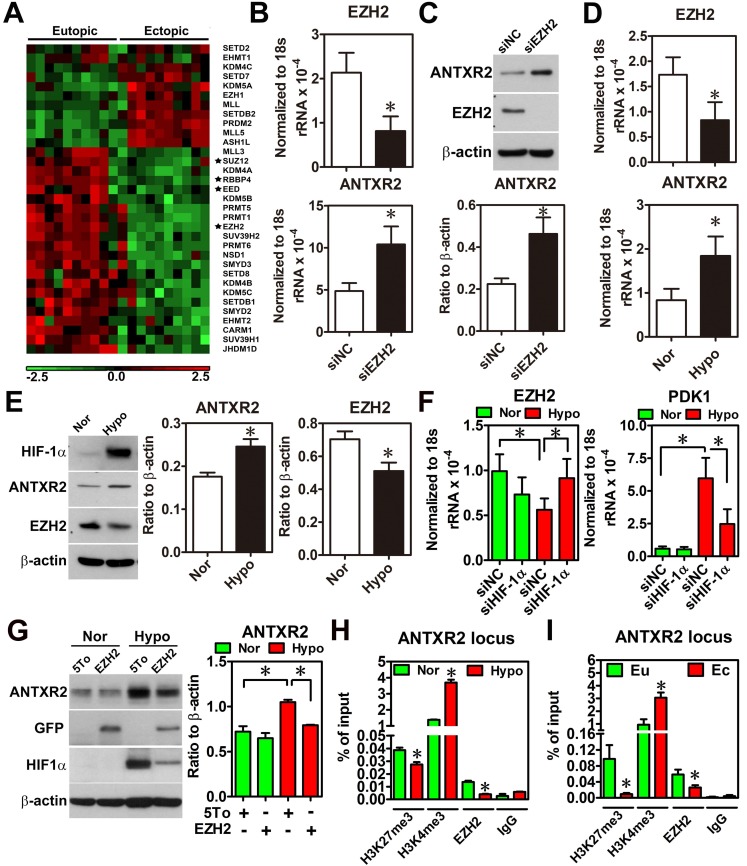
Hypoxia-induced ANTXR2 was mediated by EZH2 downregulation. (A) Hierarchical clustering of histone methyltransferases and histone demethylase is shown as a heat map by using a public dataset containing eutopic endometrial and ectopic endometriotic tissues. Normalized probe intensity values were translated into colors with green corresponding to low expressed genes and red to high expressed genes. Stars indicate core components of PRC2. (GSE7305) (B) ANTXR2 RNA and (C) protein levels in normal eutopic stromal cells with EZH2 knocked down (n = 3) (D) Levels of ANTXR2 and EZH2 RNA and (E) protein in the normal eutopic stromal cells treated with hypoxia (1% O2) for 24 h (n = 3). (F) Levels of EZH2 and PDK1 (positive control for hypoxia) mRNA in eutopic stromal cells cultured under normoxia or hypoxia with or without HIF-1α knockdown for 24 h (n = 4). (G) Representative Western blot (left panel) and quantified result (right panel) of ANXTR2 in eutopic stromal cells overexpressed with empty vector or EZH2-GFP under normoxia or hypoxia for 24 h (n = 3). (H) Chromatin immunoprecipitation (ChIP) using H3K27me3, H3K4me3 and EZH2 antibodies was performed in eutopic stromal cells treated with normoxia (Nor) or hypoxia (hypo) for 48 h. Specific primers were designed to amplify ANTXR2 locus (n = 3). (I) Chromatin immunoprecipitation (ChIP) assay was performed in eutopic and ectopic stromal cells by using H3K27me3, H3K4me3, and EZH2 antibodies. Specific primers were designed to amplify ANTXR2 locus (n = 3). The asterisk (*) indicates P < 0.05. Results were presented as means ±SEM.

