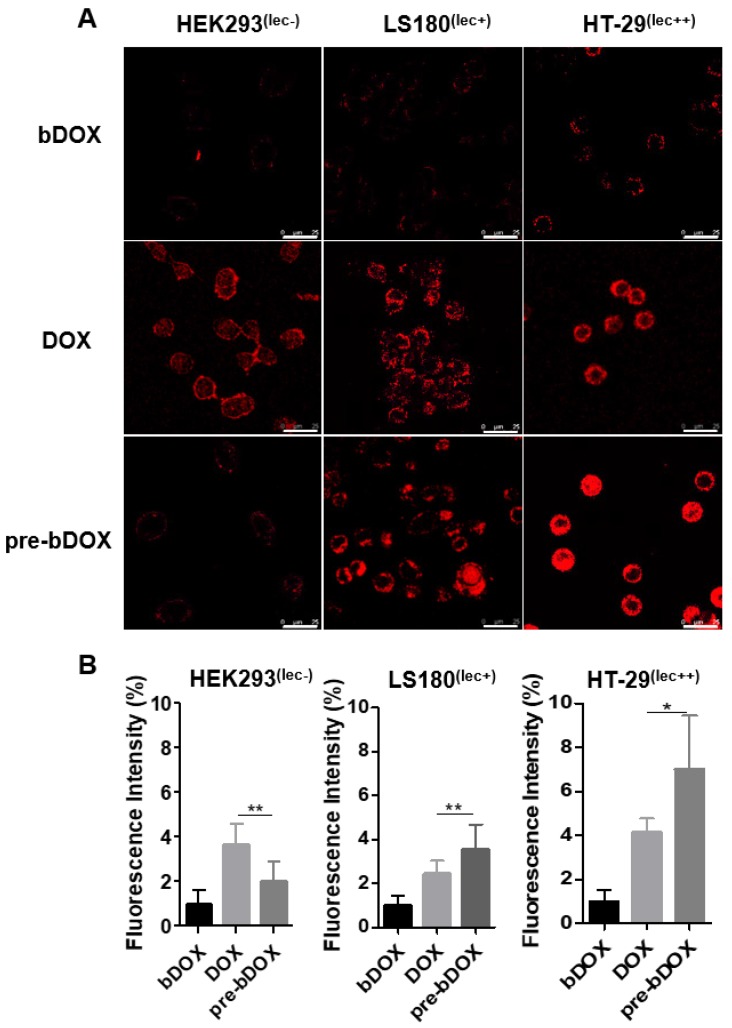
Figure 4.
In vitro cellular uptake. (A) Confocal laser scanning microscopy (CLSM) images of cellular uptake of bDOX, free DOX and pre-targeted bDOX in HEK293 , LS180 , and HT-29 cells. The scale bar represents 25 μm. (B) Fluorescence intensity percentages of the treated cells. The values represent mean ± SD (n = 7). * p < 0.05; ** p < 0.01. (pre-bDOX: pre-targeted bDOX).

