Abstract
Autophagy has been identified as a cellular process of bulk degradation of cytoplasmic components and its persistent activation is critically involved in the renal damage induced by ureteral obstruction. However, the role and underlying mechanisms of autophagy in hyperuricemic nephropathy (HN) remain unknown. In the present study, we observed that inhibition of autophagy by 3-methyladenine (3-MA) abolished uric acid-induced differentiation of renal fibroblasts to myofibroblasts and activation of transforming growth factor-β1 (TGF-β1), epidermal growth factor receptor (EGFR), and Wnt signaling pathways in cultured renal interstitial fibroblasts. Treatment with 3-MA also abrogated the development of HN in vivo as evidenced by improving renal function, preserving renal tissue architecture, reducing the number of autophagic vacuoles, and decreasing microalbuminuria. Moreover, 3-MA was effective in attenuating renal deposition of extracellular matrix (ECM) proteins and expression of α-smooth muscle actin (α-SMA) and reducing renal epithelial cells arrested at the G2/M phase of cell cycle. Injury to the kidney resulted in increased expression of TGF-β1 and TGFβ receptor I, phosphorylation of Smad3 and TGF-β-activated kinase 1 (TAK1), and activation of multiple cell signaling pathways associated with renal fibrogenesis, including Wnt, Notch, EGFR, and nuclear factor-κB (NF-κB). 3-MA treatment remarkably inhibited all these responses. In addition, 3-MA effectively suppressed infiltration of macrophages and lymphocytes as well as release of multiple profibrogenic cytokines/chemokines in the injured kidney. Collectively, these findings indicate that hyperuricemia-induced autophagy is critically involved in the activation of renal fibroblasts and development of renal fibrosis and suggest that inhibition of autophagy may represent a potential therapeutic strategy for HN.
Keywords: autophagy, hyperuricemic nephropathy, 3-methyladenine, renal fibrosis, transforming growth factor-β1
Introduction
Emerging data demonstrate that uric acid is tightly linked to cardiovascular disease, diabetes, and high mortality in patients with chronic kidney diseases (CKD) [1–3]. Multiple factors such as hypertension, diabetes, and proteinuria promote onset and progression of CKD to end stage of renal disease (ESRD) [4,5]. Recent human and animal studies have uncovered that hyperuricemia is also an independent risk factor of CKD and is prevalent in patients with this disease [6]. Thus, understanding the mechanism by which uric acid induces pathological changes in the kidney will aid to develop novel therapeutic approaches for alleviating the progression of CKD.
Our recent studies have shown that hyperuricemia-induced kidney injury connects with the pathogenesis of renal fibrogenesis, which is mediated by activation of epidermal growth factor receptor (EGFR) and TGF-β signaling [7]. Blocking EGFR inhibited hyperuricemia-induced activation of the transforming growth factor-β1 (TGF-β1)/Smad3 signaling pathway [7]. TGF-β1/Smad3 signaling pathway is one of the critical mechanisms in driving expression of multiple profibrotic genes and mediating fibroblast activation in the pathogenesis of kidney fibrogenesis [8]. Independent of profibrogenic process of Smads, TGF-β-activated kinase 1 (TAK1) is a major upstream signaling molecule in TGF-β1-induced expression of collagen I and fibronection through activation of the MAPK kinase (MKK)3-p38 and MKK4-JNK signaling cascades, respectively [9,10]. In addition, kidney fibrosis is accompanied by sustained expression of developmental genes, such as Wnt and Notch [11–13]. These signaling pathways contribute to the pathogenesis of renal fibrosis. More recent work demonstrated that proximal tubular cells arrested in the G2/M stage of cell cycle after injury facilitate secretion of profibrotic cytokines, eventually leading to kidney fibrosis [14].
Hyperuricemia-elicited kidney injury is also associated with inflammation [7]. Uric acid can trigger inflammatory responses by activating some transcription factors, such as nuclear factor-κB (NF-κB), and induce production and release of multiple profibrotic and pro-inflammatory chemokines/chemokines like tumor necrotic factor-α (TNF-α), interleukin-1β (IL-1β), monocyte chemoattractant protein-1 (MCP-1), and regulated upon activation normal T-cell expressed and secreted (RANTES) [7,15]. It has been observed that hyperuricemia-elicited endothelium injury and vascular dysfunction correlated with a reduction of NO and overproduction of inflammatory cytokines through the NF-κB signaling pathway [16].
Autophagy is a crucial and rudimentary biological process involved in both physiological and pathological conditions [17]. Physiologically, it is the degrading process of proteins and organelles mediated by lysosomes and participates in the regulation of cell metabolism and survival [17]. However, defective autophagy is associated with pathological conditions, for instance, autoimmune disease, tumorigenesis, neurodegenerative disease, and senescence [18–21]. Based on the difference between channels that deliver substances to lysosomes, autophagy is classified into three types, macroautophagy, microautophagy, and chaperone-mediated autophagy (CMA) [17,22]. Iconic proteins in autophagic membrane mainly include microtubule-associated protein 1 light chain 3 (LC3), Beclin-1, autophagy-related gene (Atg) 7 (Atg7), Atg12 and autophagy-adjusted protein [17,22]. Recent studies have shown that persistent activation of autophagy can promote renal damage induced by ureteral obstruction through the mechanisms involved in tubular cell death, interstitial inflammation, and production of profibrotic factors [17]. However, whether autophagy promotes the development of HN remains unknown.
In the present study, we assessed the effect of autophagy inhibition on uric acid-stimulated renal fibroblast activation in cultured rat renal kidney fibroblasts (NRK-49F) and investigated its therapeutic potential in a rat model of HN induced by feeding a mixture of adenine and potassium oxonate. Moreover, we elucidated the mechanisms by which blockade of autophagy alleviates the development of HN.
Materials and methods
Antibodies and reagents
3-Methyladenine (3-MA) was purchased from Selleckchem (Houston, TX). Antibodies to p-Smad3, Smad3, p-extracellular signal–regulated kinases 1/2 (ERK1/2), ERK1/2, p-EGFR, Beclin-1, Notch1, p-TAK1, TAK1 were purchased from Cell Signaling Technology (Danvers, MA). Antibodies to Collagen I (A2), GAPDH, EGFR, TGFβRI, p-NF-κB (p65), NF-κB (p65), TNF-α, Jagged-1, CD68 and CD3 were purchased from Santa Cruz Biotechnology, Inc. (Santa Cruz, CA). Anti-p-Histone H3 antibody was purchased from Abcam (Cambridge, MA). MCP-1, RANTES, TGF-β1 ELISA kits and antibody to lipocalin-2 (Lcn2) were purchased from R&D systems (Minneapolis, MN). Anti-LC3 antibody was purchased from Novus Biologicals (Littleton, CO). Anti-β-Catenin antibody was purchased from BD Biosciences (San Diego, CA). Anti-Wnt1 antibody was purchased from Rockland (Limerick, PA, U.S.A.). Vectastain ABC kit was from Vector Laboratories (Burlingame, CA). Malondialdehyde (MDA) and superoxide dismutase (SOD) biochemical reagent kits were purchased from Nanjing Jiancheng Bioengineering Institute (Nanjing, China). Antibodies to α-smooth muscle actin (α-SMA ) and β-actin, secondary antibodies for Western blot, and all other chemicals were purchased from Sigma (St. Louis, MO).
Cell culture and treatment
Rat renal interstitial fibroblasts (NRK-49F) were cultured in Dulbecco’s modified Eagle’s medium (DMEM) with F12 containing 10% FBS, 1% penicillin and streptomycin in an atmosphere of 5% CO2, and 95% air at 37°C. To examine the impact and mechanisms of 3-MA, a specific autophagy inhibitor, on uric acid-stimulated renal fibroblast activation, NRK-49F cells were starved for 24 h with DMEM containing 0.5% FBS and then exposed to uric acid (800 μmol/l) for 36 h in the presence or absence of autophagy inhibitor. Then, cells were harvested for immunoblot analysis.
Animals and treatment
Male Sprague–Dawley rats (6–8 weeks old) that weighed 200–220 g were purchased from Shanghai Super – B&K Laboratory Animal Corp. Ltd. Twenty-four male rats were randomly assigned to four groups of six rats: sham, sham treated with 3-MA (15 mg/kg), HN group, and HN treated with 3-MA (15 mg/kg) group. Six rats were used in each group. The HN model was established in male SD rats as described in our previous studies [7,15]. In brief, rats were fed a mixture of adenine (0.1 g/kg) and potassium oxonate (1.5 g/kg) daily for 3 weeks and then killed. The kidneys were collected for protein analysis and histological examination. Twenty-four-hour urine samples were collected in metabolic cages at day 0 and weekly for determining protein levels. Blood was taken once a week for measuring serum uric acid, blood urea nitrogen (BUN), creatinine, and other biochemistry index. The animal protocol was reviewed and approved by the Institutional Animal Care and Use Committee at Tongji University, China.
Assessment of renal function and other biochemistry index
Serum uric acid, creatinine, and BUN as well as urinary microalbumin were measured by automatic biochemistry assay (P800, Modular, U.S.A.) as described in our previous studies [7,15]. In brief, blood sample was centrifuged at 2500 rpm/min for 5 min and 200 μl serum was put in an automatic biochemistry analyzer (P800, Modular, U.S.A.) for analysis.
Assessment of oxidative stress index
After 3 weeks of daily feeding of the mixture of adenine and potassium oxonate with or without 3-MA administration, collected kidney samples were ground and homogenized. The concentration of SOD and MDA in kidney tissues were detected by commercial kits according to the manufacturer’s instructions, and the final levels of SOD and MDA were normalized to the protein concentration of kidney tissue homogenate.
Immunoblot analysis
Cells were washed once with ice-cold PBS and harvested in a cell lysis buffer mixed with a protease inhibitor cocktail following various treatments. To prepare protein samples for immunoblot, the kidney tissue samples were homogenized with cell lysis buffer and with protease inhibitor cocktail. Proteins were separated by SDS/PAGE and transferred to nitrocellulose membranes. After incubation with 5% non-fat milk for 1 h at room temperature, membranes were incubated with a primary antibody overnight at 4°C and then incubated with appropriate horseradish peroxidase–conjugated secondary antibody for 1 h at room temperature. Bound antibodies were visualized by chemiluminescence detection. The densitometry analysis of immunoblot results was determined by NIH Image software (National Institutes of Health, Bethesda, MD).
Immunofluorescent and immunohistochemical staining
Immunofluorescent and immunohistochemical staining was performed according to the procedure described in our previous studies [7,15]. Formalin-fixed kidneys were embedded in paraffin and prepared in 3-μm-thick sections. For immunofluorescent staining, the tissue sections were rehydrated and labeled with primary antibodies p-Histone H3, and then exposed to Texas red-labeled or FITC green-labeled secondary antibodies (Invitrogen). For assessment of renal fibrosis, Masson’s trichrome staining was carried out according to the protocol provided by the manufacturer (Sigma, St. Louis, MO). The collagen tissue area (blue color) was quantitatively measured by using ImagePro Plus software (Media Cybernetics, Silver Spring, MD, U.S.A.) by drawing a line around the perimeter of positive staining area, and the average ratio to each microscopic field (400×) was calculated and graphed. For general histology, sections were stained with Periodic acid–Schiff and Sirius Red. To assess the extent of tubular injury, morphological damage (epithelial necrosis, luminal necrotic debris, and tubular dilation) in 3–4 sections per kidney and 10–12 fields per section were quantitated using the following scale: normal = 0; injury < 30% = 1; 30–60% = 2; and injury > 60% = 3. Rabbit anti-Lcn2, rabbit anti-TNF-α, and mouse anti-α-SMA (Sigma–Aldrich) antibodies were used for immunohistochemical staining. Severity of inflammation was graded by counting the absolute number of CD68-positive cells and CD3-positive cells in each field and reported as the mean of 20 random high-power (200×) fields in each rat in six rats per group.
Glomerulosclerosis index
A semiquantitative glomerulosclerosis index was used to evaluate the degree of glomerulosclerosis in Periodic acid–Schiff (PAS) staining [23]. Severity of sclerosis for each glomerulus was graded on a 0–4 scale, which represents the sclerotic area of the glomerulus (0 represents no lesion, 1 represents 1–25%, 2 represents 26–50%, 3 represents 51–75%, 4 represents 76–100%). The total number of different grades was recorded as N0, N1, N2, N3, and N4, respectively. We observed 30 glomeruli selected at random from each kidney and obtained the final glomerulosclerosis index according to the formula: (0×N0 + 1×N1 + 2×N2 + 3×N3 + 4×N4)/30.
ELISA analysis
ELISA analysis was performed according to the procedure described in our previous studies [7,15]. Briefly, to assess renal expression of inflammatory cytokines such as MCP-1, RANTES, and TGF-β1, rat kidneys were homogenized and the supernatant was recovered after centrifugation at 19000 rpm/min for 20 min at 4°C. Multiple cytokines’ level of kidney sample was examined by using the commercial Quantikine ELISA kit in accordance with the protocol specified by the manufacturer (ELISA kit, R&D systems, Minneapolis, MN).
Examination of autophagic vacuoles in renal tissue by EM
EM was performed to observe the morphology of autophagic structures. After indicated treatments, the rats were killed and perfused with 10 ml (10 units/ml) heparin, followed by 50 ml fixative. Kidneys were then harvested and postfixed in the same fixative (100 mmol/l sodium cacodylate, 2 mmol/l CaCl2, 4 mmol/l MgSO4, 4% paraformaldehyde, and 2.5% glutaraldehyde). Approximately 1 mm3 of tissue cube was collected from each kidney, including a portion of renal cortex and outer medulla for standard EM processing. And various autophagic structures including phagophore, autophagosome, and autolysosome in proximal tubular cells were revealed at high magnification (×10000). For quantitation, 20–30 fields of magnification (×10000) were randomly selected from each kidney and digital images with scale bars were taken. Using Axio Vision 4 software, the amount of autophagic vacuoles per unit cytoplasmic area of 100 μm was evaluated.
Statistical analysis
All the experiments were performed at least three times. Data depicted in graphs represent the means ± S.E.M. for each group and were subjected to one-way ANOVA. Multiple means were compared using Tukey’s test. The differences between two groups were determined by Student’s t test. Statistical significant difference between mean values was depicted in each graph. P<0.05 is considered as significant difference.
Results
3-MA blocks uric acid-induced expression of α-SMA and collagen I as well as up-regulation of autophagy markers in cultured NRK-49F
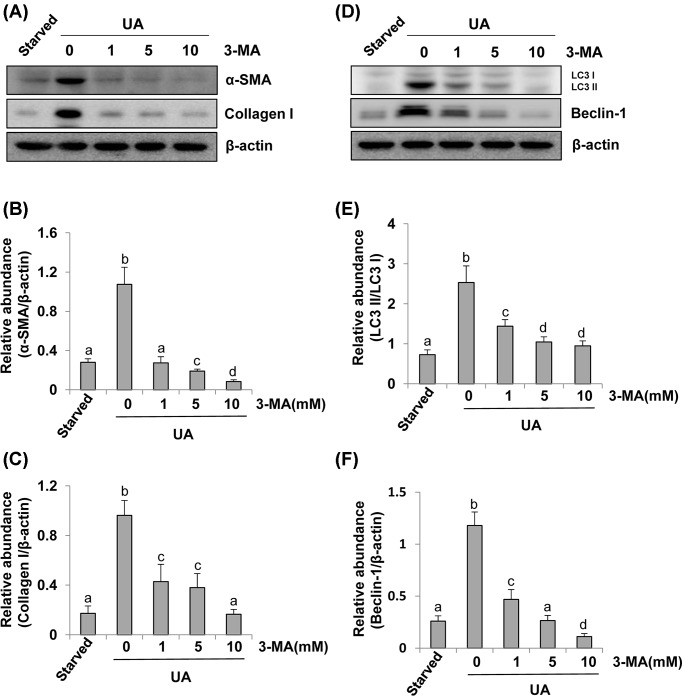
As renal fibroblast activation is considered as a pivotal mechanism of HN [24], we examined the impact of pharmacological inhibition of autophagy by 3-MA, a highly selective inhibitor of autophagy, on uric acid-induced activation of renal fibroblasts (NRK-49F). NRK-49F cells were starved for 24 h with DMEM containing 0.5% FBS and then exposed to uric acid for 36 h in the presence or absence of 3-MA. Then, cells were harvested for immunoblot analysis. The autophagy levels were assessed by detecting Beclin-1 and the ratio of LC3II/I [17]. Figure 1A showed that compared with serum-starved NRK-49F, uric acid-exposed NRK-49F expressed higher protein levels of α-SMA and collagen I, hallmarks of activated renal interstitial fibroblasts [7]. In the presence of 3-MA, uric acid-induced α-SMA and collagen I expression were abolished (Figure 1A–C). Uric acid also triggered a significant up-regulation of LC3II/I and Beclin-1 (Figure 1D–F). 3-MA dose-dependently suppressed these responses (Figure 1A–F). Taken together, these results indicate that hyperuricemic injury can induce autophagy, which is essential for the activation of renal interstitial fibroblasts in vitro.
Figure 1. Administration of 3-MA inhibits uric acid-induced activation of cultured renal interstitial fibroblasts and expression of LC3 and Beclin-1.
Cultured NRK-49F cells were starved for 24 h and then exposed to 800 μM of uric acid for 36 h in the absence or presence of 3-MA (0–10 mM). Cell lysates were subjected to immunoblot analysis using antibodies to α-SMA, Collagen I, or β-Actin (A). Expression levels of α-SMA and Collagen I were quantitated by densitometry and normalized with β-Actin (B,C). Cell lysates were subjected to immunoblot analysis using antibodies to LC3, Beclin-1, or β-Actin (D). LC3 was showed in LC3II/I ratio (E). Beclin-1 was quantitated by densitometry and normalized with β-Actin (F). Data are represented as the mean ± S.E.M. Means with different superscript letters are significantly different from one another (P<0.05).
3-MA inhibits uric acid-induced activation of multiple signaling pathways associated with renal fibroblast activation
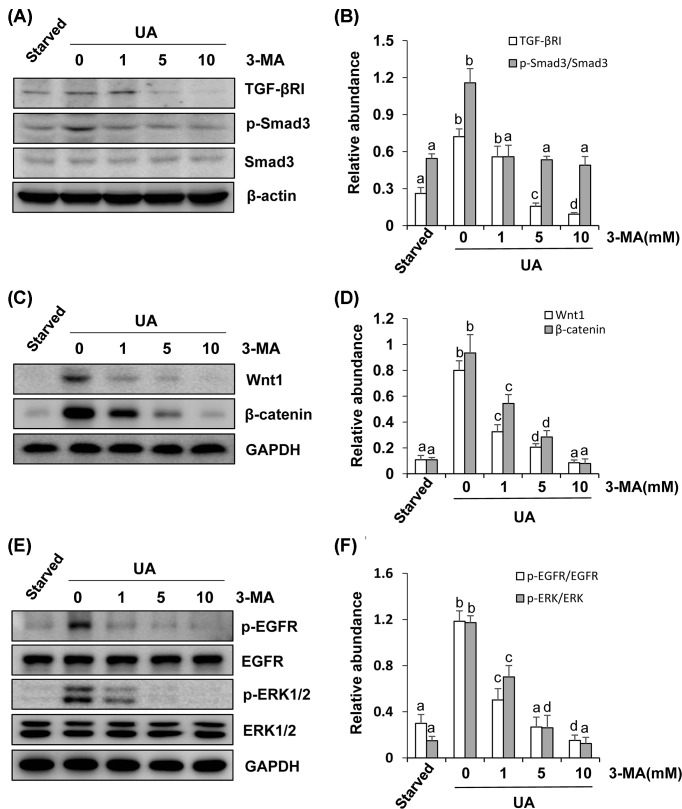
Our previous study has demonstrated that multiple signaling pathways are activated in the process of uric acid-induced renal fibrosis [7]. But it remains unknown whether autophagy plays a role in the activation of signaling pathways associated with renal fibroblast activation. To investigate the possible role of autophagy in this process, we examined the effect of 3-MA on the expression and/or phosphorylation of TGF-βRI, Smad3, Wnt1, β-catenin and EGFR, and ERK1/2 in cultured renal interstitial fibroblasts. As indicated in Figure 2A, TGF-βRI and total Smad3 were expressed in renal interstitial fibroblasts and uric acid exposure increased TGF-βRI expression and Smad3 phosphorylation. Treatment with 3-MA decreased TGF-βRI expression levels and the ratio of p-Smad3/Smad3 in a dose-dependent manner (Figure 2A,B). Uric acid exposure also increased expression of Wnt1 and β-catenin as well as induced phosphorylation of EGFR and ERK1/2, 3-MA treatment dose-dependently inhibited all these responses (Figure 2C–F). Thus, autophagy may contribute to uric acid-induced activation of multiple pro-fibrotic signaling pathways in cultured renal fibroblasts.
Figure 2. Inhibition of autophagy suppresses the TGF-β/Smad, Wnt/β-catenin, EGFR/ERK1/2 signaling pathway in renal interstitial fibroblasts.
Cultured NRK-49F cells were starved for 24 h and then exposed to 800 μM of uric acid for 36 h in the absence or presence of 3-MA (0–10 mM). Cell lysates were subjected to immunoblot analysis using antibodies to TGF-βRІ, p-Smad3, Smad3, or β-Actin (A). Expression levels of TGF-βRІ were quantitated by densitometry and normalized with β-Actin; expression levels of p-Smad3 and Smad3 were calculated by densitometry and the ratio between p-Smad3 and Smad3 was determined (B). Cell lysates were prepared and subjected to immunoblot analysis with antibodies to Wnt1, β-catenin, and GAPDH (C). Expression levels of Wnt1 were quantitated by densitometry and normalized with GAPDH and expression levels of β-catenin were quantitated by densitometry and normalized with GAPDH (D). Cell lysates were prepared and subjected to immunoblot analysis with antibodies to p-EGFR, EGFR, p-ERK1/2, ERK1/2, and GAPDH (E). Expression levels of p-EGFR and EGFR were calculated by densitometry and the ratio between p-EGFR and EGFR was determined (F). Expression levels of p-ERK1/2 and ERK1/2 were calculated by densitometry and the ratio between p-ERK1/2 and ERK1/2 was determined (F). Data are represented as the mean ± S.E.M. Means with different superscript letters are significantly different from one another (P<0.05).
Administration of 3-MA inhibits autophagy in the kidney of hyperuricemic rats
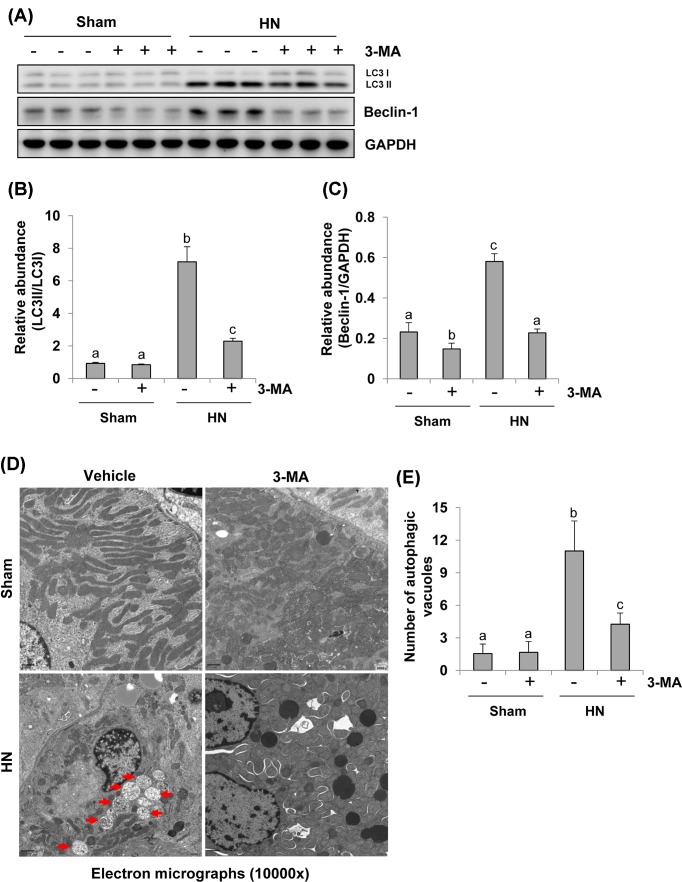
To further assess the role of autophagy in HN, we established a rat model of HN by daily feeding a mixture of adenine and potassium oxonate for 3 weeks. As indicated in Figure 3, rats with hyperuricemic damage displayed increased expression of LC3II/I and Beclin-1 in the kidney. Treatment with 3-MA remarkably reduced their expression levels. Notably, LC3II/I and Beclin-1 were barely observed in the kidneys of sham rats. 3-MA treatment reduced expression of Beclin-1 but did not alter expression of LC3II/I in the kidney of sham rats (Figure 3A–C). To validate the autophagy in this model and the efficacy of 3-MA treatment, we further examined the appearance of autophagosomes and related autophagic vacuoles by EM (×10000) (Figure 3D). The structures of autophagosomes were identified as double or multiple membrane structures containing cytoplasm or undigested organelles, the autolysosomes appeared to be single membrane structures with remnants of cytoplasmic components. We adopted morphometric analysis to calculate the number of autophagic vacuoles per unit cytoplasmic area of 100 μm. Consistent with the results of immunoblots of LC3-II accumulation in renal tissues, rare autophagic vacuoles were shown in the kidneys of sham rats with or without 3-MA. In contrast, numerous autophagic vacuoles appeared in proximal tubular cells of rats with HN. However, 3-MA treatment reduced the number of autophagic vacuoles (Figure 3D,E). Thus, these data illustrate that hyperuricemia can induce formation of autophagic vacuoles, which may be related to the damage of organelles and collapse of cytoplasm and that 3-MA treatment is able to block these detrimental effects induced by uric acid.
Figure 3. Administration of 3-MA inhibits autophagy activation and reduces the number of autophagic vacuoles in hyperuricemic rats.
The tissue lysates prepared from sham or hyperuricemic kidneys of rats treated with/without 3-MA were subjected to immunoblot analysis with antibodies against LC3, Beclin-1 or GAPDH (A). The levels of LC3, Beclin-1, and GAPDH were quantitated by densitometry, and LC3 was shown in LC3II/I ratio, and Beclin-1 levels were normalized to GAPDH (B,C). High magnification of election micrographs showing autophagic vacuoles in renal tubular cells (autophagic vacuoles indicated by arrowheads) (10000×) (D). Quantitation of the number of autophagic vacuoles per 100 μm cytoplasm (E). Data are represented as the mean ± S.E.M. (n=6). Means with different superscript letters are significantly different from one another (P<0.05).
Autophagy inhibition prevents renal function and proteinuria and alleviates renal histopathologic changes in hyperuricemic rats
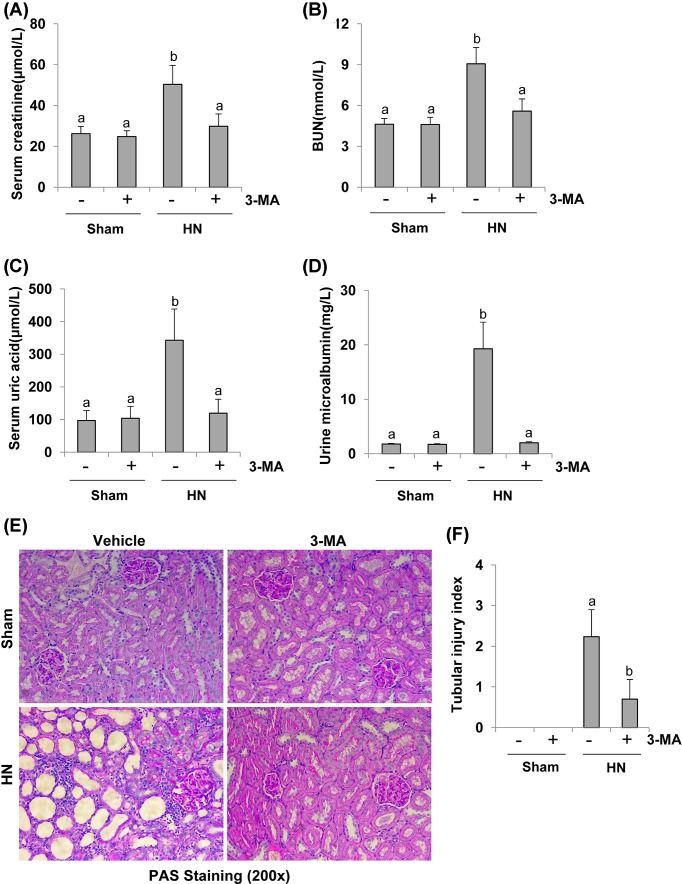
To investigate the efficacy of autophagy inhibition in preventing renal dysfunction and reducing proteinuria in vivo, we examined the effect of 3-MA on renal function and microalbumin in hyperuricemic nephropathy (HN). After 3 weeks of daily feeding the mixture of adenine and potassium oxonate, serum uric acid, creatinine, BUN, and urine microalbumin were increased in rats with HN, and 3-MA administration significantly reduced serum levels of uric acid, creatinine, and BUN as well as proteinuria (Figure 4A–D). PAS staining further showed that serious glomerulosclerosis, tubulointerstitial lesions in the kidney of HN. The majority of proximal tubules became dilated and lined by flat, thin epithelium lack of brush borders after uric acid injury. 3-MA administration ameliorated the pathology of tubular atrophy, interstitial fibrosis, and glomerulosclerosis (Figure 4E,F and Supplementary Figure S1A,B). Seminal scoring analysis showed that 3-MA improved tubular injury by 60%. No significant histopathological changes were observed in the kidney of rats without feeding a mixture of adenine and potassium oxonate (Figure 4F). Collectively, these data indicate that autophagy contributes to renal dysfunction and histopathological damage. Inhibition of autophagy by 3-MA reduces serum levels of uric acid, improves renal function, decreases proteinuria, preserves renal tissue architecture in hyperuricemic rats.
Figure 4. Administration of 3-MA reduces proteinuria, improves renal dysfunction, and attenuates renal pathological impairment in hyperuricemic rats.
Blood was collected after 3 weeks of daily feeding of the mixture of adenine and potassium oxonate with or without 3-MA administration in male Sprague–Dawley rats. Expression levels of serum creatinine (A), serum BUN (B), serum uric acid (C), and urine microalbumin (D) were examined by using automatic biochemistry assay. Photomicrographs (200×) illustrate PAS staining of the kidney tissues in control or HN rats with/without 3-MA (E). Tubular morphologic changes (epithelial necrosis, luminal necrotic debris, and tubular dilation) in 3–4 sections per kidney and 10–12 fields per section were quantitated using the following scale: normal = 0; injury < 30% = 1; 30–60% = 2; and injury > 60% = 3 (F). Data are represented as the mean ± S.E.M. (n=6). Means with different superscript letters are significantly different from one another (P<0.05).
Administration of 3-MA attenuates renal Lcn2 expression and decreases oxidative stress in the kidney of hyperuricemic rats
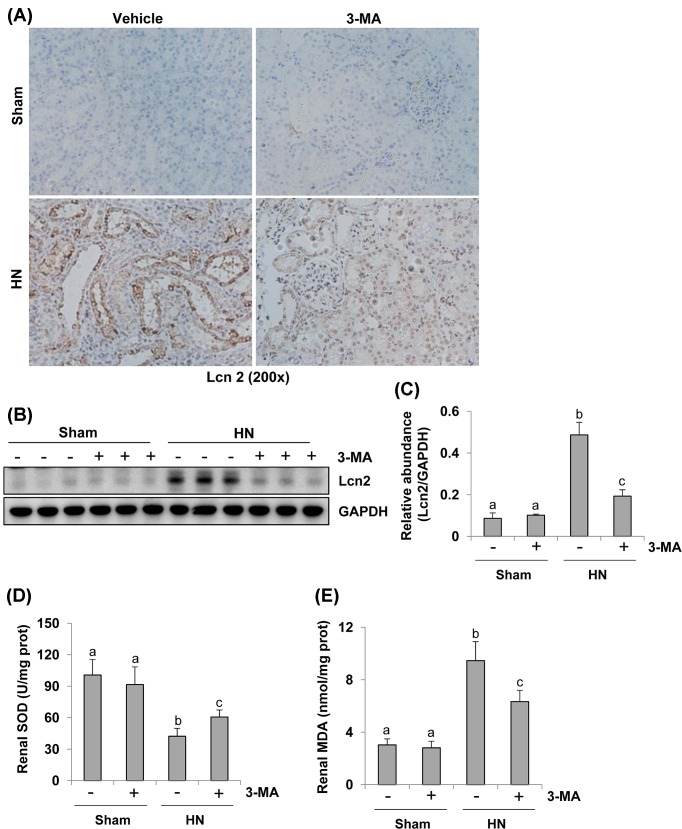
It has been documented that Lcn2 is a well-known biomarker of renal tubular injury in both acute and chronic kidney injuries [25,26]. To understand whether 3-MA would be able to suppress tubular damage in rats with HN, we examined the effect of 3-MA on the expression of Lcn2 in rats with HN. As shown in Figure 5A, immunohistochemistry staining demonstrated that Lcn2 expression was barely observed in the renal tubules of sham kidneys with or without treatment of 3-MA, but it was dramatically increased in renal tubules of HN. Lcn2-positive staining dots were also seen in the lumen of some tubules of injured kidney, suggesting that they were debris detached from tubular cells. Blockade of autophagy reduced renal Lcn2 expression. These results were confirmed by decreased expression levels of Lcn2 in kidney tissues collected from hyperuricemic rats with 3-MA administration compared with those without 3-MA treatment by immunoblot analysis (Figure 5B,C). Thus, these data indicate that 3-MA can effectively inhibit renal tubular cell damage in rats with HN.
Figure 5. Administration of 3-MA reduces expression of Lcn2 and decreases oxidative stress in the kidney of hyperuricemic rats.
Photomicrographs illustrate Lcn2 with immunohistochemical staining of kidney tissue collected at day 21 after feeding of the mixture of adenine and potassium oxonate with/without 3-MA (A). The kidney tissue lysates were subjected to immunoblot analysis with specific antibodies against Lcn2 and GAPDH (B). Expression levels of Lcn2 were quantitated by densitometry and normalized with GAPDH (C). Biochemical markers kits were used to detect SOD and MDA activity in the kidney tissue homogenates according to the manufacturer’s instructions. Two histograms show the different renal SOD and MDA levels in each group (D,E). Data are represented as the mean ± S.E.M. (n=6). Means with different superscript letters are significantly different from one another (P<0.05).
Uric acid injury causes oxidative stress [27,28], which functions as autophagy inducer [29,30]. SOD protects the cells from superoxide toxicity, while MDA indicates lipid peroxidation. Both of them are frequently used as biomarkers for oxidative stress [30]. To explore the mechanisms of 3-MA regulated oxidative stress, we examined SOD and MDA activity in the kidney tissue homogenates. As shown in Figure 5D,E, a high level of SOD was detected in the sham kidney with or without 3-MA treatment. Its level was decreased in the hyperuricemic kidney, but preserved after 3-MA administration (Figure 5D). While the level of MDA was up-regulated after hyperuricemic injury. 3-MA administration significantly reduced its levels (Figure 5E). Therefore, 3-MA treatment can effectively inhibit uric acid-elicited oxidative stress in rats with HN.
Autophagy inhibition abrogates the progression of renal fibrosis and reduces renal expression of collagen I and α-SMA in hyperuricemic rats
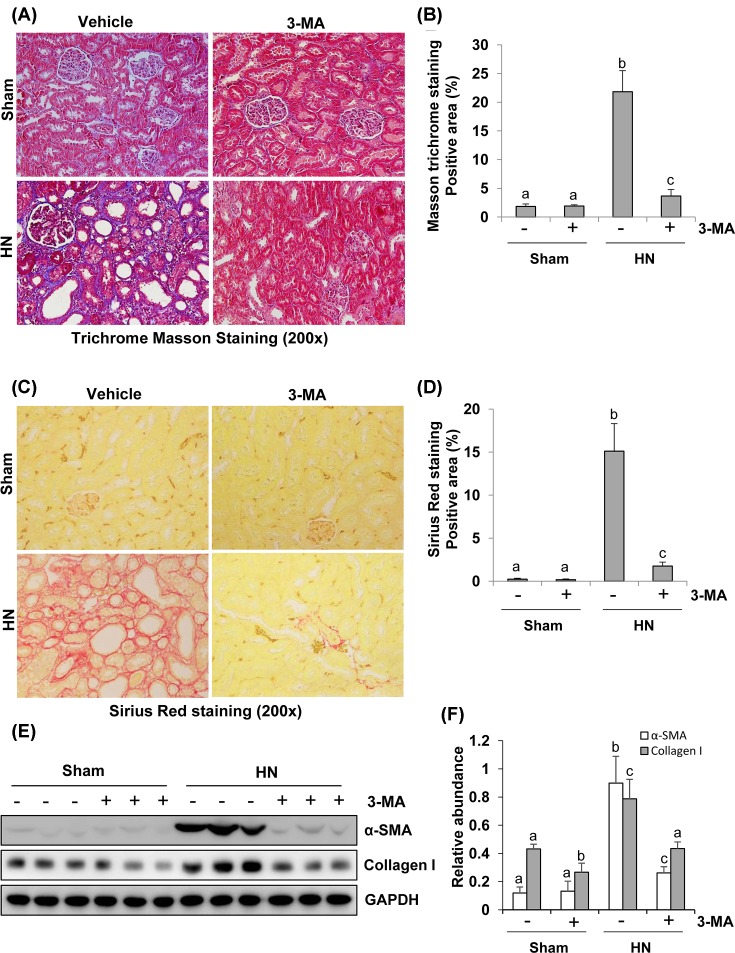
The major feature of renal fibrosis is characterized by overproduction and accumulation of extracellular matrix (ECM), which ultimately leads to fibrotic lesions and tissue scarring [31,32]. To assess the role of autophagy in renal fibrosis, we examined the effect of 3-MA on the expression of interstitial collagen fibrils. At day 21 following hyperuricemic damage with or without administration of 3-MA, kidneys were collected and then subjected to Masson’s trichrome staining and immunoblots to analyze expression of ECM proteins. As shown in Figure 6A, kidneys with HN displayed severe morphological lesions as evidenced by glomerulosclerosis, tubular dilation, epithelial atrophy, interstitial expansion, and collagen accumulation characterized by a remarkable enhancement of trichrome-positive areas in the tubulointerstitium after hyperuricemic injury. Semiquantitative analysis of Masson’s trichrome-positive areas revealed approximately a ten-fold increase in the deposition of ECM components in the hyperuricemic injured kidney compared with control kidneys while 3-MA treatment reduced ECM components deposition by 75% (Figure 6B). These results were also confirmed by Sirius Red staining (Figure 6C,D).
Figure 6. Administration of 3-MA attenuates development of renal fibrosis in hyperuricemic rats.
Photomicrographs (200×) illustrate Masson’s trichrome staining of kidney tissue collected after 3 weeks of daily feeding of the mixture of adenine and potassium oxonate with or without 3-MA administration (A). The Masson’s trichrome-positive tubulointerstitial areas (blue) relative to the whole area from ten random cortical fields were quantitatively measured by using ImagePro Plus software by drawing a line around the perimeter of positive staining area, and the average ratio to each microscopic field (200×) was calculated and graphed (B). Photomicrographs illustrate Sirius Red staining of kidney tissue (200×) (C). The Sirius Red-positive tubulointerstitial areas (red) relative to the whole area from ten random cortical fields were analyzed (D). The prepared tissue lysates from sham or hyperuricemic kidneys of rats treated with/without 3-MA were subjected to immunoblot analysis with antibodies against α-SMA, Collagen I, or GAPDH (E). Expression levels of α-SMA and collagen I were respectively quantitated by densitometry and normalized with GAPDH (F). Data are represented as the mean ± S.E.M. (n=6). Means with different superscript letters are significantly different from one another (P<0.05).
As collagen I is a major component of the interstitial matrix and myofibroblasts are principle cell types responsible for production of ECM proteins, we determined expression of collagen I and α-SMA, the hallmark of myofibroblasts [33] by immunoblot analysis. Both collagen I and α-SMA were up-regulated at day 21 following hyperuricemic injury, and administration of 3-MA significantly reduced their expression (Figure 6E,F). Densitometry analysis of immunoblots indicates a 62% reduction in α-SMA in HN rats treated with 3-MA compared with those without 3-MA treatment (Figure 6F). Immunostaining also indicated a remarkable increase in α-SMA-positive area in the kidney with HN and 3-MA treatment reduced this α-SMA-labeled area (Supplementary Figure S1C,D). These data demonstrate that autophagy blockade can inhibit renal accumulation of ECM proteins and fibroblasts activation following hyperuricemia-elicited kidney injury.
Autophagy inhibition rescues the G2/M arrest in renal epithelial cells after hyperuricemic injury
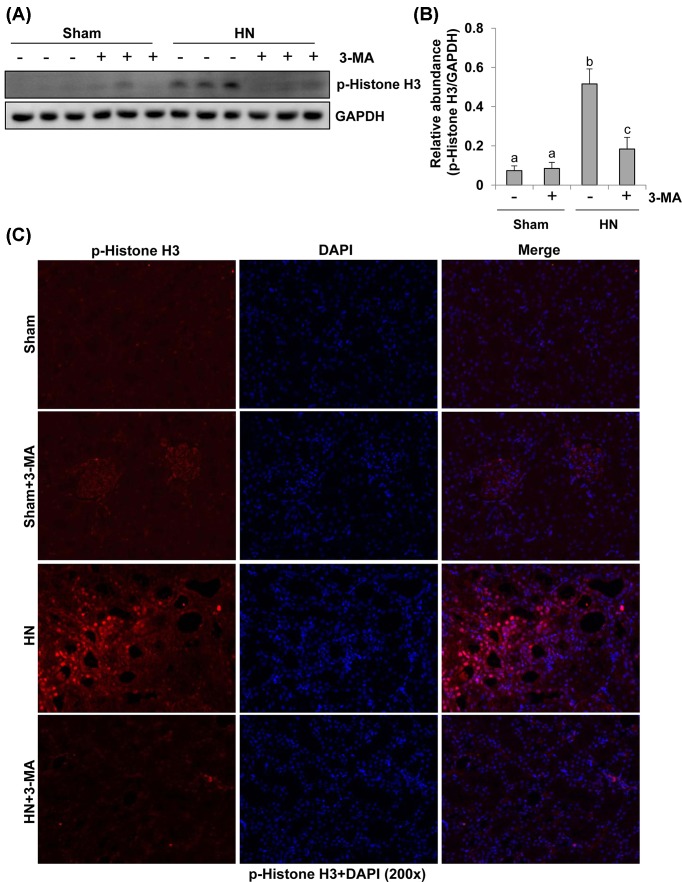
It has been documented that proximal tubular cells arrested in the G2/M phase after severe kidney injury induced up-regulation of profibrotic cytokine production [14]. Phosphorylation at serine residue (Ser10) in the histone H3 tail (p-Histone H3) is considered as a hallmark of cells in G2/M phase of cell cycle [34]. To elucidate the role of autophagy in this process, we examined the expression of p-Histone H3 by immunoblot analysis and immunoflurescence staining. As shown in Figure 7A,B, immunoblot analysis of whole kidney lysates showed that expression of p-Histone H3 was increased in the kidney of rats after hyperuricemic injury and inhibition of autophagy by 3-MA significantly decreased its expression. Consistent with this observation, immunostaining analysis showed that the number of p-Histone H3 positive renal tubular cells was remarkably increased in HN rats compared with sham rats, and administration of 3-MA significantly reduced the number of p-Histone H3 labeled tubular cells (Figure 7C). Taken together, activation of autophagy is essential for driving renal epithelial cell cycle to arrest at G2/M phase after hyperuricemic injury, and 3-MA treatment can block this response.
Figure 7. Administration of 3-MA reduces expression of p-histone H3 in hyperuricemic rats.
The prepared tissue lysates from sham or hyperuricemic kidneys of rats treated with/without 3-MA were subjected to immunoblot analysis with specific antibodies against p-histone H3 and GAPDH (A). The expression levels of p-histone H3 were quantitated by densitometry and normalized with GADPH (B). Photomicrographs (200×) illustrate p-histone H3 (Ser10) with immunofluorescent staining of the kidney tissues from sham or hyperuricemic kidneys of rats treated with/without 3-MA (C). Data are represented as the mean ± S.E.M. (n=6). Means with different superscript letters are significantly different from one another (P<0.05).
Administration of 3-MA inhibits activation of Smad3 and TAK1 signaling pathways in a rat model of HN
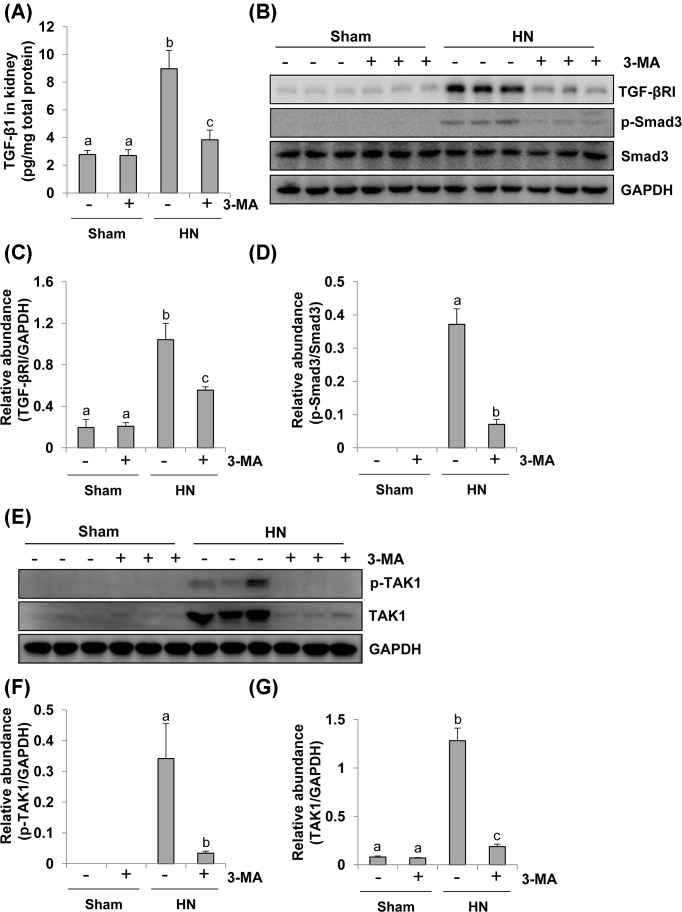
TGF-β signaling contributes to renal fibrosis, and TGFβ1-induced activation of Smad-dependent and -independent TAK1 signaling pathways results in the accumulation of ECM proteins and progression of renal fibrosis in animal models and CKD patients [35,36]. To explore whether these two signaling pathways are involved in the autophagy-mediated development of renal fibrosis, we examined the effect of 3-MA on the activation of these signaling pathways in rats with HN. Hyperuricemic injury enhanced the expression level of TGF-β1, which was suppressed by administration of 3-MA (Figure 8A). Hyperuricemic damage also increased the expression and/or phosphorylation of TGFβ-RI, Smad3, TAK1, and total TAK1 in the kidney (Figure 8B–G). 3-MA administration significantly inhibited all these responses (Figure 8A–G). Therefore, it appears that autophagy mediates activation of TGFβ1-induced Smad3 and TAK1 signaling pathways in hyperuricemia-associated kidney diseases, and inhibition of autophagy by 3-MA can abrogate transduction and activation of these pivotal pathways.
Figure 8. 3-MA treatment suppresses activation of the TGF-β induced Smad and TAK signaling pathway in hyperuricemic rats.
Expression levels of TGF-β1 were determined by ELISA (A). Kidney tissue lysates collected after 3 weeks of daily feeding of the mixture of adenine and potassium oxonate with or without 3-MA administration were prepared and subjected to immunoblot analysis with antibodies to TGF-βRІ, p-Smad3, Smad3, and GAPDH (B). Expression levels of TGF-βRІ were quantitated by densitometry and normalized with GAPDH (C). Expression levels of p-Smad3 and Smad3 were calculated by densitometry and the ratio between p-Smad3 and Smad3 was determined (D). Kidney tissue lysates were prepared and subjected to immunoblot analysis with antibodies to p-TAK1, TAK1, and GAPDH (E). Expression levels of p-TAK1 (F) and TAK1 (G) were quantitated by densitometry and normalized with GAPDH. Data are represented as the mean ± S.E.M. Means with different superscript letters are significantly different from one another (P<0.05).
Administration of 3-MA inhibits Wnt/β-catenin and Notch/Jagged-1 signaling pathways in a rat model of HN
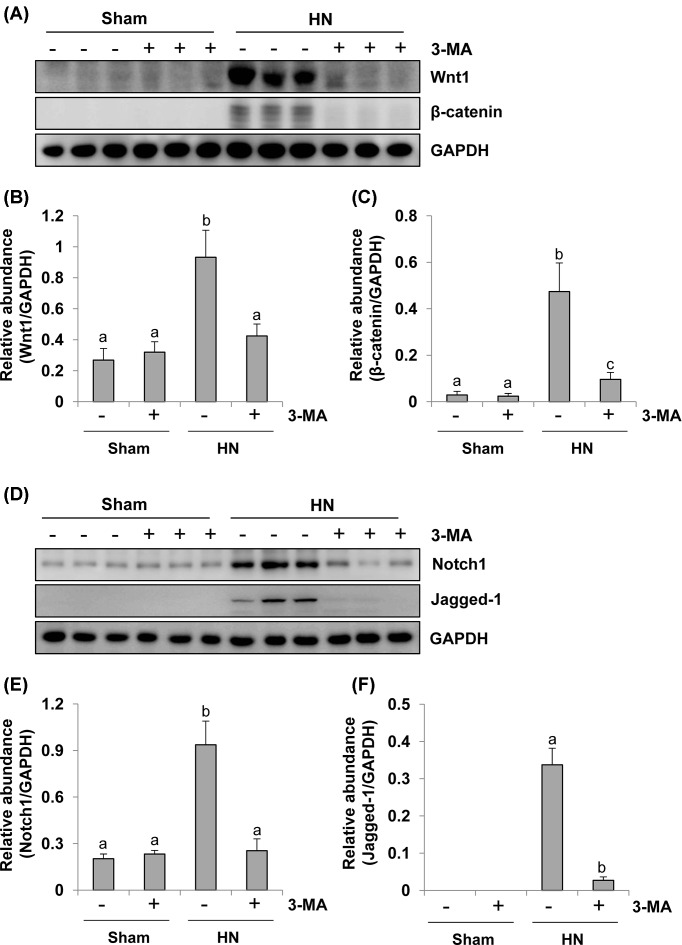
Aberrant activation of the Wnt/β-catenin pathway has been reported to be associated with renal disorders but the underlying mechanism is not clear [37]. Here, we tested the hypothesis that autophagy contributes to activation of the Wnt/β-catenin pathway. Densitometry analysis demonstrated an increase in the expression level of both Wnt1 and β-catenin proteins in the kidney of HN rats, 3-MA treatment inhibited renal Wnt1 expression to the basal level and also largely suppressed hyperuricemia-induced expression of β-catenin in HN rats (Figure 9A–C). Collectively, these data suggest that hyperuricemia associated kidney damage is accompanied by activation of the Wnt/β-catenin signaling pathway and that autophagy is involved in the activation of this signaling pathway.
Figure 9. 3-MA treatment inhibits activation of Wnt-1 and Notch pathway in hyperuricemic rats.
Kidney tissue lysates collected after 3 weeks of daily feeding of the mixture of adenine and potassium oxonate with or without 3-MA administration were prepared and subjected to immunoblot analysis with antibodies to Wnt1, β-catenin, and GAPDH (A). Expression levels of Wnt1 was quantitated by densitometry and normalized with GAPDH (B). Expression levels of β-catenin were quantitated by densitometry and normalized with GAPDH (C). Kidney tissue lysates were prepared and subjected to immunoblot analysis with antibodies to Notch1, Jagged-1, and GAPDH (D). Expression levels of Notch1 was quantitated by densitometry and normalized with GAPDH (E). Expression levels of Jagged-1 were quantitated by densitometry and normalized with GAPDH (F). Data are represented as the mean ± S.E.M. Means with different superscript letters are significantly different from one another (P<0.05).
Activation of Notch signaling pathway has been reported to promote the progression of renal fibrosis in various renal disorders in humans or in animal models [11]. To find out how Notch pathway functions during the autophagy induced by hyperuricemic injury in the kidney, we examined the expression of Notch before and after autophagy blockage. As shown in Figure 9D–F, a low level of Notch1 protein was seen whereas expression of Jagged-1, a classical ligand of Notch pathway, was not detectable in sham kidneys. However, expression levels of both of them were increased significantly in rat kidney after hyperuricemic injury. Treatment with 3-MA suppressed uric acid-induced expression of Jagged-1, Notch1. Therefore, hyperuricemia-associated kidney damage is accompanied by activation of the Notch signaling pathway and autophagy may contribute to aggravating renal fibrosis through activation of the Notch signaling pathway.
Administration of 3-MA suppresses EGFR/ERK1/2 signaling pathway in a rat model of HN
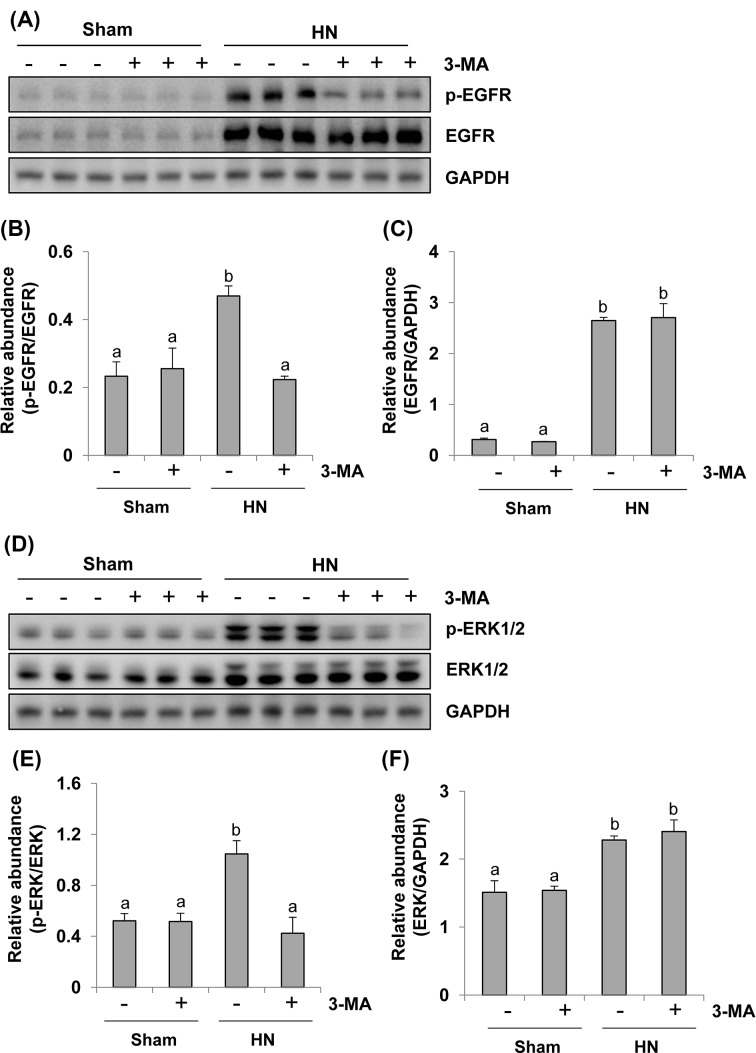
Our recent studies have shown that activation of EGFR/ERK1/2 signaling pathway is implicated in the development and progression of HN in rats [7,15]. EGFR belongs to tyrosine kinase receptor involved in renal fibroblast activation and proliferation [31,33]. To examine the role of autophagy in EGFR and ERK1/2 activation in the kidney, we investigated the effect of 3-MA on the phosphorylation/expression of EGFR and ERK1/2 by immunoblot analysis. The phosphorylated EGFR and ERK1/2 were slightly detectable in the sham kidneys and dramatically increased in the kidneys with HN. 3-MA treatment abolished these responses (Figure 10A,B,D,E). Hyperuricemia induced kidney injury was also accompanied by increased expression levels of total EGFR and ERK1/2, however, inhibition of autophagy with 3-MA did not affect their expression (Figure 10A,C,D,F). Therefore, 3-MA is effective in blocking activation of EGFR/ERK1/2 signaling pathway in a rat model of HN.
Figure 10. Inhibition of autophagy blocks activation of the EGFR/ERK1/2 signaling pathway in hyperuricemic rats.
Kidney tissue lysates collected after 3 weeks of daily feeding of the mixture of adenine and potassium oxonate with or without 3-MA administration were prepared and subjected to immunoblot analysis with antibodies to p-EGFR, EGFR, and GAPDH (A). Expression levels of p-EGFR and EGFR were calculated by densitometry and the ratio between p-EGFR and EGFR was determined (B). Expression levels of EGFR was quantitated by densitometry and normalized with GAPDH (C). Kidney tissue lysates were prepared and subjected to immunoblot analysis with antibodies to p-ERK1/2, ERK1/2, and GAPDH (D). Expression levels of p-ERK1/2 and ERK1/2 were calculated by densitometry and the ratio between p-ERK1/2 and ERK1/2 was determined (E). Expression levels of ERK1/2 were quantitated by densitometry and normalized with GAPDH (F). Data are represented as the mean ± S.E.M. Means with different superscript letters are significantly different from one another (P<0.05).
Autophagy is required for the activation of NF-κB signaling pathway and production of numerous proinflammatory and profibrotic cytokines in a rat model of HN
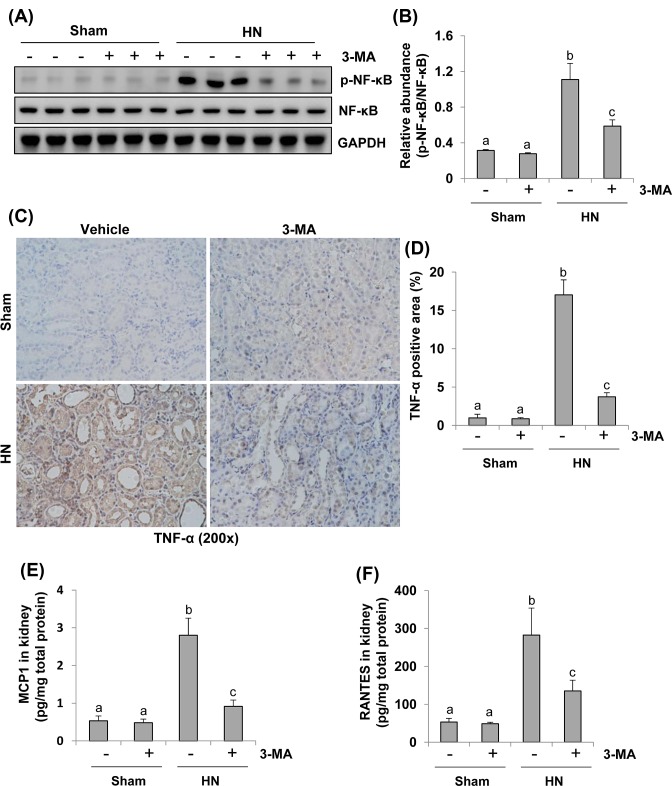
Given that uric acid can trigger inflammatory responses by activating transcription factor, such as NF-κB and inducing production and release of cytokines like TNF-α, MCP-1, and RANTES [38–40]; we further examined the effect of autophagy inhibition on the activation of NF-κB signaling pathway and the expression of these three proinflammatory cytokines in this model. As indicated in Figure 11A,B, phosphorylation level of NF-κB was up-regulated in the kidneys with HN and significantly inhibited upon administration of 3-MA. Expression of total NF-κB was not affected by hyperuricemia elicited injury and 3-MA. Only a small amount of p-NF-κB was detected in the sham kidneys treated with or without 3-MA. To understand the effect of 3-MA on the expression of TNF-α, MCP-1, and RANTES, we examined their expression by either immunohistrochemistry or ELISA. As shown in Figure 11C–F, an increase in these cytokines was observed in the kidneys of hyperuricemic rats. Administration with 3-MA significantly reduced these responses. These data suggest that autophagy promotes NF-κB pathway activation and production of multiple cytokines in the kidney with HN.
Figure 11. Inhibition of autophagy suppresses activation of NF-κB pathway and production of inflammatory cytokines in the kidney of hyperuricemic rats.
The kidney tissue lysates collected after 3 weeks of daily feeding of the mixture of adenine and potassium oxonate with or without 3-MA administration were subjected to immunoblot analysis with specific antibodies against p-NF-κB, NF-κB, and GAPDH (A). Expression levels of p-NF-κB were quantitated by densitometry and normalized with NF-κB (B). Photomicrographs (200×) illustrate TNF-α with immunohistochemical staining of the kidney tissues from sham or hyperuricemic rats treated/untreated with 3-MA (C). TNF-α positive area was counted in ten high-power fields and expressed as mean ± S.E.M. (D). Expression levels of MCP-1 determined by ELISA (E). Expression levels of RANTES determined by ELISA (F). Data are represented as the mean ± S.E.M. Means with different superscript letters are significantly different from one another (P<0.05).
Autophagy is required for macrophage and lymphocyte infiltration in a rat model of HN
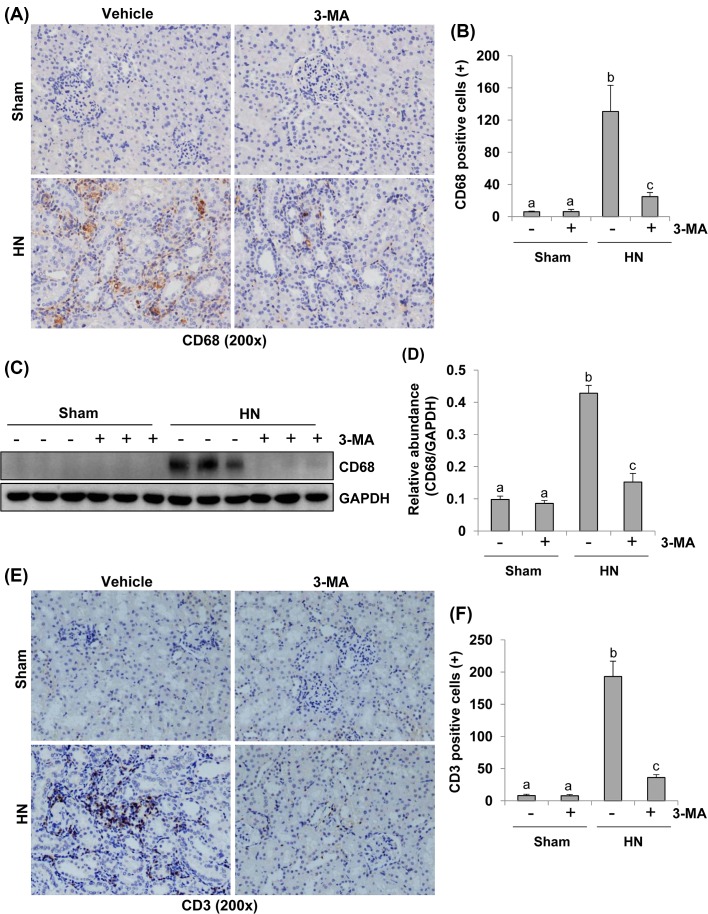
Kidney fibrosis is aggravated by chronic inflammation, which is characterized by macrophage and lymphocyte infiltration [41,42]. CD68 and CD3 are well-known biomarkers of macrophage and lymphocyte, respectively [41,42]. To elucidate the effect of autophagy on the regulation of macrophages and lymphocytes infiltration in hyperuricemia-induced kidney injury, we conducted immunochemistry analysis using specific antibodies against CD68 or CD3. As shown in Figure 12A,B, the number of CD68-postive macrophages in the injured kidney was increased in HN rats compared with sham animals, and 3-MA treatment remarkably inhibited their infiltration. Similar results were obtained when kidney tissue was analyzed with Western blotting (Figure 12C,D). Similarly, the number of CD3-postive lymphocytes was also significantly increased in the kidney of HN rats compared with sham-operated rats, and 3-MA treatment prevented their infiltration (Figure 12E,F). As such, these data reveal that blockade of autophagy suppresses macrophage and lymphocyte infiltration.
Figure 12. Administration of 3-MA inhibits infiltration of macrophage and lymphocyte in the kidney of hyperuricemic rats.
Photomicrographs (200×) illustrate CD68 with immunohistochemical staining of the kidney tissues collected after 3 weeks of daily feeding of the mixture of adenine and potassium oxonate with or without 3-MA administration (A). CD68 positive cells were counted in ten high-power fields and expressed as mean ± S.E.M. (B). The kidney tissue lysates were subjected to immunoblot analysis with specific antibodies against CD68 and GAPDH (C). Expression levels of CD68 were quantitated by densitometry and normalized with GAPDH and expressed as mean ± S.E.M. (D). Photomicrographs (200×) illustrate CD3 with immunohistochemical staining of the kidney tissues (E). CD3 positive cells were counted in ten high-power fields and expressed as mean ± S.E.M. (F). Means with different superscript letters are significantly different from one another (P<0.05).
Discussion
Hyperuricemia is critically associated with chronic kidney injury [7,15] and the prevalence of HN has increased worldwide [43]. However, the mechanisms involved in HN remain unclear and require further investigations. By using autophagy inhibitor 3-MA, we demonstrated that autophagy inhibition suppresses activation of renal interstitial fibroblasts and production of ECM components in vitro and in a murine model of HN induced by feeding a mixture of adenine and potassium oxonate. Moreover, we found that autophagy is required for renal tubular injury and activation of multiple signaling pathways associated with renal fibrogenesis and inflammation. Collectively, these data suggest that autophagy contributes to the development of HN by inducing renal tubular cell damage and triggering various fibrogenic and inflammatory responses.
Autophagy has been defined as a highly conserved catabolic process, which involves the bulk lysosomal degradation of cytosolic components and cytosolic organelles [22]. It is acknowledged that the response of autophagy to kidney damage can be beneficial or harmful, depending on different pathological settings. In nephrotoxic models of acute kidney injury, Periyasamy-Thandavan et al. [44] have demonstrated a renoprotective role of autophagy during cisplatin injury of renal proximal tubular cells. A prosurvival effect of autophagy was also observed in tubular cells during cyclosporine A nephrotoxicity [45]. In the models of renal ischemia–reperfusion injury, early autophagic responses during hypoxia also played a protective role in cell survival by promoting generation of intercellular nutrients and energy and clearance of misfolded protein and damaged organelles to keep cellular homeostasis [46,47]. However, persistent autophagy during the recovery phase was detrimental to the kidney due to suppressing tubular proliferation and regeneration, accompanying with irreversible collapse of cytoplasm or organelles [48]. As for obstructed kidneys, Livingston et al. [49] showed that persistent activation of autophagy in kidney proximal tubules potentiates renal interstitial fibrosis via promoting overexpression of TGF-β, tubular cell death, and interstitial inflammation in the mouse model. However, in the rat model of unilateral ureteral obstruction (UUO), Kim et al. [50] noted that autophagy may limit fibrosis by abolishing apoptosis. In this report, autophagy was blocked with 30 mg/kg 3-MA daily, which was twice as much as the dosage used in mouse model, leading to tubular cell apoptosis and interstitial fibrosis. Since the high concentration of 3-MA not only inhibits class I phosphoinositide 3-kinase, but also blocks class III phosphatidylinositol 3-kinase, the survival signaling pathways [51], it is likely that higher dosage of 3-MA may produce autophagy-independent adverse effects on the physiology of tubular cells such as glycogen metabolism, lysosomal acidification, endocytosis, and the mitochondrial permeability transition, eventually leading to tubular cell apoptosis and interstitial fibrosis. As such, we employed 15 mg/kg 3-MA daily to investigate the role of autophagy in vivo model of HN and 1, 5, 10 μmol/l 3-MA in vitro model of renal fibroblast activation. Consistent with Livingston et al. [49] results, we found that autophagy plays a role in promoting renal fibrosis induced by hyperuricemia.
We demonstrated that chronic uric acid stimulus is a causative factor for CKD in a rat model of HN. This was supported by our previous observations that elevated serum uric acid level was accompanied by increased level of serum creatinine, BUN, and urine microalbumin with the weekly data [7]. Several epidemiologic studies have also reported that serum uric acid concentration independently predicts the development of CKD [52–54]. However, serum urate concentration was not consistently related with the progression of CKD in patients with pre-existing CKD [3]. Notably, some factors in the epidemiologic studies, such as disparate covariate adjustment strategies, exposure and outcome definitions and follow-up time, may make the evidence uncertainty. But if there is still residual confounding after multivariable adjustment and other strategies, the association between serum uric acid and CKD may be significant even in the absence of causality [55]. Moreover, the inability to show the causal role of urate does not mean that lowing serum uric acid concentrations may not have beneficial effects on CKD. [56–58]. In this regard, our study showed that inhibition of autophagy by 3-MA effectively lowers serum uric acid concentrations and suppresses the uric acid-induced kidney damage in hyperuricemic rats, suggesting that targetted inhibition of autophagy may represent a potential therapeutic treatment for HN.
Our study also demonstrated that chronic uric acid insult leads to increased autophagy. The upstream signaling leading to autophagy activation includes transforming growth factor-β (TGF-β) signaling, a major positive regulator of autophagy [59,60], and mammalian target of rapamycin (mTOR) signaling, a key negative regulator of autophagy [17,61]. Oxidative stress is also common autophagy inducer in cell stress [29,30]. We and others confirmed that uric acid stimulus resulted in activation of TGF-β signaling [7], down-regulation of mTOR signaling [62], and increased oxidative stress [27,28]. Thus, uric acid-induced activation of TGF-β signaling, inactivation of mTOR signaling, and increase in oxidative stress may lead to autophagy of tubular epithelial cells.
Hyperuricemia-induced autophagy may also relate to other mechanisms. Previously, we have demonstrated that EGFR signaling pathway is critically involved in renal fibrosis elicited by hyperuricemia, UUO, and ischemia–reperfusion [7,31,63]. Activated EGFR and its major downstream signaling ERK1/2, can aggravate the development of HN by activating TGF-β signaling and increasing inflammation responses [15]. Here, our data showed that pharmacological inhibition of autophagy blocked phosphorylation of EGFR and ERK1/2, suggesting that autophagy is coupled to the machinery leading to EGFR/ERK1/2 pathway activation. Furthermore, tubule-derived Wnts also play a role in renal fibroblast activation and fibrogenesis [37]. Our study demonstrated that blockade of autophagy suppressed Wnt-1 and β-catenin expression in hyperuricemia-related nephropathy. However, it remains unclear about how autophagy contributes to activation of β-catenin. It has been reported that tumor suppressor candidate 3 (TUSC3) can up-regulate autophagy-related proteins and promote nuclear translocation and activation of β-catenin in human NSCLC cells. Thus, it is possible that uric acid may induce autophagy and activation of the Wnt/β-catenin signaling pathway through regulation of TUSC3 expression [64]. Further studies are required to address this hypothesis. In addition, sustained Notch expression aggravates the tubulointerstitial fibrosis by promoting dedifferentiation, epithelial-to-mesenchymal transition (EMT) [65]. Notably, autophagy can regulate Notch degradation, and blocking Notch signal pathway can also influence the level of autophagy [66,67]. In this study, we found that inhibiting autophagy with 3-MA reduced the number of autophagic vacuoles, coincident with decreased expression of Notch1 and Jagged-1. This suggests a regulatory role of autophagy in the activation of Notch signaling pathway.
Inflammation and autophagy are intertwined processes during physiological and pathological conditions, and aberrant cross-talk between these two processes have important impacts for the pathogenesis and treatment of several diseases [68]. In this study, we found that inhibiting autophagy blocked activation of NF-κB pathway, increased macrophage and lymphocytes infiltration and production of inflammatory cytokines, suggesting the importance of autophagy in regulating inflammatory responses during HN. In line with our observations, a study in humans also demonstrated that autophagy inhibition decreased production of TNF-α, suggesting a regulatory role of autophagy in the production of inflammatory cytokines [69]. Mechanistic studies revealed that autophagy can dampen proinflammatory responses through removing aggregated inflammasome structures [70]. Future studies are needed to elucidate whether this is also the case in the inflammation triggered during HN.
In addition, it has been reported that proximal tubular cells arrested in the G2/M stage of the cell cycle after kidney injury resulted in abnormal amplification of profibrogenic cytokines such as TGF-β1 [14]. This suggests that reversal of epithelial cells arrested at G2/M phase may help maintain the proper progress of tubular epithelial cells through the cell cycle and suppress the development of fibrosis during the injury phase. In the present study, we found that p-Histone-H3, a hallmark of cells arrested in G2/M, was highly expressed in the kidney of HN compared with sham animals and administration of 3-MA reduced the protein level of p-Histone H3 and the number of p-Histone H3 labeled tubular cells in HN kidney, suggesting that activation of autophagy is capable of facilitating renal fibrogenesis through conversion of renal epithelial cells into a profibrotic phenotype.
In summary, we demonstrated for the first time that blockage of autophagy inhibits activation of uric acid-induced renal fibroblasts activation and prevents development of hyperuricemia nephropathy in a rat model. The renoprotective effects of autophagy abrogation are associated with inactivation of multiple cytokine/growth factor receptors signaling pathways involved in fibrogenesis, suppression of inflammatory responses as well as rescue of G2/M arrest. Thus, targetted inhibition of autophagy could represent a novel and effective therapeutic strategy in treating HN.
Clinical perspectives
Emerging data demonstrate that uric acid is tightly linked to cardiovascular disease, diabetes, and high mortality in patients with CKDs.
We demonstrate for the first time that blockage of autophagy inhibits activation of uric acid-induced renal fibroblasts activation and prevents development and progression of HN in a rat model.
Autophagy may be a promising target for the treatment of HN.
Supporting information
Supplementary Figure 1.
Abbreviations
- 3-MA
3-methyladenine
- α-SMA
α-smooth muscle actin
- Atg
autophagy-related gene
- BUN
blood urea nitrogen
- CKD
chronic kidney disease
- DMEM
Dulbecco’s modified Eagle’s medium
- ECM
extracellular matrix
- EGFR
epidermal growth factor receptor
- ERK1/2
extracellular signal–regulated kinase 1/2
- GAPDH
glyceraldehyde 3-phosphate dehydrogenase
- HN
hyperuricemic nephropathy
- JNK
c-Jun N-terminal kinase
- LC3
light chain 3
- Lcn2
lipocalin-2
- MAPK
mitogen-activated protein kinase
- MCP-1
monocyte chemoattractant protein-1
- MDA
malondialdehyde
- MKK4
mitogen-activated protein kinase kinase 4
- mTOR
mammalian target of rapamycin
- NF-κB
nuclear factor-κB
- NRK-49F
rat renal interstitial fibroblast
- NSCLC
non-small cell lung cancer
- PAS
Periodic acid–Schiff
- RANTES
regulated upon activation normal T-cell expressed and secreted
- SD
Sprague–Dawley
- SOD
superoxide dismutase
- TAK1
TGF-β-activated kinase 1
- TGF-β1
transforming growth factor-β1
- TNF-α
tumor necrosis factor-α
- TUSC3
tumor suppressor candidate 3
- UUO
unilateral ureteral obstruction
Funding
This work was supported by the National Nature Science Foundation of China [grant numbers 81670658 (to W.Y.), 81170672 (to W.Y.), 81670690 (to N.L.), 81470991 (to N.L.), 81200492 (to N.L.); 81670623 (to S.Z.), 81470920 (to S.Z.)]; the Key Discipline Construction Project of Pudong Health Bureau of Shanghai [grant number PWZxk2017-05 (to N.L.)]; and the U.S. National Institutes of Health [grant number 2R01DK08506505A1 (to S.Z.)].
Author contribution
W.Y., N.L., and S.Z. participated in research design. J.B., Y.S., and M.T. conducted experiments. J.B., N.L., and W.Y. contributed new reagents or analytic tools. N.L., J.B., and Y.S. performed data analysis. J.B., Y.S., M.T., N.L., S.Z., and W.Y. wrote or contributed to the writing of the manuscript.
Competing interests
The authors declare that there are no competing interests associated with the manuscript.
References
- 1.Pontremoli R. (2017) The role of urate-lowering treatment on cardiovascular and renal disease: evidence from CARES, FAST, ALL-HEART, and FEATHER studies. Curr. Med. Res. Opin. 33, 27–32 10.1080/03007995.2017.1378523 [DOI] [PubMed] [Google Scholar]
- 2.Mortada I. (2017) Hyperuricemia, type 2 diabetes mellitus, and hypertension: an emerging association. Curr. Hypertens. Rep. 19, 69 10.1007/s11906-017-0770-x [DOI] [PubMed] [Google Scholar]
- 3.Jalal D.I., Chonchol M., Chen W. and Targher G. (2013) Uric acid as a target of therapy in CKD. Am. J. Kidney Dis. 61, 134–146 10.1053/j.ajkd.2012.07.021 [DOI] [PMC free article] [PubMed] [Google Scholar]
- 4.Qureshi S., Lorch R. and Navaneethan S.D. (2017) Blood pressure parameters and their associations with death in patients with chronic kidney disease. Curr. Hypertens. Rep. 19, 92 10.1007/s11906-017-0790-6 [DOI] [PubMed] [Google Scholar]
- 5.Yakush Williams J.K. (2017) Management strategies for patients with diabetic kidney disease and chronic kidney disease in diabetes. Nurs. Clin. North Am. 52, 575–587 10.1016/j.cnur.2017.07.007 [DOI] [PubMed] [Google Scholar]
- 6.Rincon-Choles H., Jolly S.E., Arrigain S., Konig V., Schold J.D., Nakhoul G.. et al. (2017) Impact of uric acid levels on kidney disease progression. Am. J. Nephrol. 46, 315–322 10.1159/000481460 [DOI] [PubMed] [Google Scholar]
- 7.Liu N., Wang L., Yang T., Xiong C., Xu L., Shi Y.. et al. (2015) EGF receptor inhibition alleviates hyperuricemic nephropathy. J. Am. Soc. Nephrol. 26, 2716–2729 10.1681/ASN.2014080793 [DOI] [PMC free article] [PubMed] [Google Scholar]
- 8.Eddy A.A. (2000) Molecular basis of renal fibrosis. Pediatr. Nephrol. 15, 290–301 10.1007/s004670000461 [DOI] [PubMed] [Google Scholar]
- 9.Kim S.I., Kwak J.H., Zachariah M., He Y., Wang L. and Choi M.E. (2007) TGF-beta-activated kinase 1 and TAK1-binding protein 1 cooperate to mediate TGF-beta1-induced MKK3-p38 MAPK activation and stimulation of type I collagen. Am. J. Physiol. Renal Physiol. 292, F1471–F1478 10.1152/ajprenal.00485.2006 [DOI] [PubMed] [Google Scholar]
- 10.Hocevar B.A., Prunier C. and Howe P.H. (2005) Disabled-2 (Dab2) mediates transforming growth factor beta (TGFbeta)-stimulated fibronectin synthesis through TGFbeta-activated kinase 1 and activation of the JNK pathway. J. Biol. Chem. 280, 25920–25927 10.1074/jbc.M501150200 [DOI] [PubMed] [Google Scholar]
- 11.Murea M., Park J.K., Sharma S., Kato H., Gruenwald A., Niranjan T.. et al. (2010) Expression of Notch pathway proteins correlates with albuminuria, glomerulosclerosis, and renal function. Kidney Int. 78, 514–522 10.1038/ki.2010.172 [DOI] [PMC free article] [PubMed] [Google Scholar]
- 12.Niranjan T., Bielesz B., Gruenwald A., Ponda M.P., Kopp J.B., Thomas D.B.. et al. (2008) The Notch pathway in podocytes plays a role in the development of glomerular disease. Nat. Med. 14, 290–298 10.1038/nm1731 [DOI] [PubMed] [Google Scholar]
- 13.Tan R.J., Zhou D., Zhou L. and Liu Y. (2014) Wnt/beta-catenin signaling and kidney fibrosis. Kidney Int. 4, 84–90 10.1038/kisup.2014.16 [DOI] [PMC free article] [PubMed] [Google Scholar]
- 14.Yang L., Besschetnova T.Y., Brooks C.R., Shah J.V. and Bonventre J.V. (2010) Epithelial cell cycle arrest in G2/M mediates kidney fibrosis after injury. Nat. Med. 16, 535–543, 10.1038/nm.2144 [DOI] [PMC free article] [PubMed] [Google Scholar]
- 15.Liu N., Xu L., Shi Y., Fang L., Gu H., Wang H.. et al. (2017) Pharmacologic targeting ERK1/2 attenuates the development and progression of hyperuricemic nephropathy in rats. Oncotarget 8, 33807–33826 [DOI] [PMC free article] [PubMed] [Google Scholar]
- 16.Zhen H. and Gui F. (2017) The role of hyperuricemia on vascular endothelium dysfunction. Biomed. Rep. 7, 325–330 10.3892/br.2017.966 [DOI] [PMC free article] [PubMed] [Google Scholar]
- 17.Liu N., Shi Y. and Zhuang S. (2016) Autophagy in chronic kidney diseases. Kidney Dis. (Basel) 2, 37–45 10.1159/000444841 [DOI] [PMC free article] [PubMed] [Google Scholar]
- 18.Peeters J.G.C., de Graeff N., Lotz M., Albani S., de Roock S. and van Loosdregt J. (2017) Increased autophagy contributes to the inflammatory phenotype of juvenile idiopathic arthritis synovial fluid T cells. Rheumatology (Oxford) 56, 1694–1699 10.1093/rheumatology/kex227 [DOI] [PMC free article] [PubMed] [Google Scholar]
- 19.Xue Y., Han H., Wu L., Pan B., Dong B., Yin C.C.. et al. (2017) iASPP facilitates tumor growth by promoting mTOR-dependent autophagy in human non-small-cell lung cancer. Cell Death Dis. 8, e3150 10.1038/cddis.2017.515 [DOI] [PMC free article] [PubMed] [Google Scholar]
- 20.Liu H., Dai C., Fan Y., Guo B., Ren K., Sun T.. et al. (2017) From autophagy to mitophagy: the roles of P62 in neurodegenerative diseases. J. Bioenerg. Biomembr. 49, 413–422 10.1007/s10863-017-9727-7 [DOI] [PubMed] [Google Scholar]
- 21.Xu C.Y., Kang W.Y., Chen Y.M., Jiang T.F., Zhang J., Zhang L.N.. et al. (2017) DJ-1 inhibits alpha-synuclein aggregation by regulating chaperone-mediated autophagy. Front. Aging Neurosci. 9, 308 10.3389/fnagi.2017.00308 [DOI] [PMC free article] [PubMed] [Google Scholar]
- 22.Havasi A. and Dong Z. (2016) Autophagy and tubular cell death in the kidney. Semin. Nephrol. 36, 174–188 10.1016/j.semnephrol.2016.03.005 [DOI] [PMC free article] [PubMed] [Google Scholar]
- 23.Liu X., Lu L., Tao B.B., Zhou A.L. and Zhu Y.C. (2011) Amelioration of glomerulosclerosis with all-trans retinoic acid is linked to decreased plasminogen activator inhibitor-1 and alpha-smooth muscle actin. Acta Pharmacol. Sin. 32, 70–78 10.1038/aps.2010.200 [DOI] [PMC free article] [PubMed] [Google Scholar]
- 24.Romi M.M., Arfian N., Tranggono U., Setyaningsih W.A.W. and Sari D.C.R. (2017) Uric acid causes kidney injury through inducing fibroblast expansion, endothelin-1 expression, and inflammation. BMC Nephrol. 18, 326 10.1186/s12882-017-0736-x [DOI] [PMC free article] [PubMed] [Google Scholar]
- 25.Viau A., El Karoui K., Laouari D., Burtin M., Nguyen C. and Mori K (2010) Lipocalin 2 is essential for chronic kidney disease progression in mice and humans. J. Clin. Invest. 120, 4065–4076 10.1172/JCI42004 [DOI] [PMC free article] [PubMed] [Google Scholar]
- 26.Yang H.T., Yim H., Cho Y.S., Kym D., Hur J., Kim J.H.. et al. (2014) Assessment of biochemical markers in the early post-burn period for predicting acute kidney injury and mortality in patients with major burn injury: comparison of serum creatinine, serum cystatin-C, plasma and urine neutrophil gelatinase-associated lipocalin. Crit. Care 18, R151 10.1186/cc13989 [DOI] [PMC free article] [PubMed] [Google Scholar]
- 27.Zhang J.X., Zhang Y.P., Wu Q.N. and Chen B. (2015) Uric acid induces oxidative stress via an activation of the renin-angiotensin system in 3T3-L1 adipocytes. Endocrine 48, 135–142 10.1007/s12020-014-0239-5 [DOI] [PubMed] [Google Scholar]
- 28.Wang Y. and Bao X. (2013) Effects of uric acid on endothelial dysfunction in early chronic kidney disease and its mechanisms. Eur. J. Med. Res. 18, 26 10.1186/2047-783X-18-26 [DOI] [PMC free article] [PubMed] [Google Scholar] [Retracted]
- 29.Scherz-Shouval R. and Elazar Z. (2007) ROS, mitochondria and the regulation of autophagy. Trends Cell Biol. 17, 422–427 10.1016/j.tcb.2007.07.009 [DOI] [PubMed] [Google Scholar]
- 30.Sureshbabu A., Ryter S.W. and Choi M.E. (2015) Oxidative stress and autophagy: crucial modulators of kidney injury. Redox Biol. 4, 208–214 10.1016/j.redox.2015.01.001 [DOI] [PMC free article] [PubMed] [Google Scholar]
- 31.Liu N., Guo J.K., Pang M., Tolbert E., Ponnusamy M., Gong R.. et al. (2012) Genetic or pharmacologic blockade of EGFR inhibits renal fibrosis. J. Am. Soc. Nephrol. 23, 854–867 10.1681/ASN.2011050493 [DOI] [PMC free article] [PubMed] [Google Scholar]
- 32.Liu N., Tolbert E., Pang M., Ponnusamy M., Yan H. and Zhuang S. (2011) Suramin inhibits renal fibrosis in chronic kidney disease. J. Am. Soc. Nephrol. 22, 1064–1075 10.1681/ASN.2010090956 [DOI] [PMC free article] [PubMed] [Google Scholar]
- 33.Liu N., He S., Ma L., Ponnusamy M., Tang J., Tolbert E.. et al. (2013) Blocking the class I histone deacetylase ameliorates renal fibrosis and inhibits renal fibroblast activation via modulating TGF-beta and EGFR signaling. PLoS ONE 8, e54001 10.1371/journal.pone.0054001 [DOI] [PMC free article] [PubMed] [Google Scholar]
- 34.Crosio C., Fimia G.M., Loury R., Kimura M., Okano Y., Zhou H.. et al. (2002) Mitotic phosphorylation of histone H3: spatio-temporal regulation by mammalian Aurora kinases. Mol. Cell. Biol. 22, 874–885 10.1128/MCB.22.3.874-885.2002 [DOI] [PMC free article] [PubMed] [Google Scholar]
- 35.Schnaper H.W., Jandeska S., Runyan C.E., Hubchak S.C., Basu R.K., Curley J.F.. et al. (2009) TGF-beta signal transduction in chronic kidney disease. Front. Biosci. (Landmark Ed). 14, 2448–2465 10.2741/3389 [DOI] [PMC free article] [PubMed] [Google Scholar]
- 36.Choi M.E., Ding Y. and Kim S.I. (2012) TGF-beta signaling via TAK1 pathway: role in kidney fibrosis. Semin. Nephrol. 32, 244–252 10.1016/j.semnephrol.2012.04.003 [DOI] [PMC free article] [PubMed] [Google Scholar]
- 37.Zhou D., Fu H., Zhang L., Zhang K., Min Y., Xiao L.. et al. (2017) Tubule-derived Wnts are required for fibroblast activation and kidney fibrosis. J. Am. Soc. Nephrol. 28, 2322–2336 10.1681/ASN.2016080902 [DOI] [PMC free article] [PubMed] [Google Scholar]
- 38.Kanellis J., Watanabe S., Li J.H., Kang D.H., Li P., Nakagawa T.. et al. (2003) Uric acid stimulates monocyte chemoattractant protein-1 production in vascular smooth muscle cells via mitogen-activated protein kinase and cyclooxygenase-2. Hypertension 41, 1287–1293 10.1161/01.HYP.0000072820.07472.3B [DOI] [PubMed] [Google Scholar]
- 39.Mulay S.R., Evan A. and Anders H.J. (2014) Molecular mechanisms of crystal-related kidney inflammation and injury. Implications for cholesterol embolism, crystalline nephropathies and kidney stone disease. Nephrol. Dial. Transplant. 29, 507–514 [DOI] [PubMed] [Google Scholar]
- 40.Liu H., Xiong J., He T., Xiao T., Li Y., Yu Y.. et al. (2017) High uric acid-induced epithelial-mesenchymal transition of renal tubular epithelial cells via the TLR4/NF-kB signaling pathway. Am. J. Nephrol. 46, 333–342 10.1159/000481668 [DOI] [PubMed] [Google Scholar]
- 41.Zhao Y., Guo Y., Jiang Y., Zhu X., Liu Y. and Zhang X. (2017) Mitophagy regulates macrophage phenotype in diabetic nephropathy rats. Biochem. Biophys. Res. Commun. 494, 42–50 10.1016/j.bbrc.2017.10.088 [DOI] [PubMed] [Google Scholar]
- 42.Huang L., Garcia G., Lou Y., Zhou Q., Truong L.D., DiMattia G.. et al. (2009) Anti-inflammatory and renal protective actions of stanniocalcin-1 in a model of anti-glomerular basement membrane glomerulonephritis. Am. J. Pathol. 174, 1368–1378 10.2353/ajpath.2009.080476 [DOI] [PMC free article] [PubMed] [Google Scholar]
- 43.Kumagai T., Ota T., Tamura Y., Chang W.X., Shibata S. and Uchida S. (2017) Time to target uric acid to retard CKD progression. Clin. Exp. Nephrol. 21, 182–192 10.1007/s10157-016-1288-2 [DOI] [PubMed] [Google Scholar]
- 44.Periyasamy-Thandavan S., Jiang M., Wei Q., Smith R., Yin X.M. and Dong Z. (2008) Autophagy is cytoprotective during cisplatin injury of renal proximal tubular cells. Kidney Int. 74, 631–640 10.1038/ki.2008.214 [DOI] [PubMed] [Google Scholar]
- 45.Pallet N., Bouvier N., Legendre C., Gilleron J., Codogno P., Beaune P.. et al. (2008) Autophagy protects renal tubular cells against cyclosporine toxicity. Autophagy 4, 783–791 10.4161/auto.6477 [DOI] [PubMed] [Google Scholar]
- 46.Jiang M., Liu K., Luo J. and Dong Z. (2010) Autophagy is a renoprotective mechanism during in vitro hypoxia and in vivo ischemia-reperfusion injury. Am. J. Pathol. 176, 1181–1192 10.2353/ajpath.2010.090594 [DOI] [PMC free article] [PubMed] [Google Scholar]
- 47.Mizushima N., Levine B., Cuervo A.M. and Klionsky D.J. (2008) Autophagy fights disease through cellular self-digestion. Nature 451, 1069–1075 10.1038/nature06639 [DOI] [PMC free article] [PubMed] [Google Scholar]
- 48.Li L., Wang Z.V., Hill J.A. and Lin F. (2014) New autophagy reporter mice reveal dynamics of proximal tubular autophagy. J. Am. Soc. Nephrol. 25, 305–315 10.1681/ASN.2013040374 [DOI] [PMC free article] [PubMed] [Google Scholar]
- 49.Livingston M.J., Ding H.F., Huang S., Hill J.A., Yin X.M. and Dong Z. (2016) Persistent activation of autophagy in kidney tubular cells promotes renal interstitial fibrosis during unilateral ureteral obstruction. Autophagy 12, 976–998 10.1080/15548627.2016.1166317 [DOI] [PMC free article] [PubMed] [Google Scholar]
- 50.Kim W.Y., Nam S.A., Song H.C., Ko J.S., Park S.H., Kim H.L.. et al. (2012) The role of autophagy in unilateral ureteral obstruction rat model. Nephrology (Carlton) 17, 148–159 10.1111/j.1440-1797.2011.01541.x [DOI] [PubMed] [Google Scholar]
- 51.Mizushima N., Yoshimori T. and Levine B. (2010) Methods in mammalian autophagy research. Cell 140, 313–326 10.1016/j.cell.2010.01.028 [DOI] [PMC free article] [PubMed] [Google Scholar]
- 52.Johnson R.J., Nakagawa T., Jalal D., Sanchez-Lozada L.G., Kang D.H. and Ritz E. (2013) Uric acid and chronic kidney disease: which is chasing which ? Nephrol. Dial. Transplant. 28, 2221–2228 10.1093/ndt/gft029 [DOI] [PMC free article] [PubMed] [Google Scholar]
- 53.Li L., Yang C., Zhao Y., Zeng X., Liu F. and Fu P. (2014) Is hyperuricemia an independent risk factor for new-onset chronic kidney disease?: a systematic review and meta-analysis based on observational cohort studies. BMC Nephrol. 15, 122 10.1186/1471-2369-15-122 [DOI] [PMC free article] [PubMed] [Google Scholar]
- 54.De Cosmo S., Viazzi F., Pacilli A., Giorda C., Ceriello A., Gentile S.. et al. (2015) Serum uric acid and risk of CKD in type 2 diabetes. Clin. J. Am. Soc. Nephrol. 10, 1921–1929 10.2215/CJN.03140315 [DOI] [PMC free article] [PubMed] [Google Scholar]
- 55.Tangri N. and Weiner D.E. (2010) Uric acid, CKD, and cardiovascular disease: confounders, culprits, and circles. Am. J. Kidney Dis. 56, 247–250 10.1053/j.ajkd.2010.06.004 [DOI] [PMC free article] [PubMed] [Google Scholar]
- 56.Siu Y.P., Leung K.T., Tong M.K. and Kwan T.H. (2006) Use of allopurinol in slowing the progression of renal disease through its ability to lower serum uric acid level. Am. J. Kidney Dis. 47, 51–59 10.1053/j.ajkd.2005.10.006 [DOI] [PubMed] [Google Scholar]
- 57.Goicoechea M., de Vinuesa S.G., Verdalles U., Ruiz-Caro C., Ampuero J., Rincon A.. et al. (2010) Effect of allopurinol in chronic kidney disease progression and cardiovascular risk. Clin. J. Am. Soc. Nephrol. 5, 1388–1393 10.2215/CJN.01580210 [DOI] [PMC free article] [PubMed] [Google Scholar]
- 58.Sircar D., Chatterjee S., Waikhom R., Golay V., Raychaudhury A., Chatterjee S.. et al. (2015) Efficacy of febuxostat for slowing the GFR decline in patients with ckd and asymptomatic hyperuricemia: a 6-month, double-blind, randomized, placebo-controlled trial. Am. J. Kidney Dis. 66, 945–950 10.1053/j.ajkd.2015.05.017 [DOI] [PubMed] [Google Scholar]
- 59.Koesters R., Kaissling B., Lehir M., Picard N., Theilig F., Gebhardt R.. et al. (2010) Tubular overexpression of transforming growth factor-beta1 induces autophagy and fibrosis but not mesenchymal transition of renal epithelial cells. Am. J. Pathol. 177, 632–643 10.2353/ajpath.2010.091012 [DOI] [PMC free article] [PubMed] [Google Scholar]
- 60.Xu Y., Yang S., Huang J., Ruan S., Zheng Z. and Lin J. (2012) Tgf-beta1 induces autophagy and promotes apoptosis in renal tubular epithelial cells. Int. J. Mol. Med. 29, 781–790 [DOI] [PubMed] [Google Scholar]
- 61.Liu N., Xu L., Shi Y. and Zhuang S. (2017) Podocyte autophagy: a potential therapeutic target to prevent the progression of diabetic nephropathy. J. Diabetes Res. 2017, 3560238 10.1155/2017/3560238 [DOI] [PMC free article] [PubMed] [Google Scholar]
- 62.Sheng Y.L., Chen X., Hou X.O., Yuan X., Yuan B.S., Yuan Y.Q.. et al. (2017) Urate promotes SNCA/alpha-synuclein clearance via regulating mTOR-dependent macroautophagy. Exp. Neurol. 297, 138–147 10.1016/j.expneurol.2017.08.007 [DOI] [PubMed] [Google Scholar]
- 63.Tang J., Liu N., Tolbert E., Ponnusamy M., Ma L., Gong R.. et al. (2013) Sustained activation of EGFR triggers renal fibrogenesis after acute kidney injury. Am. J. Pathol. 183, 160–172 10.1016/j.ajpath.2013.04.005 [DOI] [PMC free article] [PubMed] [Google Scholar]
- 64.Peng Y., Cao J., Yao X.Y., Wang J.X., Zhong M.Z., Gan P.P.. et al. (2017) TUSC3 induces autophagy in human non-small cell lung cancer cells through Wnt/beta-catenin signaling. Oncotarget 8, 52960–52974 [DOI] [PMC free article] [PubMed] [Google Scholar] [Retracted]
- 65.Hu B. and Phan S.H. (2016) Notch in fibrosis and as a target of anti-fibrotic therapy. Pharmacol. Res. 108, 57–64 10.1016/j.phrs.2016.04.010 [DOI] [PMC free article] [PubMed] [Google Scholar]
- 66.Song B.Q., Chi Y., Li X., Du W.J., Han Z.B., Tian J.J.. et al. (2015) Inhibition of Notch signaling promotes the adipogenic differentiation of mesenchymal stem cells through autophagy activation and PTEN-PI3K/AKT/mTOR pathway. Cell. Physiol. Biochem. 36, 1991–2002 10.1159/000430167 [DOI] [PubMed] [Google Scholar]
- 67.Wu X., Fleming A., Ricketts T., Pavel M., Virgin H., Menzies F.M.. et al. (2016) Autophagy regulates Notch degradation and modulates stem cell development and neurogenesis. Nat. Commun. 7, 10533 10.1038/ncomms10533 [DOI] [PMC free article] [PubMed] [Google Scholar]
- 68.Netea-Maier R.T., Plantinga T.S., van de Veerdonk F.L., Smit J.W. and Netea M.G. (2016) Modulation of inflammation by autophagy: consequences for human disease. Autophagy 12, 245–260 10.1080/15548627.2015.1071759 [DOI] [PMC free article] [PubMed] [Google Scholar]
- 69.Crişan T.O., Plantinga T.S., van de Veerdonk F.L., Farcaş M.F., Stoffels M., Kullberg B.J.. et al. (2011) Inflammasome-independent modulation of cytokine response by autophagy in human cells. PLoS ONE 6, e18666, 10.1371/journal.pone.0018666 [DOI] [PMC free article] [PubMed] [Google Scholar]
- 70.Shi C.S., Shenderov K., Huang N.N., Kabat J., Abu-Asab M., Fitzgerald K.A.. et al. (2012) Activation of autophagy by inflammatory signals limits IL-1beta production by targeting ubiquitinated inflammasomes for destruction. Nat. Immunol. 13, 255–263 10.1038/ni.2215 [DOI] [PMC free article] [PubMed] [Google Scholar]


