Direct imaging with ultrafast cameras is a new technology for accurate analysis of OJIP and QA re-oxidation kinetics without artifacts.
Abstract
Chlorophyll fluorescence kinetic analysis has become an important tool in basic and applied research on plant physiology and agronomy. While early systems recorded the integrated kinetics of a selected spot or plant, later systems enabled imaging of at least the slower parts of the kinetics (20-ms time resolution). For faster events, such as the rise from the basic dark-adapted fluorescence yield to the maximum (OJIP transient), or the fluorescence yield decrease during reoxidation of plastoquinone A after a saturating flash, integrative systems are used because of limiting speed of the available imaging systems. In our new macroscopic and microscopic systems, the OJIP or plastonique A reoxidation fluorescence transients are directly imaged using an ultrafast camera. The advantage of such systems compared to nonimaging measurements is the analysis of heterogeneity of measured parameters, for example between the photosynthetic tissue near the veins and the tissue further away from the veins. Further, in contrast to the pump-and-probe measurement, direct imaging allows for measuring the transition of the plant from the dark-acclimated to a light-acclimated state via a quenching analysis protocol in which every supersaturating flash is coupled to a measurement of the fast fluorescence rise. We show that pump-and-probe measurement of OJIP is prone to artifacts, which are eliminated with the direct measurement. The examples of applications shown here, zinc deficiency and cadmium toxicity, demonstrate that this novel imaging platform can be used for detection and analysis of a range of alterations of the electron flow around PSII.
Probing of photosynthesis biophysics via chlorophyll fluorescence kinetic measurements is a powerful tool because the time course of changes in chlorophyll fluorescence quantum yield reveals many insights into subtle changes of the photosynthetic apparatus (Maxwell and Johnson, 2000; Baker, 2008; Stirbet et al., 2018). For example, most types of metal stresses directly and indirectly affect photosynthesis (review by Küpper and Andresen, 2016). The methodology can be used for photosynthetic microorganisms, cell cultures of higher plants, detached leaves, macroalgae, and whole plants as a nondestructive method. Considering that the photosynthetic apparatus is the first target of stresses such as high light, UV radiation, nutrient deficiency, and drought, monitoring of chlorophyll fluorescence kinetics is a valuable tool to assess how these constraints affect the different physiological mechanisms involved in the photosynthesis process.
Some ways to use chlorophyll fluorescence for screening were already suggested in the past, but they are based either on the slower phases of fluorescence kinetics including the response to actinic light (e.g. Omasa et al., 1987; Rolfe and Scholes, 1995; Küpper et al., 2000, 2007; Nedbal et al., 2000; Badger et al., 2009), or they do not include spatial resolution (imaging). The latter is particularly important considering that the distribution of changes over the leaf surface tells more about the origin of stress than the simple integrative measurement of a whole leaf (reviews of OJIP fluorescence induction by Stirbet and Govindjee, 2011; Stirbet et al., 2018).
The method of OJIP fluorescence transients is based on the fast rise of in vivo chlorophyll fluorescence quantum yield after starting actinic (i.e. photosynthesis initiating) light. The principles of these kinetics are well known, but several aspects are still a topic of current basic research and debate (e.g. reviewed by Stirbet and Govindjee, 2011; Schansker et al., 2014; Stirbet et al., 2018). The common interpretation generally held under many physiological conditions, as described in more details in the cited reviews, is the following. In the dark-adapted state, all photosynthetic reaction centers are in a relaxed state, which means with a full complement of electrons in the ground state. At the same time, the electron transport chain between PSII and PSI is in the relaxed state as well. This means that plastoquinone A (QA), plastoquinone B (QB), and the pool of free plastoquinone (PQ) behind the PS II reaction center are completely oxidized. In this so-called “open” (O) state (= F0), the fluorescence quantum yield of the system is minimal, as an incoming photon has maximal chance to initiate a charge separation in one of the reaction centers. Upon the start of actinic illumination of the photosystem, charge separations occur, and the electrons will migrate via QA and QB to the PQ pool. This will increase fluorescence quantum yield, because further incoming photons cannot be as easily accepted by the partially saturated electron transport chain any more. When the majority of electrons in the various reaction centers of a leaf have reduced the QA molecules in these reaction centers, the “J” state of the fluorescence kinetics has been reached. When QB is also reduced, the next level “I” of fluorescence quantum yield is reached. When the PQ pool has reached its peak of reduction, fluorescence quantum yield also reaches its peak, the “P” level. The thermal phase, i.e. the rise from I to P, is still under debate, as discussed by Schansker et al. (2014). This well-known principle is modified by metal deficiency and toxicity stress, as metals are required for the photosynthetic electron transport chain (calcium [Ca], copper [Cu], iron [Fe], magnesium [Mg], and manganese [Mn]) and photosynthesis-related enzymes. Metals directly involved in the photosynthetic light reactions include Mg in the Chls, Ca and Mn in the oxygen-evolving complex, Fe in the nonheme iron as well as cytochromes and iron-sulfur clusters in the electron transport chain, and Cu in plastocyanin. Photosynthesis-related enzymes include the Mg-dependent ribulose bisphosphate carboxylase (Rubisco), the zinc (Zn)-dependent carbonic anhydrase for CO2 delivery and antioxidative enzymes that deal with byproducts of photosynthesis, i.e. superoxide dismutase (Cu, Zn) and catalase (Fe). Some effects of how changes of metals in these sites affect photosynthesis are discussed e.g. by Yruela (2013), Küpper and Andresen (2016), and Andresen et al. (2018). Generally, the effects of metal stress on the slower phases of fluorescence kinetics are better known than those on OJIP transients. Among the many effects that can occur, as discussed in more detail in those reviews, are elevation of minimal fluorescence yield of a dark-adapted sample (F0) due to no deficient exciton transfer from the antenna to the PSII reaction center, permanent quenching of excitons by the unstable singlet excited states of heavy metal substituted chlorophyll, and reaching of maximum fluorescence yield under saturating light (Fp = Fm) at fast and at lower than usual irradiances due to inhibited electron flow after the PSII reaction center, etc.
For OJIP transients, direct imaging measurements were previously not possible due to limiting speeds of the cameras that had high enough sensitivity for recording in vivo fluorescence. Therefore, OJIP measurements are still usually done in a nonimaging way (Stirbet and Govindjee, 2011; Ceppi et al., 2012). In the only case where imaging OJIP measurements were reported (Jedmowski and Brüggemann, 2015), they were done discontinuously using the pump-and-probe (P&P) principle. In that case, the first data points of the OJIP transient (10 μs to 40 ms) were measured by a series of flashes with increasing length with 3-s dark relaxation intervals, while data points from 40 ms to 1.8 s were collected from a single flash at the end of the measurement. Thus, typically only one point is measured at a defined distance between the single-turnover flash and the image, and then the transients are repeated several times until the complete kinetics are obtained. However, such multiple repeats of a transient from F0 to Fm not only take more time, but the fluorescence yield may be altered during the many repeats. The latter can be caused by changes in nonphotochemical or photochemical quenching as it would normally happen during a dark-light transition, and the many supersaturating flashes might even cause photodamage in the PSII reaction center. The same limitations apply to measurements of QA reoxidation kinetics, where the chlorophyll fluorescence yield decreases proportionally to the opening (reoxidation) of the PS II reaction centers after a single-turnover flash, because also here the fast components are in the microsecond range.
Metals are well known to be essential for life, including in plants, because between one-third and one-half of all proteins need at least one metal for their function (Andreini et al., 2008; Andresen et al., 2018). Metals are often decisive for catalysis so that they are found in active sites of enzymes, but they can also stabilize or regulate protein folding (Andreini et al., 2008; Waldron et al., 2009; Andresen et al., 2018). Therefore, both deficiency and an excess of metals is detrimental for plants, but such deviations from optimal metal nutrition often occur, for both natural and anthropogenic reasons (Küpper and Andresen, 2016; Andresen et al., 2018). For example, metal concentrations in water and soil naturally vary due to weathering of bedrock, leaching by rain, and transport as dust by wind. Anthropogenic influences include metal release by mining, smelting, use of metals in industrial catalysts, and use as pesticides and fertilization in agriculture (Küpper and Kroneck, 2005; Küpper et al., 2006; Küpper and Andresen, 2016). Because both metal toxicity and metal deficiency can drastically influence plant growth and thus agricultural yield, an early detection of metal stress to counteract it before the harvest is irreversibly diminished, is an important task. Early diagnosis of nutrient imbalance before visible symptoms occur can be decisive for fertilization and thereby the rescue of the yield. Moreover, such analysis can be used for selection and breeding programs and predetermination of which genotypes to plant on the field.
In this work, we show the direct imaging recording of the OJIP fluorescence transient using an ultrafast camera. Compared to nonimaging measurements, this allows for the analysis of heterogeneity of the measured parameters, for example between the photosynthetic tissue near to the veins and the tissue further away from the veins. Considering heterogeneous distribution of metals between mesophyll cells within the same leaf (Küpper et al., 2007), direct imaging enables more accurate estimation of the extent and development of metal stress than a nonimaging measurement.
RESULTS AND DISCUSSION
The proof-of-principle measurements showed that indeed we can measure all features of the typical OJIP kinetics, and all phases of QA reoxidation from 20 µs onwards, in a direct imaging way. Photos of the microscopic and the macroscopic system, and screenshots of the software versions controlling both are shown in Supplemental Figure S1. In the following, we present some examples showing the versatility and power of this new method.
OJIP Transients
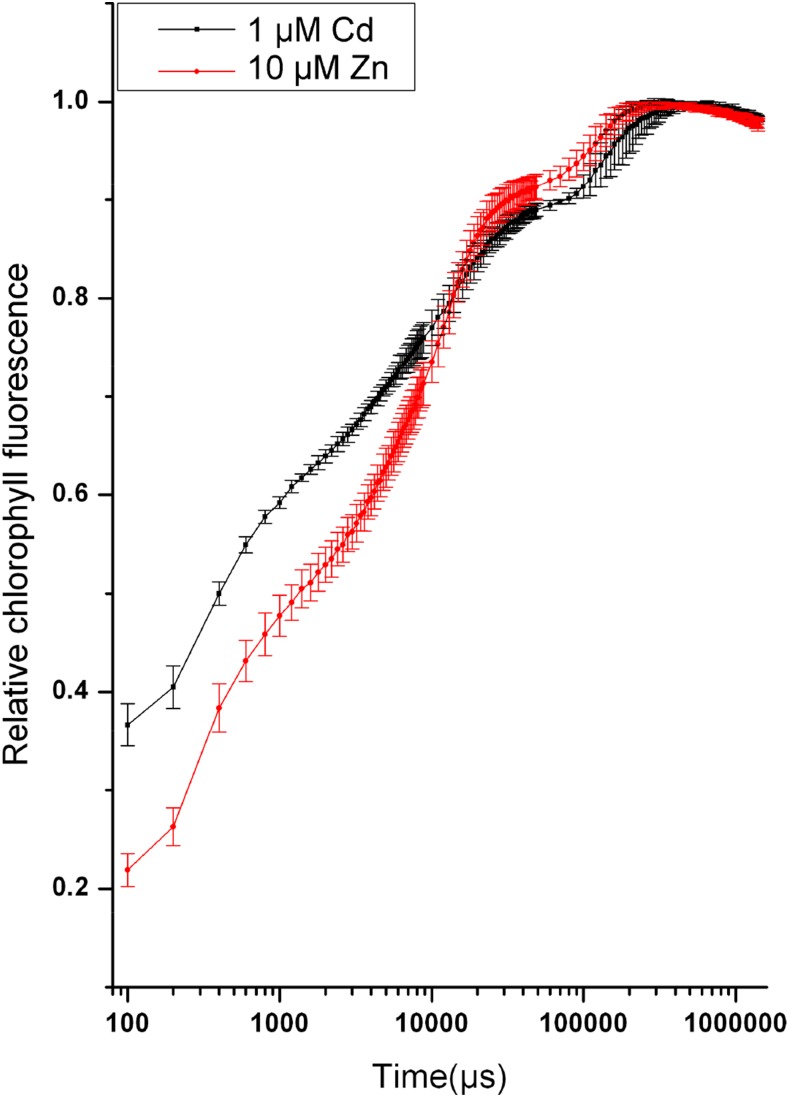
The typical OJIP steps can be observed in the kinetic representation (Fig. 1). These resemble well the shape of the OJIP transient when measured with classical nonimaging devices, contrary to indirect OJIP measurements using the P&P principle as shown in the following.
Figure 1.
Kinetic representation (mean value ± se, n = 4) of the OJIP transients from N. ochroleucum leaves that were treated with 1-μM Cd + 10-µM Zn or only 10-μM Zn for three months. These measurements were obtained with the microscopic direct fast imaging system after 5-min dark adaptation and with a supersaturating flash of ∼1,300 μmol.m−2.s−1 photon flux density as described in more detail in “Materials and Methods.” In this and all following figures showing kinetic traces from imaging measurements, the traces for each selected area represent the average of all pixels within that area. Note the different shapes of the curves for Cd-stressed and control (10 μM Zn, 0 nm Cd) leaves.
Comparison of Measuring Principles
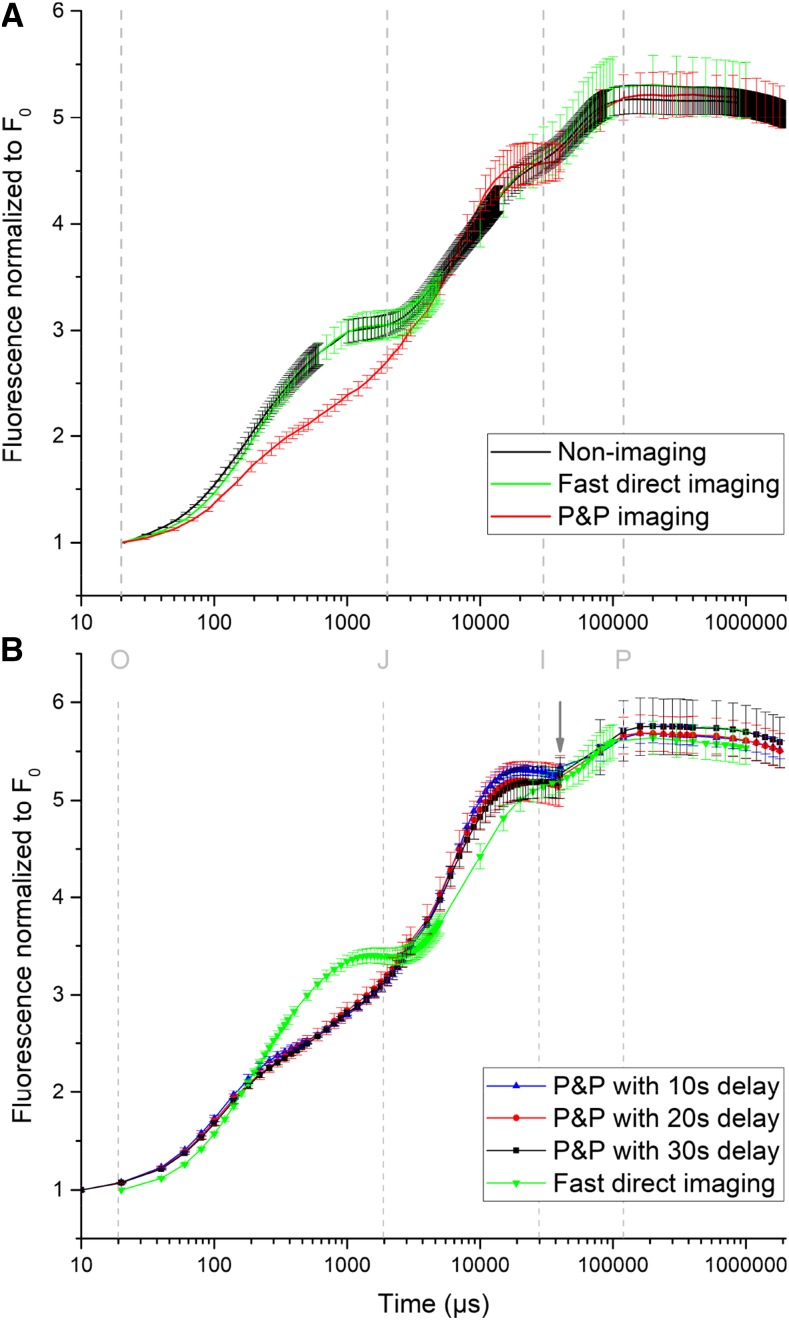
All three types of measurements have been performed on a set of leaves of similar age (Supplemental Fig. S2) for comparison: standard nonimaging fast OJIP measurement, P&P imaging measurements using a standard macroscopic FluorCam imaging system equipped only with a software upgrade, and the newly developed fast macroscopic FluorCam system for direct OJIP imaging. The data were normalized between F0 and Fm to achieve the best comparison of the shapes of the curves (Fig. 2A). For the imaging methods, all pixels within the selected leaf area were averaged. Both curves from the nonimaging and the fast direct imaging measurement were similar in contrast with P&P imaging, in which the fluorescence intensity of J, I, and P transients was lower, and the O-J rise was slower. This led to strong, statistically significant differences between the P&P imaging and the other methods in various calculated OJIP fluorescence kinetic parameters, as shown in detail with full statistical analysis in Tables 1–3. Fast direct imaging, however, delivered parameter values very close to the nonimaging measurement, with the advantage over the nonimaging measurement that the analysis of heterogeneity of each parameter can be presented pixel-by-pixel as an image. Such applications will be analyzed in the second part of the results shown here (Figs. 3–9).
Figure 2.
Comparison of different OJIP measuring methods using Arabidopsis leaves. All measurements were obtained after 5-min dark adaptation with a blue supersaturating light of ∼3,500 μmol.m−2.s−1 photon flux density as described in more detail in “Materials and Methods.” The gray dashed lines and letters show the timepoints of the OJIP steps as defined by Stirbet and Govindjee (2011). A, Comparison of nonimaging direct measurement, imaging measurement with P&P, and fast direct imaging. The values represent the average ± sd of five independent measurements (leaves of similar age on different plants). B, Comparison of different delay times for the P&P sequences with fast direct imaging. The values represent the average ± sd of four independent measurements (leaves of similar age on different plants). The arrow shows the switch from P&P to direct measurement at 40 ms.
Table 1. OJIP parameters calculated from the direct fast imaging and P&P imaging measurements.
Values represent medians ± se (n = 5 different plants). Asterisk signs denote significant differences between the two groups according to the Mann-Whitney test (*P < 0.05, **P < 0.01), which was done as a comparison of two methods: Direct fast imaging and P&P imaging. Parameter definitions according to Stirbet and Govindjee (2011): VI/J, relative variable fluorescence at the I/J step; Mo, approximate value of the initial slope of relative variable Chl fluorescence curve Vt; ΦPo, maximum quantum yield of primary PSII photochemistry (equals Fv/Fm); ABS/RC, absorption flux/effective antenna size of an active reaction center; TRo/RC, trapped energy flux leading to a reduction of QA; ET2o/RC, electron transport flux further than QA; DIo/RC, dissipation flux.
| Parameter | Direct Fast Imaging | P&P Imaging |
|---|---|---|
| Vj | 0.510 ± 0.005 | 0.46 ± 0.008** |
| Vi | 0.830 ± 0.004 | 0.9 ± 0.01* |
| Mo | 1.400 ± 0.028 | 1.11 ± 0.023* |
| ΦPo | 0.820 ± 0.002 | 0.820 ± 0.002 |
| ABS/RC | 3.37 ± 0.048 | 3.000 ± 0.027* |
| TRo/RC | 2.780 ± 0.035 | 2.450 ± 0.019* |
| ET2o/RC | 1.37 ± 0.009 | 1.310 ± 0.023 |
| DIo/RC | 0.600 ± 0.015 | 0.530 ± 0.011* |
Table 3. OJIP parameters calculated from the P&P imaging and nonimaging measurements.
Values represent medians ± se (n = 5 different plants). Asterisk signs denote significant differences between the two groups according to the Mann-Whitney test (*P < 0.05), which was done as a comparison of two methods: P&P imaging and nonimaging. Parameter definitions according to Stirbet and Govindjee (2011): VI/J, relative variable fluorescence at the I/J step; Mo, approximate value of the initial slope of relative variable Chl fluorescence curve Vt; ΦPo, maximum quantum yield of primary PSII photochemistry (equals Fv/Fm); ABS/RC, absorption flux/effective antenna size of an active reaction center; TRo/RC, trapped energy flux leading to a reduction of QA; ET2o/RC, electron transport flux further than QA; DIo/RC, dissipation flux.
| Parameter | P&P Imaging | Nonimaging |
|---|---|---|
| Vj | 0.46 ± 0.008 | 0.478 ± 0.005 |
| Vi | 0.9 ± 0.01 | 0.854 ± 0.005* |
| Mo | 1.11 ± 0.023 | 1.412 ± 0.031* |
| ΦPo | 0.820 ± 0.002 | 0.830 ± 0.001 |
| ABS/RC | 3.000 ± 0.027 | 3.527 ± 0.047* |
| TRo/RC | 2.450 ± 0.019 | 2.935 ± 0.037* |
| ET2o/RC | 1.310 ± 0.023 | 1.526 ± 0.013* |
| DIo/RC | 0.530 ± 0.011 | 0.592 ± 0.010* |
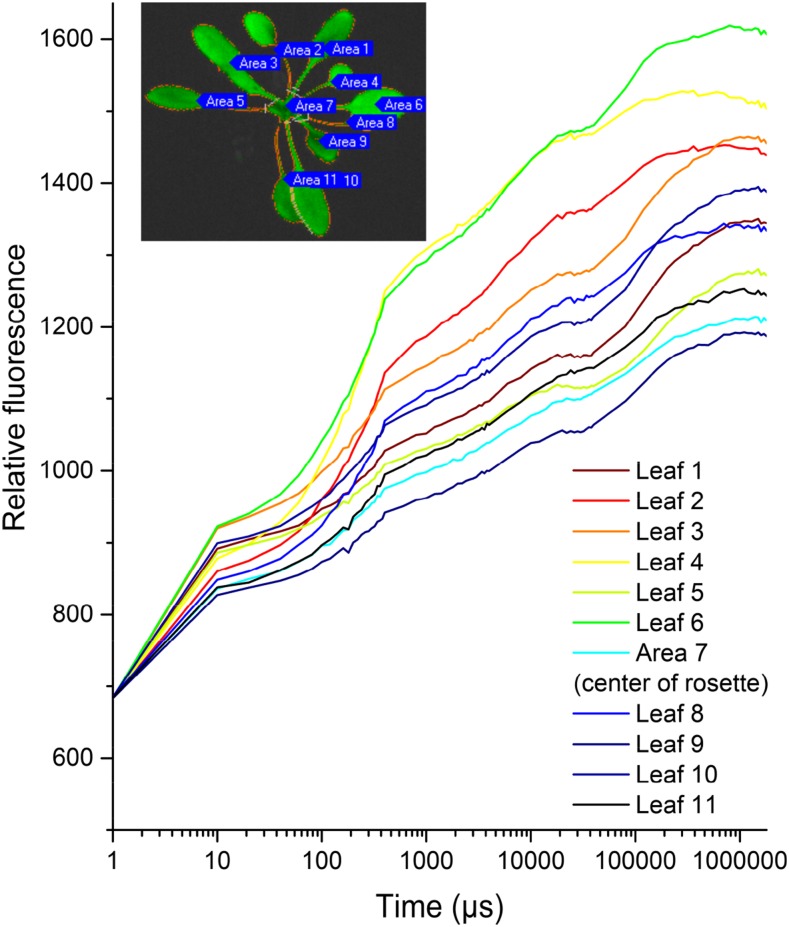
Figure 3.
Differences in OJIP kinetics between leaves of an Arabidopsis plant measured by the macroscopic direct fast imaging system. The inset image illustrates the locations of the leaves shown in the graph. Measuring conditions were the same as for Figure 2.
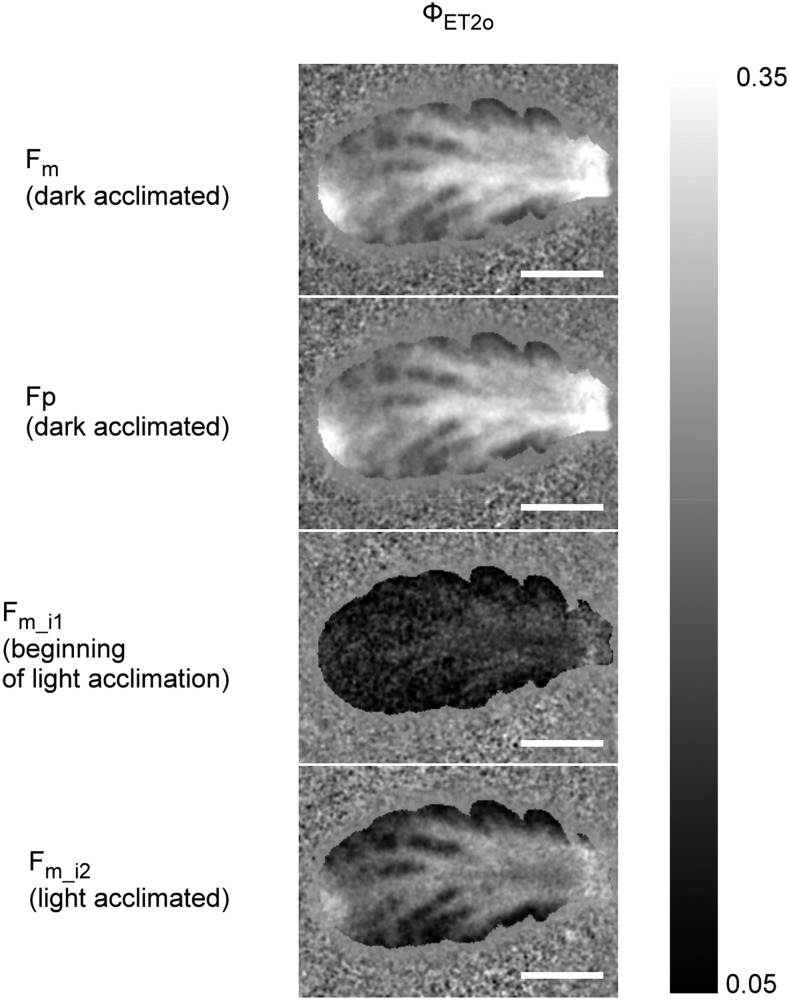
Figure 9.
ΦET2o Parameters derived from the multi-OJIP protocol of N. caerulescens leaves grown with replete (nontoxic) 100-μM Zn2+ for three months. Scale bar is 1 cm.
Table 2. OJIP parameters calculated from the direct fast imaging and nonimaging measurements.
Values represent medians ± se (n = 5 different plants). Asterisk signs denote significant differences between the two groups according to the Mann-Whitney test (*P < 0.05) which was done as a comparison of two methods: Direct fast imaging and nonimaging. Parameter definitions according to Stirbet and Govindjee (2011): VI/J, relative variable fluorescence at the I/J step; Mo, approximate value of the initial slope of relative variable Chl fluorescence curve Vt; ΦPo, maximum quantum yield of primary PSII photochemistry (equals Fv/Fm); ABS/RC, absorption flux/effective antenna size of an active reaction center; TRo/RC, trapped energy flux leading to a reduction of QA; ET2o/RC, electron transport flux further than QA; DIo/RC, dissipation flux.
| Parameter | Direct Fast Imaging | Nonimaging |
|---|---|---|
| Vj | 0.510 ± 0.005 | 0.478 ± 0.005* |
| Vi | 0.830 ± 0.004 | 0.854 ± 0.005* |
| Mo | 1.400 ± 0.028 | 1.412 ± 0.031 |
| ΦPo | 0.820 ± 0.002 | 0.830 ± 0.001* |
| ABS/RC | 3.37 ± 0.048 | 3.527 ± 0.047 |
| TRo/RC | 2.780 ± 0.035 | 2.935 ± 0.037 |
| ET2o/RC | 1.37 ± 0.009 | 1.526 ± 0.013* |
| DIo/RC | 0.600 ± 0.015 | 0.592 ± 0.010 |
The P&P method is the only way to measure OJIP with standard charge-coupled device or complementary metal-oxide-semiconductor cameras, which have between 10 and 100 frames/s. However, such measurements have artifacts as visible in Figure 2A and Tables 1–3 (comparison with the other types of measurements) as well as Figure 2B and Tables 4–6(comparison of different pause times in P&P measurements vs. direct fast imaging). The three measurements with different delay times between each measurement of P&P sequences in Figure 2B were done on exactly the same small spot of an Arabidopsis (Arabidopsis thaliana) leaf. It can clearly be seen that the relaxation time between the sequences affects the result. Because the pause is not enough for proper dark adaptation, each sequence is not starting from the real F0, and the measurement with the shortest pause is not able to reach the correct Fm (Fig. 2, A and B). The arrow is pointing at the time when the measurement is changed from P&P to continuous measurement because spacing between each measurement reached the frame rate of the camera. Comparison of the shape of curves (Fig. 2B), as well as the numerical parameters calculated from them (Tables 4–6), clearly shows that an artifact is generated by the change of the type of measurement, which takes about 10 min altogether for a 10-s pause time between the cycles. Working with longer pauses between the P&P sequences brings the curve closer to the direct measurement. But even with a 30-s pause between each P&P sequence, the shape of the curve remains very different from the directly measured curve. Already at this spacing, obtaining the measurement in P&P mode requires about half an hour. Further increase of the pause between each sequence of the P&P method is impossible in practice, because greater than 8 h of measurements would be required to obtain 100 points with 5-min spacing. Such long experiments are not practical, and additionally, cannot be accurate because sample state changes during such a long time. In conclusion, the P&P method may only be used for comparison purposes, but it cannot provide a correct OJIP curve.
Table 4. Comparison of OJIP parameters measured with direct fast imaging in comparison to P&P with 10-s delay time.
The values represent the average and se of an independent measurement on different plants. The values represent medians ± se (n = 4). Asterisks denote significant differences between the two groups according to the Mann-Whitney test (*P < 0.05, **P < 0.01, ***P < 0.001).
| Parameter | Direct Fast Imaging | P&P 10-s Delay |
|---|---|---|
| Vj | 0.520 ± 0.006 | 0.47 ± 0.007** |
| Vi | 0.87 ± 0.008 | 0.94 ± 0.005** |
| Mo | 1.44 ± 0.023 | 1.20 ± 0.027*** |
| ΦPo | 0.825 ± 0.005 | 0.82 ± 0.003 |
| ΦET2o | 0.39 ± 0.006 | 0.44 ± 0.006** |
| ΦRE1o | 0.105 ± 0.008 | 0.05 ± 0.006** |
| ABS/RC | 3.35 ± 0029 | 3.14 ± 0.033** |
| TRo/RC | 2.75 ± 0.015 | 2.575 ± 0.023** |
| ET2o/RC | 1.315 ± 0.014 | 1.385 ± 0.005* |
| RE1o/RC | 0.355 ± 0.019 | 0.16 ± 0.011*** |
| DIo/RC | 0.600 ± 0.015 | 0.565 ± 0.010 |
Table 6. Comparison of OJIP parameters measured with direct fast imaging in comparison to P&P with 30-s delay time.
The values represent the average and SE of an independent measurement on different plants. The values represent medians ± se (n = 4). Asterisks denote significant differences between the two groups according to the Mann-Whitney test (*P < 0.05, **P < 0.01, ***P < 0.001).
| Parameter | Direct Fast Imaging | P&P 30-s Delay |
|---|---|---|
| Vj | 0.520 ± 0.006 | 0.455 ± 0.009** |
| Vi | 0.87 ± 0.008 | 0.89 ± 0.009 |
| Mo | 1.44 ± 0.023 | 1.085 ± 0.043** |
| ΦPo | 0.825 ± 0.005 | 0.825 ± 0.005 |
| ΦET2o | 0.39 ± 0.006 | 0.445 ± 0.009*** |
| ΦRE1o | 0.105 ± 0.008 | 0.09 ± 0.009 |
| ABS/RC | 3.350 ± 0.029 | 2.9 ± 0.079** |
| TRo/RC | 2.750 ± 0.015 | 2.400 ± 0.052** |
| ET2o/RC | 1.315 ± 0.014 | 1.32 ± 0.013 |
| RE1o/RC | 0.355 ± 0.019 | 0.255 ± 0.019* |
| DIo/RC | 0.600 ± 0.015 | 0.500 ± 0.03* |
Table 5. Comparison of OJIP parameters measured with direct fast imaging in comparison to P&P with 20-s delay time.
The values represent the average and SE of an independent measurement on different plants. The values represent medians ± se (n = 4). Asterisks denote significant differences between the two groups according to the Mann-Whitney test (*P < 0.05, **P < 0.01, ***P < 0.001).
| Parameter | Direct Fast Imaging | P&P 20-s Delay |
|---|---|---|
| Vj | 0.520 ± 0.006 | 0.48 ± 0.003** |
| Vi | 0.87 ± 0.008 | 0.92 ± 0.005* |
| Mo | 1.44 ± 0.023 | 1.145 ± 0.006*** |
| ΦPo | 0.825 ± 0.005 | 0.825 ± 0.005 |
| ΦET2o | 0.39 ± 0.006 | 0.43 ± 0.003** |
| ΦRE1o | 0.105 ± 0.008 | 0.07 ± 0.003* |
| ABS/RC | 3.35 ± 0.029 | 2.93 ± 0.021*** |
| TRo/RC | 2.75 ± 0.015 | 2.41 ± 0.011*** |
| ET2o/RC | 1.315 ± 0.014 | 1.26 ± 0.013* |
| RE1o/RC | 0.355 ± 0.019 | 0.20 ± 0.01** |
| DIo/RC | 0.600 ± 0.015 | 0.515 ± 0.013** |
Applications of Fast Direct OJIP Imaging
Direct imaging reveals important physiological heterogeneity within leaves under different conditions. In the following, we present the whole-leaf differences in OJIP transients depending on the leaf age, and heterogeneity on individual leaves depending on metal deficiency and toxicity stress. In this proof-of-principle study, several plant species and treatments were included to investigate how far the observed phenomena are general.
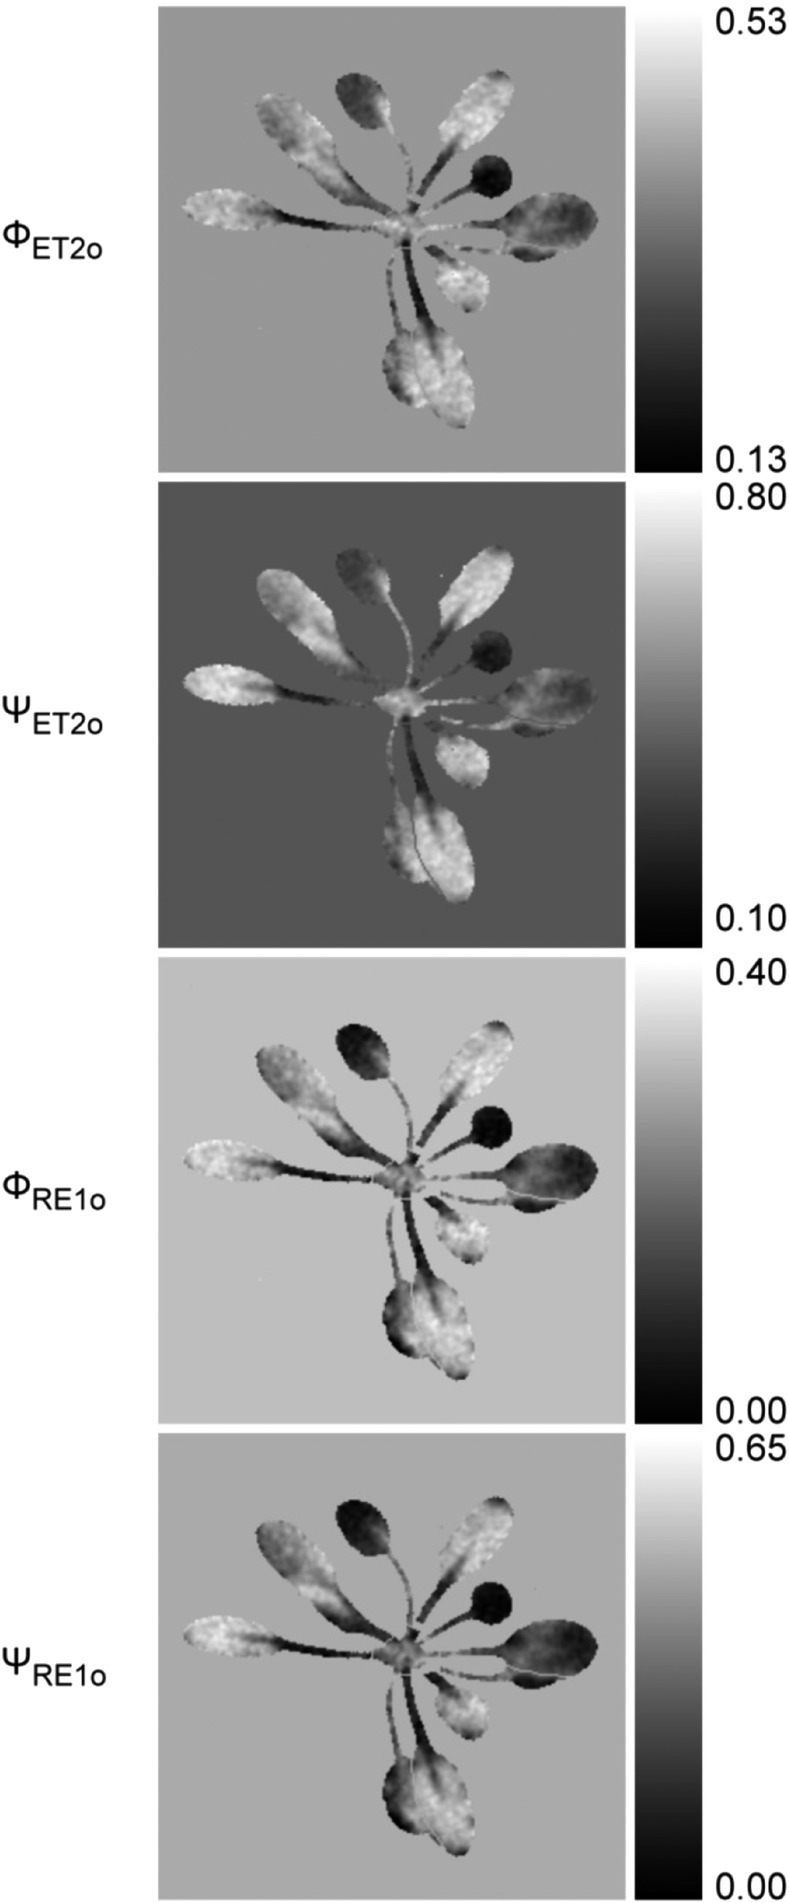
Figures 3 and 4 are showing differences in OJIP transients between leaves of different ages in a rosette of Arabidopsis. Heterogeneity between individual leaves of the plant is clearly visible in the kinetics shown in Figure 3, and heterogeneity within the leaves is shown by the parameter images in Figure 4.
Figure 4.
OJIP parameter images from the measurement of an entire Arabidopsis plant shown in Figure 3. Note that differences exist between individual leaves, as well as among the petiole, vein, and mesophyll in individual leaves.
Soybean (Glycine max) was used as a model species that is sensitive to both metal deficiency and toxicity, Noccaea ochroleucum as a relatively metal resistant plant, and Noccaea caerulescens as a metal hyperaccumulator. For metal toxicity stress, cadmium (Cd) was chosen because it is a problem in agricultural soils where it is known to accumulate because of the use of contaminated phosphate fertilizers (Nziguheba and Smolders, 2008). The chemically related Zn was chosen as an example for metal deficiency in soybean because Zn deficiency is known to be a global agricultural problem (Alloway, 2009). In general, both the deficiency of micronutrients and the toxicity of various (essential and nonessential) trace metals have detrimental effects on photosynthetic light reactions (see e.g. Andresen et al., 2018 for a recent review). These data of imaging OJIP kinetics show now, however, that the locations of these opposing types of damages are different.
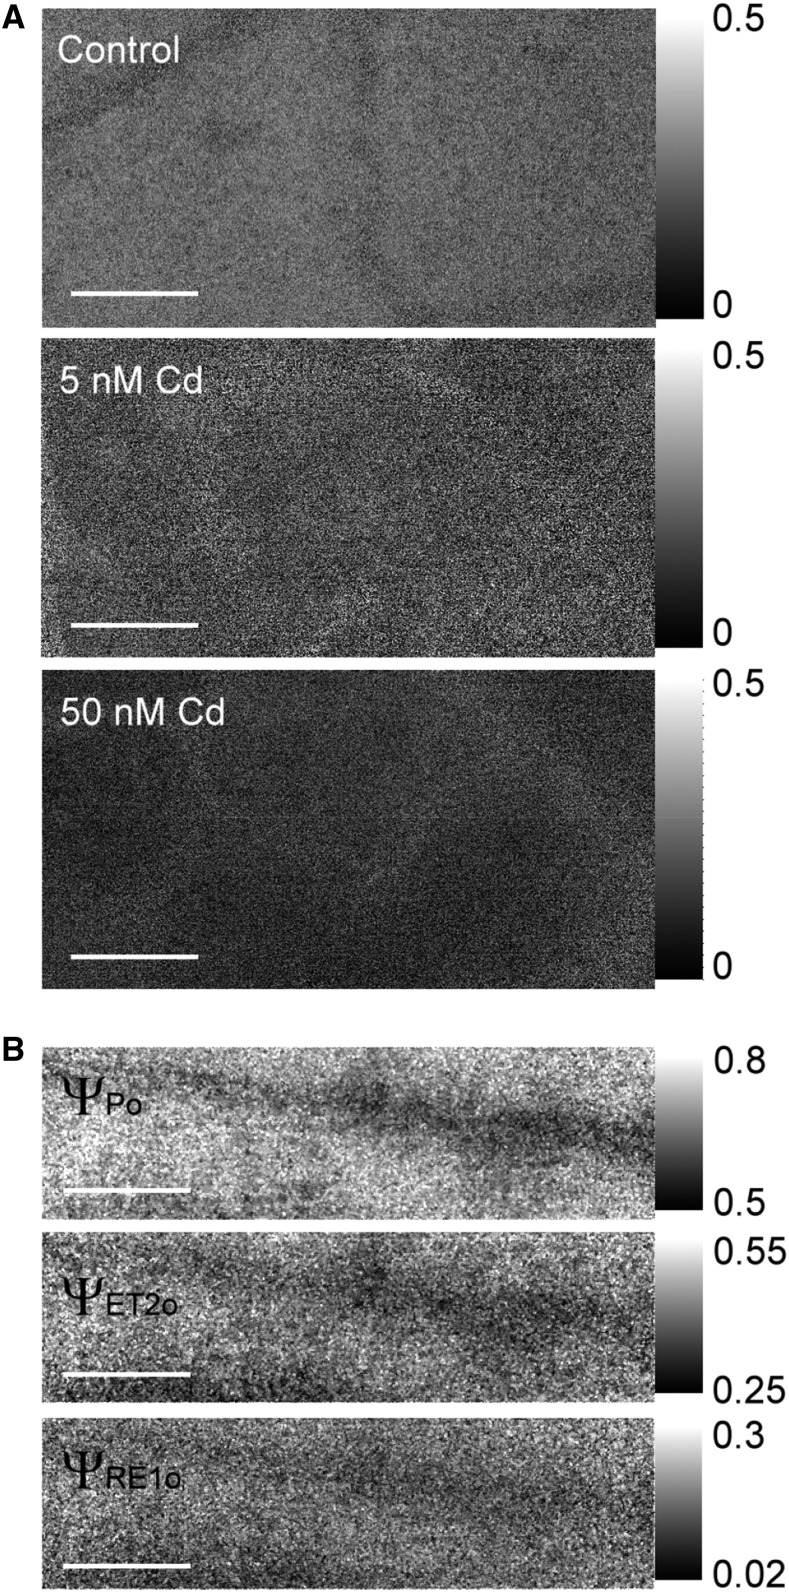
Cd toxicity generally affected the photosynthetic process all over the leaf in soybean (Fig. 5A) or along the veins in N. ochroleucum (Fig. 5B; Supplemental Fig. S3). Looking at the complete OJIP kinetics of these plants (Fig. 1) instead of the parameter maps (images), it becomes obvious that Cd increases F0 and decreases the I-level of the fluorescence induction; further investigations of the mechanism are a subject of a currently running study.
Figure 5.
Microscopic images of leaves exposed to toxic Cd. A, Soybean exposed to different concentrations of Cd for five weeks. B, N. ochroleucum exposed to 1 μM Cd for three months. The depicted parameter in (A) is ΦET2o, a measure for the quantum yield of the electron transport flux from QA to QB, and ΨRe1o is the efficiency/probability with which a PS II trapped electron is transferred to PS I acceptors. Scale bar is 300 μm.
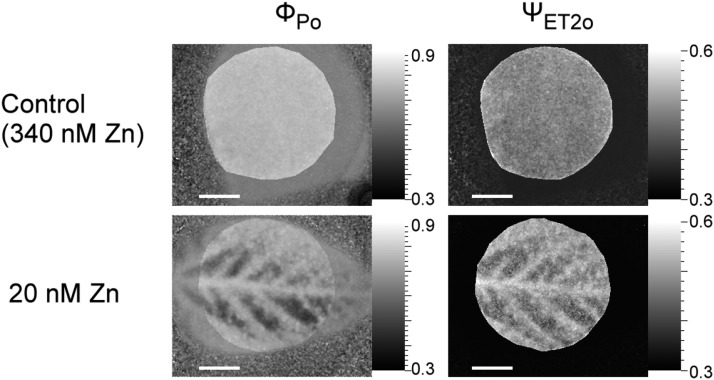
Zinc deficiency, in contrast, always led to the most severe symptoms away from the veins, as shown by Figures 6 and 7 of soybean. Stress-induced changes were generally visible in all chosen OJIP parameters (ΦET2o, ΨEt2o, ΦPo, ΨRe10, and ΦRE1o). The former two parameters show the quantum yield (ΦET2o) and efficiency/probability (ΨEt2o) of the electron transport from QA to QB (Figs. 4, 5, and 7); ΦP0 shows the maximum quantum yield of primary PS II photochemistry (Figs. 5 and 7). ΨRe1o is the efficiency/probability with which a PS II trapped electron is transferred into PSI acceptors, whereas ΦRE1o shows the quantum yield of the electron flux into the PSI electron acceptors. Comparing the images of these parameters, differences between the tissues were the least clear with ΨRe1o (Fig. 5B). Differences between the mesophyll and the veins in response to Zn deficiency in soybean leaves are shown in Tables 7–10. In accordance with the OJIP curves and the imaging data, the mesophyll of Zn-deficient leaves had higher Mo and lower ΦP0, ΨEt2o, and Rc/Jabs (number of QA reducing reaction centers per PSII antenna chlorophyll) compared to the veins, whereas no such differences were observed in the Zn-replete (340 nm Zn) treatment (Table 8). This shows the value of imaging OJIP measurements in the detection of micronutrient deficiency stress. When the tissues were compared with the parameters obtained from the whole leaf area, with pixels within the selected areas averaged (Tables 9 and 10). There were no significant differences between them and the whole leaf, because the whole-leaf values were in between the extremes of mesophyll and vein under Zn-deficient conditions.
Figure 6.
Differences in the OJIP kinetics between mesophyll and bundle sheath cells in response to zinc deficiency stress in soybean leaves (20-nm residue from chemicals and water) compared to control (340-nm Zn) for six weeks. Three areas of mesophyll and three veins were chosen from every leaf for quantification. Values represent means ± se from n ≥ 6 leaves per treatment. The measurement was done with the macroscopic system; the number of pixels averaged per curve varied according to the size of the morphological feature, but was generally in the range of dozens.
Figure 7.
Changes of ΦPo and ΨET2o in response to zinc deficiency stress in soybeans (20-nm residue from chemicals and water) compared to control (340-nm Zn) for six weeks. Scale bar is 1 cm.
Table 7. Differences in Photosynthetic Parameters between Mesophyll and Veins with Zn-deficient treatment.
These differences were in response to zinc deficiency stress in soybean leaves (20-nm residue from chemicals and water) compared to Control (340 nm Zn) for six weeks. Three areas of mesophyll and three veins were chosen from every leaf for quantification (n = 4–6 leaves per treatment). Mann-Whitney U test statistics were used for significant differences. The Z value represents standardized value corrected for the presence of ties.
| Parameter | Tissue | n | Median | Mean Rank | Sum of Ranks | U | Z | P |
|---|---|---|---|---|---|---|---|---|
| Mo | Mesophyll | 12 | 1.335 | 17.08 | 205 | 127 | 3.1493 | 0.0016 |
| Vein | 12 | 1.11 | 7.92 | 95 | ||||
| ΦPo | Mesophyll | 12 | 0.6461 | 8.58 | 103 | 25 | −2.68468 | 0.0073 |
| Vein | 12 | 0.70785 | 16.42 | 197 | ||||
| ΨET2o | Mesophyll | 12 | 0.4288 | 8.83 | 106 | 28 | −2.51147 | 0.012 |
| Vein | 12 | 0.51325 | 16.17 | 194 |
Table 10. Differences in photosynthetic parameters between vein and whole-leaf average in the Zn-deficient treatment.
These differences were in response to zinc deficiency stress in soybean leaves (20-nm residue from chemicals and water) compared to Control (340 nm Zn) for six weeks. Three areas of mesophyll and three veins were chosen from every leaf for quantification (n = 4–6 leaves per treatment). Mann-Whitney U test statistics were used for significant differences. The Z value represents standardized value corrected for the presence of ties.
| Parameter | Tissue | n | Median | Mean Rank | Sum of Ranks | U | Z | P |
|---|---|---|---|---|---|---|---|---|
| Mo | Whole leaf | 4 | 1.185 | 9.00 | 36 | 26 | 0.1823 | 0.86 |
| Vein | 12 | 1.11 | 8.33 | 100 | ||||
| Φpo | Whole leaf | 4 | 0.68505 | 7.25 | 29 | 19 | −0.54571 | 0.59 |
| Vein | 12 | 0.70785 | 8.92 | 107 | ||||
| ΨET2o | Whole leaf | 4 | 0.47785 | 6.75 | 27 | 17 | −0.78824 | 0.43 |
| Vein | 12 | 0.51325 | 9.08 | 109 |
Table 8. Differences in Photosynthetic Parameters between Mesophyll and Veins with Zn-replete treatment.
These differences were in response to zinc deficiency stress in soybean leaves (20-nm residue from chemicals and water) compared to Control (340 nm Zn) for six weeks. Three areas of mesophyll and three veins were chosen from every leaf for quantification (n = 4–6 leaves per treatment). Mann-Whitney U test statistics were used for significant differences. The Z value represents standardized value corrected for the presence of ties.
| Parameter | Tissue | n | Median | Mean Rank | Sum of Ranks | U | Z | P |
|---|---|---|---|---|---|---|---|---|
| Mo | Mesophyll | 18 | 1.1 | 19.72222 | 355 | 184 | 0.68389 | 0.49404 |
| Vein | 18 | 1.06 | 17.27778 | 311 | ||||
| Φpo | Mesophyll | 18 | 0.7678 | 18.16667 | 327 | 156 | −0.17401 | 0.86 |
| Vein | 18 | 0.76785 | 18.83333 | 339 | ||||
| ΨET2o | Mesophyll | 18 | 0.4863 | 17.83333 | 321 | 150 | −0.36387 | 0.72 |
| Vein | 18 | 0.48695 | 19.16667 | 345 |
Table 9. Differences in photosynthetic parameters between mesophyll and whole-leaf average in the Zn-deficient treatment.
These differences were in response to zinc deficiency stress in soybean leaves (20-nm residue from chemicals and water) compared to Control (340 nm Zn) for six weeks. Three areas of mesophyll and three veins were chosen from every leaf for quantification (n = 4–6 leaves per treatment). Mann-Whitney U test statistics were used for significant differences. The Z value represents standardized value corrected for the presence of ties.
| Parameter | Tissue | n | Median | Mean Rank | Sum of Ranks | U | Z | P |
|---|---|---|---|---|---|---|---|---|
| Mo | Whole leaf | 4 | 1.185 | 3.50 | 14 | 4 | −2.36646 | 0.018 |
| Mesophyll | 12 | 1.335 | 10.17 | 122 | ||||
| ΦPo | Whole leaf | 4 | 0.68505 | 12.00 | 48 | 38 | 1.63712 | 0.102 |
| Mesophyll | 12 | 0.6461 | 7.33 | 88 | ||||
| ΨET2o | Whole leaf | 4 | 0.47785 | 11.75 | 47 | 37 | 1.51585 | 0.130 |
| Mesophyll | 12 | 0.4288 | 7.42 | 89 |
In summary, observing the quantum yield of the electron transport from QA to QB (ΦET2o, ΨEt2o), clear changes occur in response to Cd toxicity or Zn deficiency. Apparently, these parameters are useful to characterize stress effects in general, whereas their tissue-specific distribution under different types of stresses may help in distinguishing the mechanisms linking nutritional imbalance to photosynthetic performance.
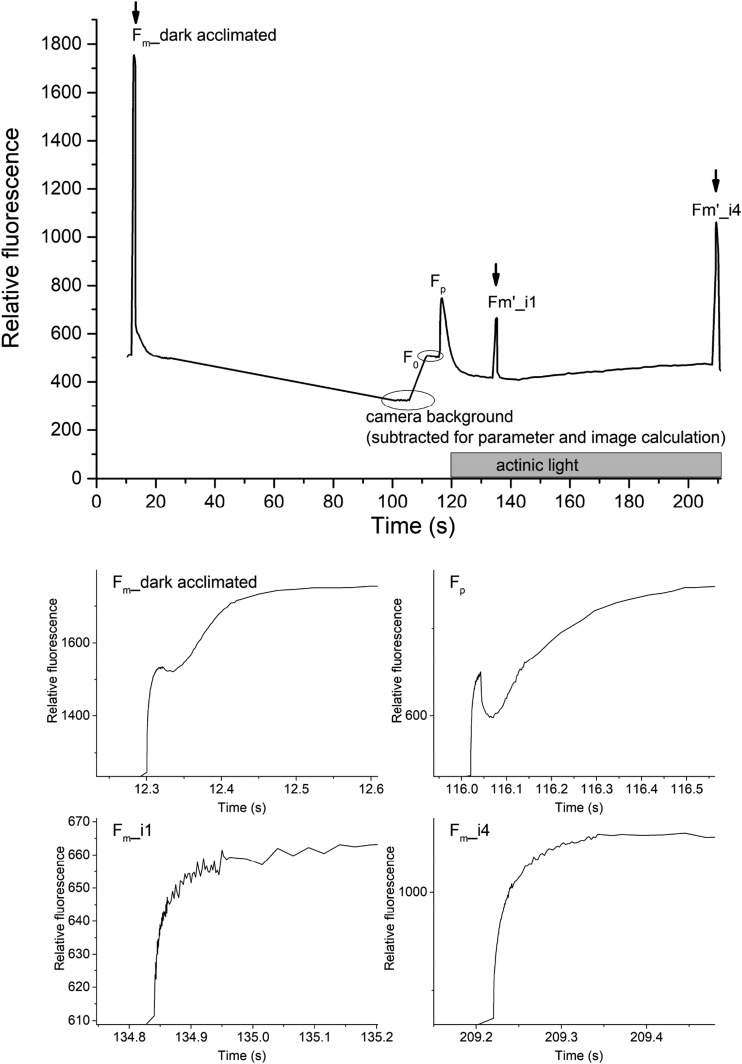
Multi-OJIP Measurements
With P&P measurements, the fast fluorescence rise can only be analyzed on the basis of a fully dark-adapted or fully light-adapted sample, and it is impossible to follow the transition between the levels of light adaptation. This becomes possible with direct imaging of fast fluorescence rises now, so that, in principle, every supersaturating flash in a quenching analysis protocol can be resolved into an OJIP-like fluorescence kinetics (Fig. 8). Our test measurements on N. caerulescens showed that the fast fluorescence rise of the flashes in the dark-adapted state (Fm) strongly differed from those in the acclimation toward actinic light. As an example, ΦET2o is shown in Figure 9. In the dark-acclimated state, all reaction centers are open so that this parameter shows high values, especially along the main veins. At the beginning of the actinic light period, where electron transport toward PS I is still not fully running, most of the PS II reaction centers become closed, so that ΦET2o sinks to minimal values. Later in the actinic light period, when electron transport becomes fully operational, more PS II reaction centers open again so that ΦET2o rises again. Interestingly, the cells near the veins acclimate faster than those away from the veins (Fig. 9), for reasons to be investigated in the future.
Figure 8.
Overview of a multi-OJIP protocol for analyzing the changes of electron transport within and after PS II in the phase of adaptation to actinic light. The period of actinic light is indicated by a gray box, and the supersaturating flashes by arrows, in the main graph. The shape of the fluorescence rises of each peak are shown below the main graph. The measured sample was a young-mature leaf of the Cd/Zn hyperaccumulator N. caerulescens grown with replete (nontoxic) 100 μM Zn2+ for three months. The graphs shown represent a typical example.
QA Reoxidation
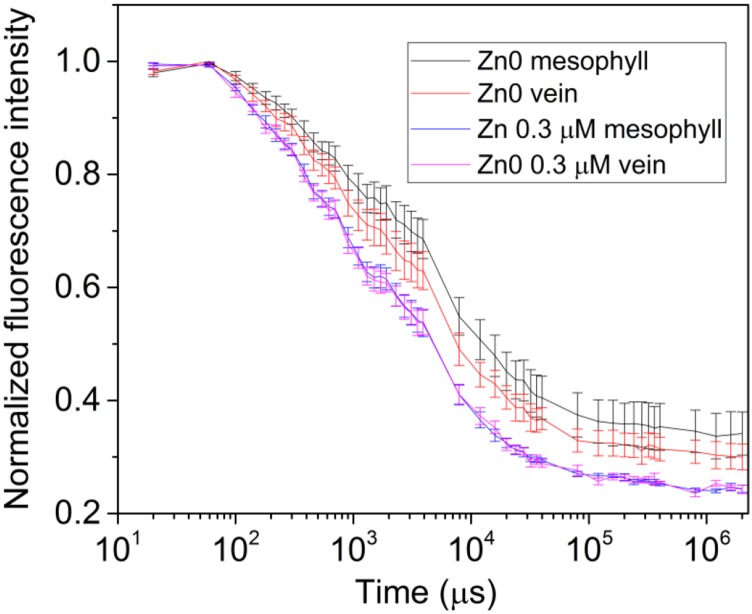
Besides the OJIP fluorescence rise, the next microsecond-time-domain fluorescence kinetics that is important for judging electron flow from PSII to PSI is the QA reoxidation. Again, the shape of the reoxidation kinetics measured in a direct imaging way corresponds well to the generally known shape of these kinetics.
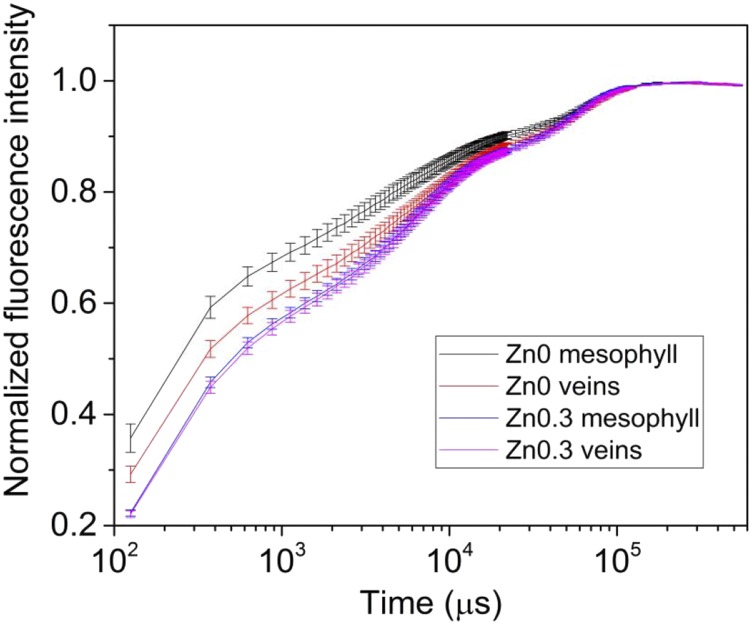
Like the OJIP parameters, QA reoxidation is clearly influenced by the metal stresses, shown here for Zn deficiency (Figs. 10 and 11). Separating the QA reoxidation into a fast phase (0 to ∼3 × 10³ μs) and a slow phase (from 3 × 10³ μs onwards), it becomes clear that the main changes induced by Zn deficiency are in the fast phase that is not accessible with conventional imaging systems (Fig. 11). Again, the fluorescence intensity of the bundle sheath cells along the veins remains higher than the mesophyll away from the veins (Figs. 10 and 11).
Figure 10.
Differences in QA reoxidation kinetics of veins (bundle sheath cells) and regular mesophyll cells in response to zinc deficiency stress in soybean leaves (20-nm residue from chemicals and water) compared to control (340-nm Zn) for six weeks. Three areas of mesophyll and three veins were chosen from every leaf for quantification. Values represent means ± se from n ≥ 6 leaves per treatment.
Figure 11.
Maps of differences in QA reoxidation kinetics of soybean leaves in response to zinc deficiency stress (20-nm residue from chemicals and water) compared to control (340-nm Zn) for six weeks. The fast phase was taken as 0 to 3 ms after the supersaturating flash (first measuring point 20 μs after the flash as in Fig. 10), the slow phase from 3 ms to 2,000 ms. Scale bar = 1 cm.
CONCLUSION
In this work we have shown that direct imaging of the OJIP fluorescence rise and QA reoxidation kinetics is possible and yields results comparable to established methods. Further, the technique presented here allows for the analysis of changes of OJIP parameters during the acclimation to actinic irradiance. Direct imaging on the whole leaf and plant level primarily allows us to distinguish between mesophyll and bundle sheath cells, which have different metabolic activity and therefore may respond to stress in a different way. Generally, such a method can certainly be used for analyzing all types of heterogeneity in photosynthetic tissues that affect PSII directly or indirectly; these can be induced by various biotic and/or abiotic stresses. Comparison of direct imaging with P&P measurements showed that the latter yield severe artifacts in the shape of the OJIP curve and the amplitude of Fm. Application examples of the fast kinetic imaging revealed strong heterogeneity of a range of OJIP kinetic parameters, as well as QA reoxidation parameters, in plant leaves of different age and after metal deficiency and toxicity stress. For example, Zn deficiency yields an opposite distribution between the veins and mesophyll of the lowering of electron transfer from the PSII reaction center than the Cd treatment. The novel methodology for analysis of OJIP transients on an area basis presented here could represent a valuable tool in ecological studies as well as plant breeding and selection of varieties that are resistant against abiotic or biotic stresses for improving plant growth and yield.
MATERIALS AND METHODS
Development of the Microscopic and Macroscopic System
Microscopic and macroscopic imaging systems were based on commercial products from Photon Systems Instruments, a Fluorescence Kinetic Microscope and a FluorCam. Both systems were modified to achieve microsecond time-resolution imaging. The key hardware modification was the fast camera, which was newly developed by Photon Systems Instruments (www.psi.cz) specially for this purpose. The new ultrafast camera with high quantum yield in the near infra-red region of Chl fluorescence was accurately synchronized with the measuring light flashes and supersaturating pulse. It can transfer the data fast enough from the sensor to the storage (internal memory) to allow a 10-μs frame rate with reasonable resolution. To allow the fast synchronization, the significant undesired deviations of digital signals from their ideal timing, which is always present in all communication links and called “jitter,” was optimized for all timings. The camera contains 1 GB memory capacity, which allows us to store the measured data before transferring them to the PC. Each measured frame is first transferred to the internal memory using a local fast bus. Later on, an internal Linux-based operating system transfers the data to an external PC via a 1 Gbit.s−1 Ethernet communication interface.
The microscopic system was based on the previous version (Küpper et al., 2007) with the modification of excitation as described by Andresen et al. (2010). Excitation light was produced by an array of 10 light-emitting diodes (LEDs), five each for actinic + supersaturating light and for measuring light, as described in Andresen et al. (2010). In brief, the main selection of exciting light was via the LEDs, while further clean-up of the spectrum of the exciting light was done via three independent filter wheels for excitation filters, dichroic mirrors, and emission filters, respectively. In the newly built system, the microscope body was a Zeiss Imager Z2, with the Fluar 5×/0.25 M27 (Zeiss) objective used in this work.
In the macroscopic FluorCam imaging systems (standard and new fast version, Photon Systems Instruments), excitation light was produced by an array of blue (460 nm peak) LEDs in which half of the LEDs (two panels) produced the actinic and supersaturating lights (maximum irradiance in supersaturating flash: 4,000 µmol.m−2.s−1). The other half (two panels, 90° from the others) produced the measuring flashes, like in the commercial version of the device, but with optimized control electronics for the fast kinetics including synchronization. Fluorescence was separated from the excitation light via a 695-nm to 780-nm bandpass filter.
Standard nonimaging OJIP kinetics was measured using the FluorPen FP-110 device (Photon Systems Instruments). We were using the version with blue LED 455 nm, and saturating light that reaches up to 4,000 μmol.m−2.s−1.
Measuring Conditions and Protocols
Generally, in all systems compared in this work (imaging and nonimaging), measuring conditions for OJIP were kept as similar as technically possible to allow direct comparisons. In this way, the period of dark adaptation was always the same (5 min, as used and explained in earlier works such as Küpper et al., 2000, 2007), excitation was always with the same type of blue LEDs (“royal blue”, 440 nm peak emission) and emission was detected through similar cutoff filters (details below). Further, exactly the same excitation spectrum with the same light intensity was used, and plants were measured under identical conditions using the two macroscopic imaging systems and the nonimaging FluorPen instrument. In both microscopic and macroscopic systems, intact leaves were kept in water-saturated air in the measuring chamber described by Küpper et al. (2007). The leaves were put into a measuring chamber, covered with a slightly moist cotton pad and held in place by a gas-permeable mesh, and aerated by filtered room air (Küpper et al., 2007).
Finally, whenever graphs or tables of numerical parameters calculated from selected image areas are shown, they represent the average of all pixels within each area. Please note that these averages were obtained from the raw data of fluorescence quantum yield, and only then the parameters were calculated, eliminating statistical artifacts that occur when such averaging is done after the parameter calculation.
Microscopic System
In the microscopic version, for exciting Chl fluorescence an excitation filter with transmission from 420 nm to 500 nm (Semrock HQ 460/80, IDEX) was used. For separating PS II-related fluorescence from exciting light, a dichroic mirror with 505-nm edge wavelength (Semrock HC Beamsplitter BS 506, IDEX) in a second filer wheel and an emission filter with 672-nm to 698-nm transmission (Semrock 684/24 BrightLine HC, IDEX) was chosen. After focusing on a suitable position on the leaf using the 25× objective, the leaf was acclimated to darkness for 5 min and the fluorescence kinetics was measured. Fluorescence emission filters for the same wavelengths were used in the other systems. In the microscopic system, the light intensity of actinic light at 100% was 675 µmol.m−2.s−1, the superlight intensity was 1,300 µmol.m−2.s−1, and the intensity of flashes at 100% intensity was 1.8 µmol.m−2.s−1. The position in pixels for the pictures on the chip were 0 (top), 90 (left), 640 (width), and 333 (height). The length of each measuring light flash, and also of the synchronized frame of the camera, was 20 µs. After measuring F0 as an average of five pictures, a 2,100-ms period of actinic light was given for recording the OJIP kinetics.
Macroscopic Direct Fast Imaging System
In the macroscopic system, similar settings were chosen for the OJIP transient measurement. A photon flux density of 3,500 μmol.m−2.s−1 was used for supersaturating flashes during the OJIP transients, and 200 µmol.m−2.s−1 were used as actinic light in the multi-OJIP measurements. A quantity of 150,000 µmol.m−2.s−1 was used for the single-turnover flash for the QA reoxidation kinetics. Except for the comparison of direct fast imaging with P&P where the exact conditions are described along with the results, the frame period was 250 µs and the shutter opening (= measuring flash length) was 100 μs. The position in pixels for the pictures on the chip were 387 (top), 480 (left), 304 (width), and 246 (height). At the fast beginning of the kinetics, images were taken every 250 μs; in the slower parts, the frame rate was gradually reduced to save memory space in the camera.
For the multi-OJIP measurement, in principle the timing sequence of the single OJIP was repeated for each supersaturating flash, but with 500-μs minimal image frame distance. In between, a standard quenching analysis protocol as used in our earlier work (e.g. Küpper et al., 2007) was applied.
For QA reoxidation measurements by fast direct imaging, the frame distance was 40 µs for the fast part of the kinetics, and the first measured frame started with the end of the supersaturating flash so that its middle was 20 µs after the supersaturating flash. Afterward, again a gradually decreasing frame rate was applied. The position in pixels for the pictures on the chip were 387 (top), 480 (left), 304 (width), and 246 (height).
Nonimaging System
The FluorPen instrument is a nonimaging fluorometer, which allows us to measure with 10-μs resolution all different types of fluorescence kinetics, including the real-time one-shot experiment using one saturating pulse to measure the whole OJIP fluorescence kinetics. Thus, the measuring protocol was designed with 10 μs spacing at the beginning and then following a logarithmic scale, comparable to the direct fast imaging system described above.
Conventional Imaging System with P&P Measurement
For the OJIP method with the standard macroscopic imaging system, a sequence of 59 saturating pulses was generated to reconstruct the fast phase of the OJIP kinetics from F0 to 40 ms. In each of these P&P sequences, the measurement had a delay from the beginning of the light pulse. The duration of flashes was progressively prolonged from the initial 10 μs up to 40 ms. Another attempt to minimize the influencing light effect was a dark relaxation pause between pulses. The pause can vary in terms of seconds or tens of seconds. However, even spacing of a few minutes turned out not to be enough to yield the complete relaxation between the flashes. And further prolongation required an excessive measuring time with the potential of changing the general state of the plant. The exposure time of the camera chip for this measurement was 20 μs as for the fast direct measurement; the limitation of frame rate of the detector to 50 frames per s originates from the data transfer rate of such cameras.
Analyses
All imaging fluorescence kinetic records were analyzed using the FluorCam 7 software (Photon Systems Instruments). In the calculation of parameter images, Gaussian smoothing over two pixels or median smoothing over three pixels was applied to diminish noise. Three parts of the mesophyll or the vein were chosen for analyses. If the vein was not obviously visible, the middle rib of the leaf area was taken. We chose certain parameters describing the quantum yields and efficiencies/probabilities of trapped electrons to be transported through the photosystems, as discussed by Stirbet and Govindjee (2011).
We chose the checkpoints by time, not by amplitude, as performed by Boisvert et al. (2006). After analyzing the first few leaves it became obvious that the P-phase is not at the same position for each sample. Therefore, we predefined the checkpoints with actual premeasured data and the fine selection of Fp was automatically done, on a pixel-by-pixel basis, by the software. The interpretation of the steps of the OJIP curve and the parameters then can be derived from them was done according to Stirbet and Govindjee (2011).
The chosen parameters were:
ΦET2o = 1-Fj/Fm = ΦPo * (1-Vj); Quantum yield of the electron transport from QA to QB;
ΦRE1o = 1-FI/Fm = ΦPo * (1-VI); Quantum yield of the electron transport flux until PS I electron acceptors;
ΨET2o = 1-Vj; Efficiency/probability with which a PS II trapped e is transferred from QA to QB;
ΨRe1o = 1-Vi; Efficiency/probability with which a PS II trapped e− is transferred to PS I acceptors.
Plant Material and Cultivation Conditions
To achieve metal limitation, all glassware was previously acid-washed in 5% HNO3, and silicon tubes were cleaned with 0.1% HCl and ddH2O. Chemicals for metal-limitation treatments were of ultra- or supra-pure grade whenever available (Andresen et al., 2016; Mishra et al., 2016; Thomas et al., 2016). All plants were grown hydroponically with the nutrient solution being aerated continuously using a lab-built system and automatically renewed by a programmable peristaltic pump, as described in Küpper et al. (2007).
Noccaea caerulescens (formerly called Thlaspi caerulescens) was grown in a greenhouse with automatic supplementation of daylight by white LEDs so that independent of weather and season a sinusoidal irradiance curve with 400 µmol.m−2.s−1 was obtained. The temperature was kept at 25°C at daytime and was allowed to sink passively to a minimum of 20°C at night. All other plants were grown in a phytochamber with a sinusoidal light and temperature cycle with a maximum of 125 µmol.m−2.s−1 (Noccaea ochroleucum, formerly called Thlaspi ochroleucum) or 400 µmol.m−2.s−1 (soybean; Glycine max) and 25°C at noon and 18°C at night.
For germination, the seeds were spread on moistened perlite: vermiculite (3:1) and incubated at 4°C in the dark for two weeks, then germinated at 20°C to 25°C.
For stratification, the seeds of Ganges ecotype of N. caerulescens and N. ochroleucum) were spread on moistened perlite: vermiculite (3:1) and incubated at 4°C in the dark for two weeks, then germinated at 20°C to 25°C. The 3-week-old N. caerulescens seedlings were transferred to plastic pots with full-strength hyperaccumulator hydroponic nutrient solution (HHNS), as described in detail by Küpper et al. (2007). N. ochroleucum plants were grown in the same HHNS except that they were treated either with 10 µM Zn or with 10 µM Zn and 1 µM Cd. The nutrient solution was continuously renewed with a flow rate of 250 ml.d−1.plant−1, and the leaves were sampled after three months.
Seeds of soybean were soaked in distilled, deionized water and germinated on perlite in acid-washed glass dishes. After 4 d, the seedlings were placed in the phytochamber and when the first pair of true leaves was present, the seedlings were transferred to hydroponic cultures. Soybean was cultivated in 1/2 strength of the HHNS that was used in our earlier studies (e.g. Küpper et al., 2004, 2007) with no addition of Zn (“Zn-limitation,” 20 nM) or with Zn (100 nM) and increasing concentrations of Cd from 5 nM to 20 nM, applied as CdSO4 × 7H2O. These low concentrations were chosen to imitate environmentally relevant Cd contamination. In a separate experiment, soybean plants were exposed to “Zn-limitation” (20 nM) or 380 nm Zn for six weeks (R4 growth phase). The nutrient solution was continuously renewed with a flow rate of 150 mL/day/plant, which was increased to 250 mL/day/plant after three weeks of treatment. After five to six weeks of exposure, young mature leaves, i.e. young leaves that already had the size of mature leaves, were used for the fluorescence kinetic measurements.
Arabidopsis (Arabidopsis thaliana) was grown on soil in a growth chamber with 60% humidity, white light from LEDs (120 µE maximum irradiance) supplemented with far red light (5 µE) in a 12-h day: 12-h night cycle, 23°C during the day and 19°C during the night.
Statistical Analyses
Significant differences between mesophyll and veins under different Zn treatments, and between leaves of different ages, were tested using the nonparametric Mann-Whitney U test at the significance level P < 0.05 in Origin Professional (version 2015; Originlab).
Supplemental Data
The following supplemental materials are available.
Supplemental Figure S1. Photos of the fast direct imaging systems and screenshots of their operating software.
Supplemental Figure S2. Photo of the Arabidopsis plants used for the comparison between the techniques.
Supplemental Figure S3. Fluorescence kinetic parameter maps showing ΦET2o and ΦPo distribution in N. ochroleucum leaves that were treated with 1 μM Cd + 10 µM Zn or only 10 μM Zn (= control) for three months.
Acknowledgments
The authors thank Pavel Korabečný and Tomas Rataj for their strong support in modifying the FluorCam software as well as for modifications of the camera firmware and hardware, all for the needs of the fast direct imaging and P&P measurements.
Footnotes
This work was supported by the Ministry of Education, Youth and Sports of the Czech Republic with cofinancing from the European Union (grant “KOROLID”, CZ.02.1.01/0.0/0.0/15_003/0000336), the Ministry of Education, Youth and Sports of the Czech Republic (grant “Jihočeské Univerzitní a Akademické Centrum Transferu Technologií,” CZ.1.05/3.1.00/10.0214), and the Czech Academy of Sciences (RVO grant 60077344).
Articles can be viewed without a subscription.
References
- Alloway BJ. (2009) Soil factors associated with zinc deficiency in crops and humans. Environ Geochem Health 31: 537–548 [DOI] [PubMed] [Google Scholar]
- Andreini C, Bertini I, Cavallaro G, Holliday GL, Thornton JM (2008) Metal ions in biological catalysis: From enzyme databases to general principles. J Biol Inorg Chem 13: 1205–1218 [DOI] [PubMed] [Google Scholar]
- Andresen E, Lohscheider J, Šetlikova E, Adamska I, Šimek M, Küpper H (2010) Acclimation of Trichodesmium erythraeum ISM101 to high and low irradiance analysed on the physiological, biophysical and biochemical level. New Phytol 185: 173–188 [DOI] [PubMed] [Google Scholar]
- Andresen E, Kappel S, Stärk HJ, Riegger U, Borovec J, Mattusch J, Heinz A, Schmelzer CEH, Matoušková Š, Dickinson B, et al. (2016) Cadmium toxicity investigated at the physiological and biophysical levels under environmentally relevant conditions using the aquatic model plant Ceratophyllum demersum. New Phytol 210: 1244–1258 [DOI] [PubMed] [Google Scholar]
- Andresen E, Peiter E, Küpper H (2018) Trace metal metabolism in plants. J Exp Bot 69: 909–954 [DOI] [PubMed] [Google Scholar]
- Badger MR, Fallahi H, Kaines S, Takahashi S (2009) Chlorophyll fluorescence screening of Arabidopsis thaliana for CO2 sensitive photorespiration and photoinhibition mutants. Funct Plant Biol 36: 867–873 [DOI] [PubMed] [Google Scholar]
- Baker NR. (2008) Chlorophyll fluorescence: A probe of photosynthesis in vivo. Annu Rev Plant Biol 59: 89–113 [DOI] [PubMed] [Google Scholar]
- Boisvert S, Joly D, Carpentier R (2006) Quantitative analysis of the experimental O-J-I-P chlorophyll fluorescence induction kinetics. Apparent activation energy and origin of each kinetic step. FEBS J 273: 4770–4777 [DOI] [PubMed] [Google Scholar]
- Ceppi MG, Oukarroum A, Çiçek N, Strasser RJ, Schansker G (2012) The IP amplitude of the fluorescence rise OJIP is sensitive to changes in the photosystem I content of leaves: A study on plants exposed to magnesium and sulfate deficiencies, drought stress and salt stress. Physiol Plant 144: 277–288 [DOI] [PubMed] [Google Scholar]
- Jedmowski C, Brüggemann W (2015) Imaging of fast chlorophyll fluorescence induction curve (OJIP) parameters, applied in a screening study with wild barley (Hordeum spontaneum) genotypes under heat stress. J Photochem Photobiol B 151: 153–160 [DOI] [PubMed] [Google Scholar]
- Küpper H, Andresen E (2016) Mechanisms of metal toxicity in plants. Metallomics 8: 269–285 [DOI] [PubMed] [Google Scholar]
- Küpper H, Kroneck PM (2005) Heavy metal uptake by plants and cyanobacteria. Met Ions Biol Syst 44: 97–144 [PubMed] [Google Scholar]
- Küpper H, Šetlík I, Trtílek M, Nedbal L (2000) A microscope for two-dimensional measurements of in vivo chlorophyll fluorescence kinetics using pulsed measuring radiation, continuous actinic radiation, and saturating flashes. Photosynthetica 38: 553–570 [Google Scholar]
- Küpper H, Mijovilovich A, Meyer-Klaucke W, Kroneck PM (2004) Tissue- and age-dependent differences in the complexation of cadmium and zinc in the cadmium/zinc hyperaccumulator Thlaspi caerulescens (Ganges ecotype) revealed by x-ray absorption spectroscopy. Plant Physiol 134: 748–757 [DOI] [PMC free article] [PubMed] [Google Scholar]
- Küpper H, Küpper FC, Spiller M (2006) [Heavy metal]-chlorophylls formed in vivo during heavy metal stress and degradation products formed during digestion, extraction and storage of plant material. In Grimm B, Porra R, Rüdiger W, Scheer H, eds, Advances in Photosynthesis and Respiration Chlorophylls and Bacteriochlorophylls, Vol 25, 5. Springer, Dordrecht, pp 67–77 [Google Scholar]
- Küpper H, Parameswaran A, Leitenmaier B, Trtílek M, Setlík I (2007) Cadmium-induced inhibition of photosynthesis and long-term acclimation to cadmium stress in the hyperaccumulator Thlaspi caerulescens. New Phytol 175: 655–674 [DOI] [PubMed] [Google Scholar]
- Maxwell K, Johnson GN (2000) Chlorophyll fluorescence—a practical guide. J Exp Bot 51: 659–668 [DOI] [PubMed] [Google Scholar]
- Mishra S, Alfeld M, Sobotka R, Andresen E, Falkenberg G, Küpper H (2016) Analysis of sublethal arsenic toxicity to Ceratophyllum demersum: Subcellular distribution of arsenic and inhibition of chlorophyll biosynthesis. J Exp Bot 67: 4639–4646 [DOI] [PMC free article] [PubMed] [Google Scholar]
- Nedbal L, Soukupová J, Kaftan D, Whitmarsh J, Trtílek M (2000) Kinetic imaging of chlorophyll fluorescence using modulated light. Photosynth Res 66: 3–12 [DOI] [PubMed] [Google Scholar]
- Nziguheba G, Smolders E (2008) Inputs of trace elements in agricultural soils via phosphate fertilizers in European countries. Sci Total Environ 390: 53–57 [DOI] [PubMed] [Google Scholar]
- Omasa K, Shimazaki K, Aiga I, Larcher W, Onoe M (1987) Image analysis of chlorophyll fluorescence transients for diagnosing the photosynthetic system of attached leaves. Plant Physiol 84: 748–752 [DOI] [PMC free article] [PubMed] [Google Scholar]
- Rolfe SA, Scholes JD (1995) Quantitative imaging of chlorophyll fluorescence. New Phytol 131: 69–79 [DOI] [PubMed] [Google Scholar]
- Schansker G, Tóth SZ, Holzwarth AR, Garab G (2014) Chlorophyll a fluorescence: Beyond the limits of the QA model. Photosynth Res 120: 43–58 [DOI] [PubMed] [Google Scholar]
- Stirbet A, Govindjee (2011) On the relation between the Kautsky effect (chlorophyll a fluorescence induction) and Photosystem II: Basics and applications of the OJIP fluorescence transient. J Photochem Photobiol B 104: 236–257 [DOI] [PubMed] [Google Scholar]
- Stirbet A, Lazár D, Kromdijk J, Govindjee (2018) Chlorophyll a fluorescence induction: Can just a one-second measurement be used to quantify abiotic stress responses?. Photosynthetica 56: 86–104 [Google Scholar]
- Thomas G, Andresen E, Mattusch J, Hubáček T, Küpper H (2016) Deficiency and toxicity of nanomolar copper in low irradiance—A physiological and metalloproteomic study in the aquatic plant Ceratophyllum demersum. Aquat Toxicol 177: 226–236 [DOI] [PubMed] [Google Scholar]
- Waldron KJ, Rutherford JC, Ford D, Robinson NJ (2009) Metalloproteins and metal sensing. Nature 460: 823–830 [DOI] [PubMed] [Google Scholar]
- Yruela I. (2013) Transition metals in plant photosynthesis. Metallomics 5: 1090–1109 [DOI] [PubMed] [Google Scholar]


