Abstract
The use of triphenyl phosphate (TPhP) as a flame retardant or plasticizer has increased during the last decade, resulting in widespread human exposure without commensurate toxicity assessment. The main objectives of this study were to assess the in vitro effect of TPhP and its metabolite diphenyl phosphate (DPhP) on the adipogenic differentiation of 3T3-L1 cells, as well as glucose uptake and lipolysis in differentiated 3T3-L1 adipocytes. TPhP increased pre-adipocyte proliferation and subsequent adipogenic differentiation of 3T3-L1 cells, coinciding with increased transcription in the CEBP and PPARG pathway. Treatment of mature adipocytes with TPhP increased the basal- and insulin stimulated- uptake of the glucose analog 2-[N (−7-nitrobenz-2-oxa1, 3-diazol-4-yl) amino]-2-deoxy-d-glucose (2-NBDG). This effect was ablated by inhibition of PI3K, a member of the insulin signaling pathway. DPhP had no significant effect on cell proliferation and, compared to TPhP, a weaker effect on adipogenic differentiation and on 2-NBDG uptake. Both TPhP and DPhT significantly enhanced the isoproterenol-induced lipolysis, most likely by increasing the expression of lipolytic genes during and after differentiation. This study suggests that TPhP increases adipogenic differentiation, glucose uptake, and lipolysis in 3T3-L1 cells through endocrine and noradrenergic mechanisms.
Keywords: Obesity, Diabetes mellitus, Fatty acids, Triphenyl phosphate, Diphenyl phosphate, Firemaster 550
1. Introduction
Endocrine disrupting chemicals (EDCs) interfere with hormonal action and cause non-monotonic impairments of hormonal functions in the regulation of development, maintenance of homeostasis and physiological processes, including adipogenesis and energy balance (Gore et al. 2015; Zoeller et al. 2012). Further, perinatal exposure to EDCs and other environmental pollutants has been proposed to be a contributing factor to overweight and obesity under the so-called “environmental obesogen” hypothesis (Grun and Blumberg 2006; La Merrill and Birnbaum 2011).
Obesity has been increasing in all countries, with prevalence doubling during the past three decades to reach a global prevalence of 11% of adult men and 15% of adult women in 2014 (Ogden et al. 2014; WHO 2014). If these current trends continue, by 2025, global obesity prevalence will reach 18% in men and surpass 21% in women (NCD-RisC 2016). Developed countries such as United States are stressing the dramatic levels of such trends, where 35% of the adult population was already obese in 2012 (Ogden et al. 2014). During the last decades, studies with twins have demonstrated that the genetic heritability of the variation in obesity-related phenotypes, such as body mass index, is only between 40 and 60% (Qi and Cho 2008; Silventoinen et al. 2016). This substantiates the intuitive notion that genetics alone cannot account for the rapid change in the prevalence of obesity. Environmental factors and their interaction with the genome must then have a substantial role in the change in obesity prevalence. EDCs may well be a component of that environmental contribution to obesity.
Given the relatively recent rise in obesity, the most plausible candidate obesogens are those EDCs that have also risen in use over the same time period. In this regard, phosphate flame retardants are plausible candidate obesogens. The phosphate flame retardants have been extensively used, especially in US, as additives to polymers and resins to reduce the flammability of furniture, electronics and construction materials during the last several decades including their recent replacement of the polybrominated diphenyl ether (PBDE) flame retardants (Dodson et al. 2012; van der Veen and de Boer 2012). For example, triphenyl phosphate (TPhP) is a phosphate ester used as a flame retardant in both consumer and industrial products or as a plasticizer (Mendelsohn et al. 2016). Exposure to TPhP is widespread among the general population (Cooper et al. 2011; Dodson et al. 2012; Dodson et al. 2014) and results in a rapid (36 h) hepatic hydrolysis into the main metabolite diphenyl phosphate (DPhP) which is mainly excreted in urine (Cooper et al. 2011; Su et al. 2014).
One exploratory study of developmental Firemaster 550 exposure found this mixture of compounds, which includes 17% TPhP, caused an increased body mass, fasting glucose and glucose intolerance in adult rat offspring (Patisaul et al. 2013). Recently, rats developmentally exposed to TPhP at the same dose and for the same developmental window as was used in the Firemaster 550 study (Patisaul et al. 2013) had increased adiposity and an earlier onset of type 2 diabetes independent of adiposity (Green et al. 2016). This suggested that TPhP could be a primary metabolic toxicant in the Firemaster 550 mixture. In corroboration with these in vivo observations, in vitro exposure to Firemaster 550 and TPhP initiated differentiation of adipocytes, mediated by the activation of the master regulator peroxisome proliferator-activated receptor γ (PPARγ) (Belcher et al. 2014; Pillai et al. 2014). In follow-up to this emerging body of evidence, the main objectives of this study were to assess the possible endocrine and/or noradrenergic effects of TPhP and its metabolite DPhP on adipogenic differentiation, glucose uptake and lipolysis. This study exploits the 3T3-L1 in vitro model because the 3T3-L1 preadipocytes are the only cell line capable of complete differentiation into mature white adipocytes, representing a stable and reproducible model to study obesogen compounds (Green and Kehinde 1975; Pereira-Fernandes et al. 2014).
2. Materials and methods
2.1. Materials
Fetal bovine serum (FBS) was purchased from Gemini Bio Products (Sacramento, California, USA). Newborn calf serum (NCS), rosiglitazone, dexamethasone, 3-isobutyl-1-methylxanthine (IBMX), dimethyl sulf-oxide (DMSO), methylene blue dye, DPhP, and insulin from bovine pancreas were purchased from Sigma Chemical (St. Louis, Missouri, USA). TPhP was acquired from Accustandard (New Haven, Connecticut, USA). Phosphate buffered Saline (PBS) was purchased from Boston Biochem (Cambridge, Massachusetts, USA). High glucose (4.5 g/L), low glucose (1 g/L), and plain (no glucose) Dulbecco’s modified Eagle Medium (DMEM) and penicillin/streptomycin were purchased from Life Technologies (Grand Island, New York, USA). We used the inhibitor of phosphoinositide 3-kinase (PI3K), LY294002, also from Life Technologies. The fluorescent glucose analog 2-[N (−7-nitrobenz-2-oxa1, 3-diazol-4-yl) amino]-2-deoxy-D-glucose (2-NBDG) was purchased from Cayman Chemicals (Ann Arbor, Missouri, USA). The 3-(4–5-dimethylthiazol-2-yl)-2,5-diphenyl tetrazolium (MTT) cell proliferation assay was purchased from the American Type Culture Collection (Manassas, Virginia, USA). The AdipoSIGHT Lipolysis Assay Kit was purchased from ZEN-BIO Inc., Chapel Hill, NC, USA. The Mem-PER™Plus Membrane Protein Extraction Kit was purchased from Thermo Fisher Scientific (Rockford, Illinois, USA) and the BCA protein assay kit was purchased from Millipore (Milford, Massachusetts, USA). The chemicals were dissolved in DMSO with the exception of 2-NBDG, which was dissolved in ethanol.
2.2. Cell culture and differentiation
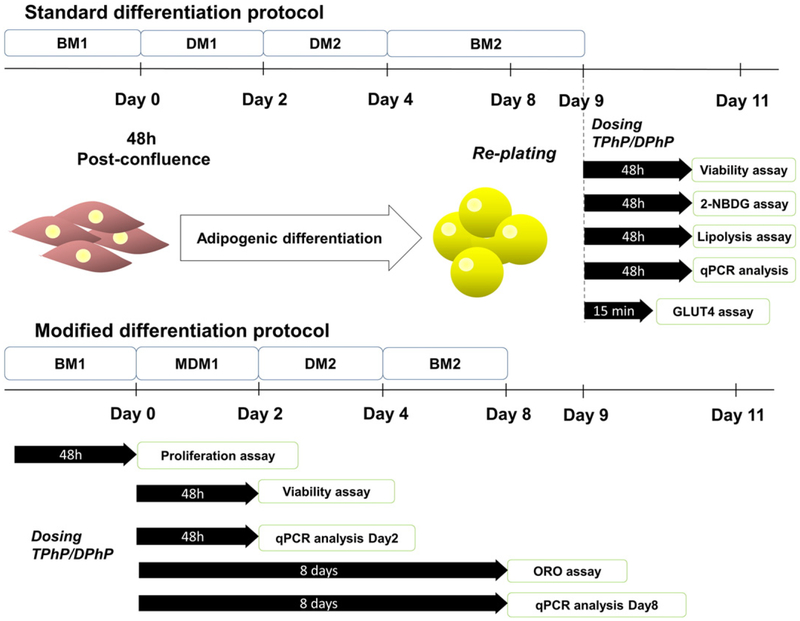
3T3-L1 pre-adipocytes (American Type Culture Collection) were maintained in T75 flasks with basal media 1 (BM1), containing high glucose DMEM supplemented with 10% newborn calf serum and penicillin/streptomycin as previously described (Vishwanath et al. 2013). The cells were passaged at 80% of confluence, never exceeding the 8th passage. Adipogenic differentiation was induced during 48 h post-con-fluence (Day 0, Fig. 1) with differentiation media 1 (DM1), consisting of high glucose DMEM, fetal bovine serum (10%), insulin (1 μg/mL), dexamethasone (0.25 μM), IBMX (0.5 mM) and rosiglitazone (2 μM) (Zebisch et al. 2012). Subsequently, the media was replaced by differentiation media 2 (DM2) which consisted of high glucose DMEM, FBS (10%) and insulin (1 μg/mL) for two additional days and then, maintained in basal media 2 (BM2) until day 8 when fibroblasts differentiated to an adipocyte phenotype. Cells were fed with fresh media every two days, and once differentiated they were replated to 96-well plates for 2-NBDG, lipolysis or viability assays.
Fig. 1.
Study design, differentiation and dosing protocol. BM1, basal media 1; BM2, basal media 2; DM1, differentiation media 1; MDM1, modified differentiation media 1; DM2, differentiation media 2; ORO assay, oil red O assay.
2.3. Cell viability and proliferation assays.
The effect of TPhP and DPhP on cell viability of 3T3-L1 mature adipocytes was assessed by exposing the differentiated cells to either chemical for 48 h at the dose range of 0 to 50 μM (Fig. 1). Cell viability was measured in confluent pre-adipocyte fibroblasts and differentiated adipocytes by a MTT based assay and complemented by a methylene blue assay using published procedures (Felice et al. 2009; Hwang et al. 2007). Cell proliferation was assessed with the MTT assay on growing fibro-blasts seeded at low density (103 cell/well) and dosed at different concentrations of TPhP or DPhP (0 to 50 μM) for 48 h.
2.4. Oil red O assay
The effect of TPhP and DPhP on adipogenic differentiation was determined by exposing the 3T3-L1 pre-adipocytes to DMSO, TPhP (0–50 μM) or DPhP (0–100 μM) throughout the differentiation process, using a modified differentiation media (without rosiglitazone) intended to decrease the basal differentiation (Fig. 1). Cells were provided fresh media supplemented with TPhP and DPhP every 2 days. At day 8, differentiated cells were washed twice with PBS and fixed with formalin (10%) for neutral lipid staining with oil red O as reported elsewhere (Pereira-Fernandes et al. 2013). Relative differences between control (DMSO) and either TPhP or DPhP groups were measured by comparing the absorbance (570 nM, Tecan Infinite® 200PRO plate reader, Tecan Group Ltd., Salzburg, Austria) of oil red O eluates from the monolayers, obtained with 100% isopropanol.
2.5. 2-NBDG uptake assay
The effect of TPhP (0.01–50 μM) and DPhP (0.01–100 μM) on glucose uptake was determined by exposing mature 3T3-L1 adipocytes to these chemicals for 48 h in presence and absence of insulin (100 nM) using the fluorescence analog 2-NBDG (80 μM, Fig. 1). After incubation, the cell monolayer was washed twice with cold PBS and fluorescence retained in the cell monolayer was measured (excitation/emission = 485/535 nm) with a Tecan Infinite® 200PRO plate reader. The inhibitor of PI3K LY294002 (10 μM) was added 30 min prior to TPhP (50 μM) to explore the effect of TPhP on the insulin signaling pathway.
2.6. Immunoblot of GLUT4 translocation
3 T3-L1 cells were differentiated in 10-cm diameter plates using the standard protocol. At the end of differentiation, the cells were serum starved for 3 h and incubated with vehicle control (DMSO), insulin (100 nM), TPhP (50 μM), and insulin with TPhP at same concentrations for 15 min. At the end of incubation, plasma membranes were isolated using the Mem-PER™Plus Membrane Protein Extraction Kit protocol for adherent mammalian cells (Thermo Fisher Scientific, Phuchareon et al., 2015). Briefly, the cells were washed with PBS twice and scraped with wash solution followed by centrifugation at 300g for 5 min. The membrane proteins were isolated according to the kit protocol through sequential steps of centrifugation at 16,000g for 15 min (4°C) to permeabilize and solubilize cell membranes with the commercial buffers. Finally, the proteins were quantified using a BCA protein assay kit (Millipore, Milford, USA).
Utilizing the method optimized by Kaur and Bachhawatt, the protein extracts were incubated for 10 min at 95°C with beta-mercaptoethanol (2.5%) and subjected to polyacrylamide gel electrophoresis (PAGE) with 10% sodium dodecyl sulfate (SDS) followed by electrotransfer onto nitrocellulose membrane (0.2 μM, BIO-RAD, Hercules, USA) (Kaur and Bachhawat 2009). The membrane was probed with the monoclonal antibody GLUT4 (1F8; Cell Signaling Technology, Beverly, USA) and the secondary antibody goat anti-mouse IgG-HRP (sc-2005; Santa Cruz Bio-technology, Santa Cruz, USA). Detection solution (ProSignal™ Femto, Genesee Scientific, San Diego, USA) was added 2 min prior to the chemiluminescent blot visualization with myECL™ Imager (Thermo Scientific). Signal was quantified with ImageJ software (US National Institutes of Health).
2.7. Lipolysis assay
Mature 3T3-L1 adipocytes were exposed to either TPhP or DPhP for 48 h to assess their effect on basal lipolysis (Fig. 1) by determining the level of intracellular free glycerol released into the media (AdipoSIGHT Lipolysis Assay, ZEN-BIO Inc.). We further assessed the noradrengic effects of the chemicals on lipolysis by incubating the differentiated adipocytes with isoproterenol (2 μM, provided in the commercial kit) and TPhP or DPhP for 48 h.
2.8. mRNA expression analysis
Transcript expression of the master regulators of adipogenesis [e.g. Pparg, CCAAT/enhancer binding protein (alpha (Cebpa), beta (Cebpb) and delta (Cebpd)), retinoid X receptor alpha (Rxra)] and lipid catabolism [Lipoprotein lipase (Lpl), monoglyceride lipase (Mgll) and patatin-like phospholipase domain containing 2 (Pnpla2)] was determined at day 2 and 8 of differentiation in adipocytes exposed to DMSO or TPhP (0,1, 10 or 25 μM). These two time points were selected to capture the early and later transcriptional changes associated with adipogenic differentiation (Janesick and Blumberg 2011). Additionally, the expression of acetyl-Coenzyme A carboxylase alpha (Acaca), Lpl, Pnpla2 and fatty acid synthase (Fasn) was assessed on differentiated cells exposed to TPhP (0, 5 or 50 μM) for 48 h. Using random allocation, total mRNA from cells was extracted (RNeasy, Qiagen, Valencia, USA) and quantified fluorometrically (Qubit RNA HS, Invitrogen Life Technologies, Oregon, USA). RNA (1 μg) was reverse transcribed (High Capacity cDNA Reverse Transcription Kit, Applied Biosystems Foster City, USA) and subjected to real-time PCR (Stratagene MxP3005, Agilent Technologies, Palo Alto, USA) with Sybrgreen detection (Brilliant Sybrgreen master mix, Agilent Technologies). The list of primer sequences is summarized in the Supplemental Table 1. The comparative Ct method (2−ΔΔCt) was used to represent the results as fold change relative to the vehicle control after adjusting for β-actin (Actb) as endogenous control (Livak and Schmittgen 2001).
2.9. Statistical analysis
Results were presented as means with the standard error of the mean. Values as percentage relative to the vehicle control were presented for most assays with exception of mRNA expression analysis and the GLUT4 translocation assay, which were presented as fold change. Relative results were arcsine transformed to ensure normality before any statistical analysis. Comparison of different levels of TPhP or DPhP with the vehicle control was evaluated with one-way ANOVA followed by a Dunnet’s multiple comparison test. Statistical analysis of effects of TPhP or DPhP (Factor 1), with or without either insulin or isoproterenol (Factor 2), and their interactions, was performed with two-way ANOVA followed of Dunnett’s multiple comparison test. The differences between groups were considered statistically significant if the adjusted P value was below 0.05 for the factors and below 0.1 for their interactions. All statistical analyses and graphs were executed with GraphPad Prism v7 (GraphPad Software, Inc., La Jolla, USA).
3. Results
3.1. Effect of TPhP and DPhP on fibroblast proliferation and adipocyte viability
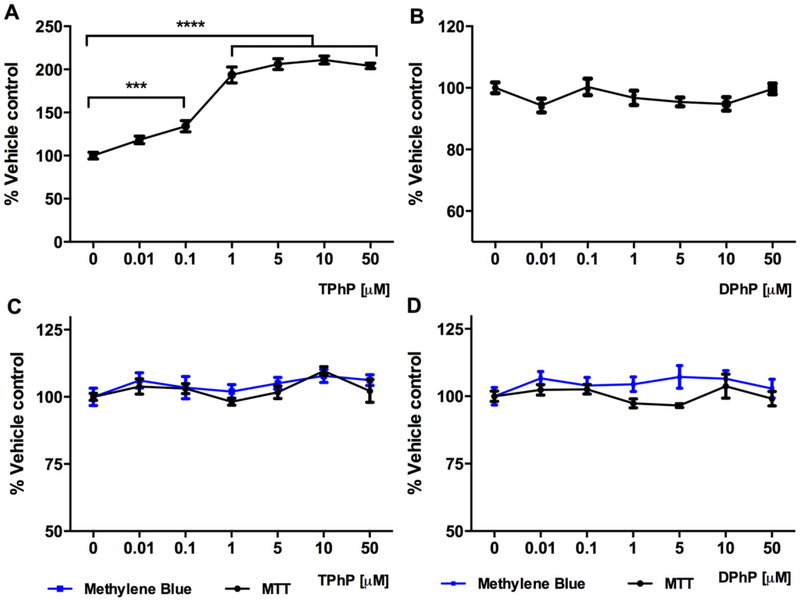
To assess the potential effect of TPhP and DPhP on adipocyte proliferation, the 3T3-L1 pre-adipocytes were seeded at low density (103 cells/well) and exposed to these chemicals for 48 h. The results from the proliferation assay elucidated the significant increase of adipocyte expansion triggered by TPhP even at the low concentration 0.1 μM (Fig. 2A, P < 0.001) while DPhP did not elicit any significant effect (Fig. 2B). To confirm that no effects observed in this study were secondary to adverse effects on cell viability, we evaluated cell viability using two independent methods. The viability of confluent 3T3-L1 pre-adipocytes was not affected neither by TPhP nor DPhP when assessed by either methylene blue or MTT (data not shown). Exposure of differentiated adipocytes to TPhP and DPhP for 48 h did not affect their viability as assessed by either assay (Fig. 2C and D).
Fig. 2.
Effect of TPhP and DPhP on proliferation of pre-adipocytes exposed for 48 h (A and B) and viability of mature 3T3-L1 cells exposed for 48 h (C and D) measured with MTT and methylene blue assays. Statistical analysis was performed using one-way ANOVA followed by a Dunnett’s test to compare the different dose levels of TPhP and DPhP with the respective vehicle control. Results are represented by the mean and the standard error of the mean from three experimental replicates (n = 3). Significance levels are represented with asterisk as following: (***) P < 0.001, (****) P < 0.0001.
3.2. TPhP and DPhP increase adipogenic differentiation
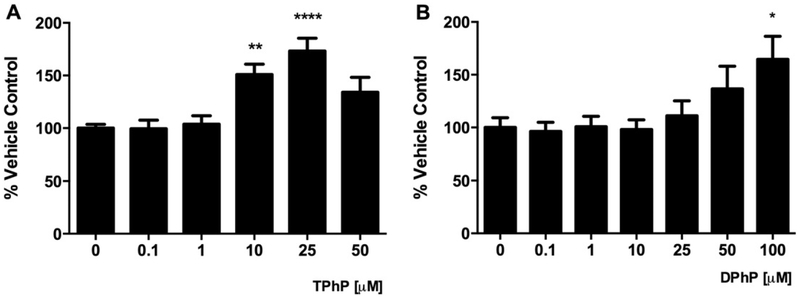
Given the increased adiposity of rats after developmental exposure to TPhP (Green et al. 2016), we sought to evaluate whether TPhP and/or its metabolite DPhP increased the lipid accumulation of differentiating adipocytes. The inclusion of TPhP and DPhP in the modified differentiation cocktail (Fig. 1) significantly increased the neutral lipids accumulated in the droplets quantified by the oil red O assay (Fig. 3). TPhP was more potent than DPhP in this regard.
Fig. 3.
Effect of TPhP (A) and DPhP (B) on adipogenic differentiation of pre-adipocytes 3T3-L1 measured by staining neutral lipids using the oil red O assay. TPhP and DPhP were added to the weak differentiation cocktail during the whole differentiation process. Statistical analysis was performed using one-way ANOVA followed by a Dunnett’s test to compare the different dose levels of TPhP and DPhP with the respective vehicle control. Results are represented by the mean and the standard error of the mean from three experimental replicates (n = 3). Significance levels are represented with asterisk as following: (*) P < 0.05, (**) P < 0.01, (***) P < 0.001.
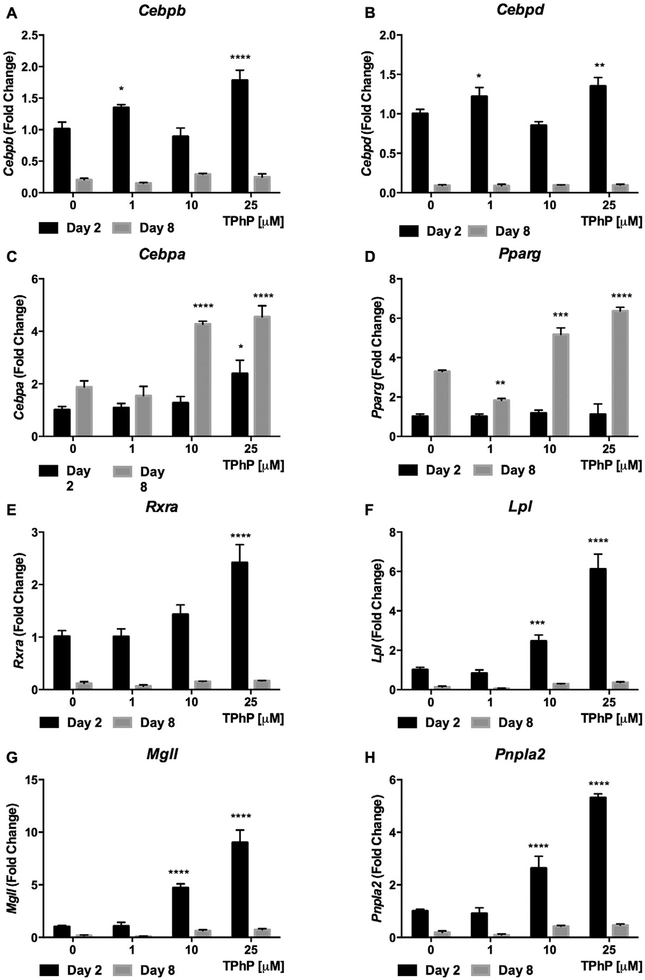
To further explore the mechanism of the TPhP effect on early and late adipocyte differentiation (Janesick and Blumberg 2011), we analyzed the expression of mRNA that are translated into master regulators of adipogenic differentiation. Based on the dynamic time course of the expression of these RNA over differentiation and in light of the increased adipogenic differentiation observed with TPhP exposure, we expected that TPhP would increase Cebpb, Cebpd, and Rxr RNA expression at day 2 of differentiation (Fu et al. 2005) and increase Cebpa and Pparg RNA in late differentiation (Rosen et al. 2002; Rosen and MacDougald 2006). Indeed, exposure to TPhP significantly increased the expression of Cebpb, Cebpd and Rxra RNA at the beginning of differentiation (Day 2, Fig. 4A, B and E, respectively) and of Cebpa and Pparg RNA during late differentiation (Day 8, Fig. 4C and D, respectively).
Fig. 4.
Effect of TPhP on gene expression of master regulators of adipogenic differentiation and lipolysis of 3T3-L1 cells during early and late differentiation. The cells were treated with TPhP (1, 10 and 25 μM) during the full differentiation process. The comparative Ct method (2−ΔΔCt) was used to represent the results as fold change respective to the vehicle control and using Actb as endogenous control. Statistical analysis was performed using Two-way ANOVA with Dunnett’s test to compare the different dose levels of TPhP with the respective vehicle control. Significance levels are represented with asterisk as following: (*) P < 0.05, (**) P < 0.01, (***) P < 0.001, (****) P < 0.0001.
3.3. TPhP enhanced 2-NBDG uptake and GLUT4 translocation
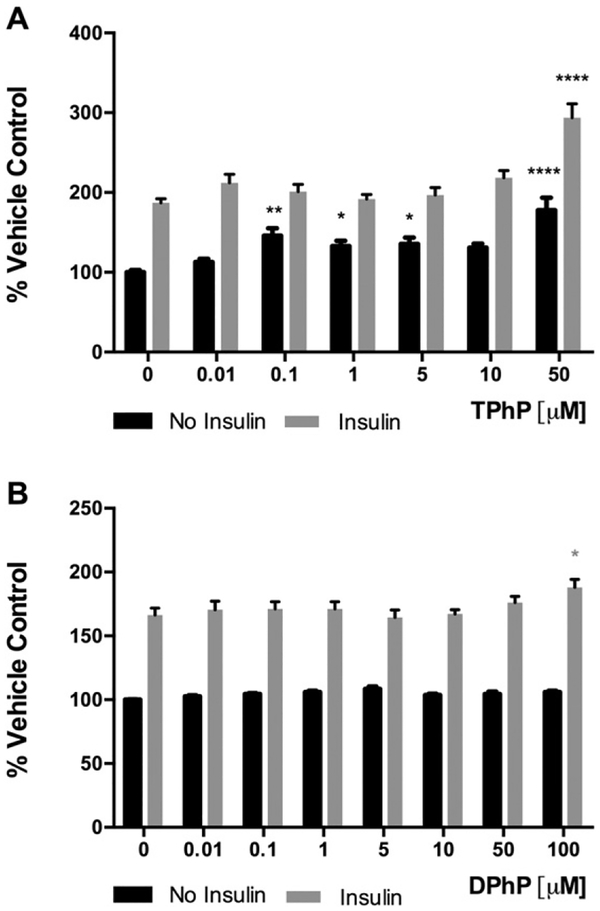
We hypothesized that developmental exposure to TPhP may have accelerated the onset of type 2 diabetes mellitus (T2DM) in weight-matched rats (Green et al. 2016) as a result of an autonomous impairment of adipose tissue glucose uptake. To explore this hypothesis, the fluorescent glucose analog 2-NBDG was used to assess the effect of TPhP and DPhP on basal- and insulin stimulated- glucose uptake of differentiated 3 T3-L1. Most TPhP doses tested increased 2-NBDG uptake without the presence of insulin (Fig. 5A). Insulin-stimulated 2-NBDG uptake was also enhanced by the highest TPhP dose tested, 50 μM (Fig. 5A). DPhP was less potent as it had no effect on basal 2-NBDG up-take and increased the insulin-stimulated 2-NBDG uptake only at 100 μM DPhP (Fig. 5B).
Fig. 5.
Effect of TPhP (A) and DPhP (B) on the fluorescent glucose analog 2-[N (−7-nitrobenz-2-oxa1, 3-diazol-4-yl) amino]-2-deoxy-d-glucose (2-NBDG) uptake by differentiated 3T3-L1 adipocytes in presence or absence of insulin (100 nM). Statistical analysis was performed using two-way ANOVA with Dunnett’s test to compare the different dose levels of TPhP and DPhP with the respective vehicle control. Results are represented by the mean and the standard error of the mean from at least five experimental replicates (n = 5). Pinteraction = 0.007 and 0.09 for TPhP and DPhP respectively. Significance levels are represented with asterisk as following: (*) P < 0.05, (**) P < 0.01, (***) P < 0.001, (****) P < 0.0001.
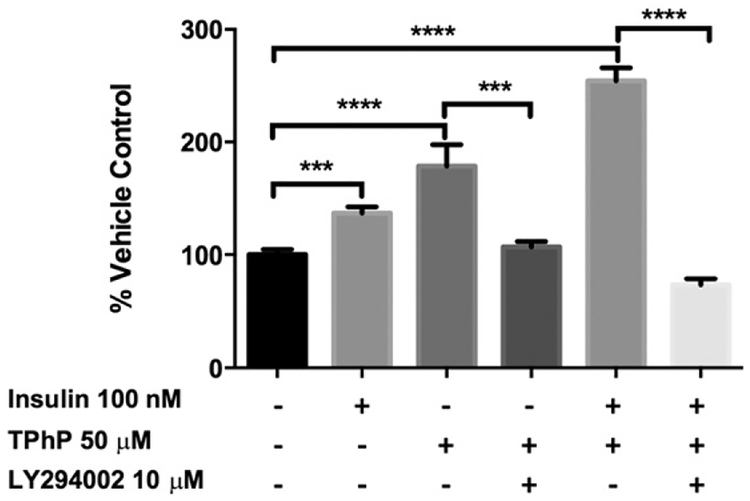
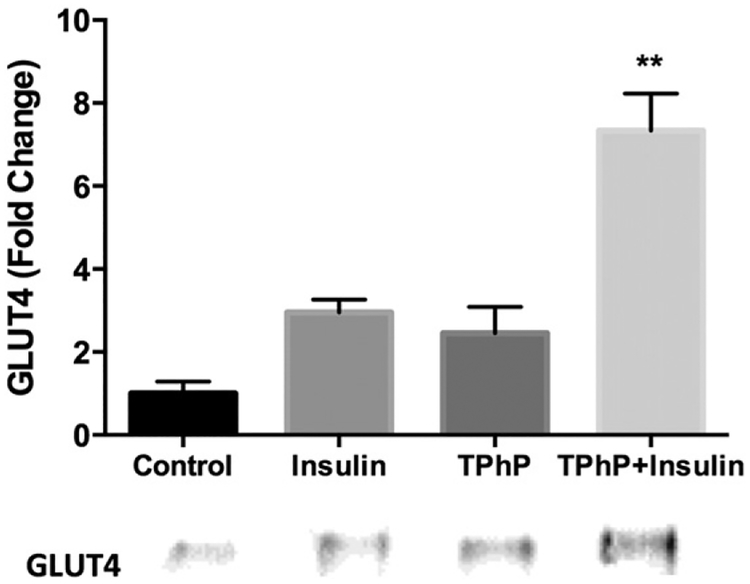
To further assess if the 2-NBDG uptake stimulated by TPhP was mediated by the insulin signaling pathway, mature adipocytes were pre-incubated with an inhibitor of PI3K (LY294002). The TPhP- stimulated uptake of 2-NBDG was completely inhibited by an inhibitor of upstream insulin signaling by PI3K (Fig. 6). Consistent with those findings, short-term TPhP (50 μM) exposure enhanced insulin-stimulated GLUT4 trans-location to the membrane more than six-fold over the control (Fig. 7). Together these observations indicate that TPhP mimics or enhances the effects of insulin signaling on adipocyte glucose uptake.
Fig. 6.
Inhibitory effect of LY294002 on 2-NBDG uptake stimulated by TPhP. Statistical analysis was performed using one-way ANOVA followed by a Dunnett’s test to compare the different dose levels of TPhP with the respective vehicle control. Results are represented by the mean and the standard error of the mean from three experimental replicates (n = 3). Pinteraction = 0.005 for TPhP and insulin. Significance levels are represented with asterisk as following: (**) P < 0.01, (***) P < 0.001, (****) P < 0.0001.
Fig. 7.
GLUT4 translocation in 3T3-L1 cells exposed to vehicle control (DMSO 0.1%), insulin 100 nM, TPhP 50 μM or simultaneous exposure to insulin and TPhP for 15 min. The amounts of GLUT4 are expressed as values relative to those in cells treated with vehicle control. Statistical analysis was performed using two-way ANOVA followed by a Dunnett’s test to compare the different dose levels of TPhP with the respective vehicle control. Results represent means ± SEM, n ± 2 independent experiments. Pinteraction = 0.07. Significance levels are represented with asterisk as following: (**) P < 0.01.
3.4. TPhP and DPhP increase isoproterenol-induced lipolysis
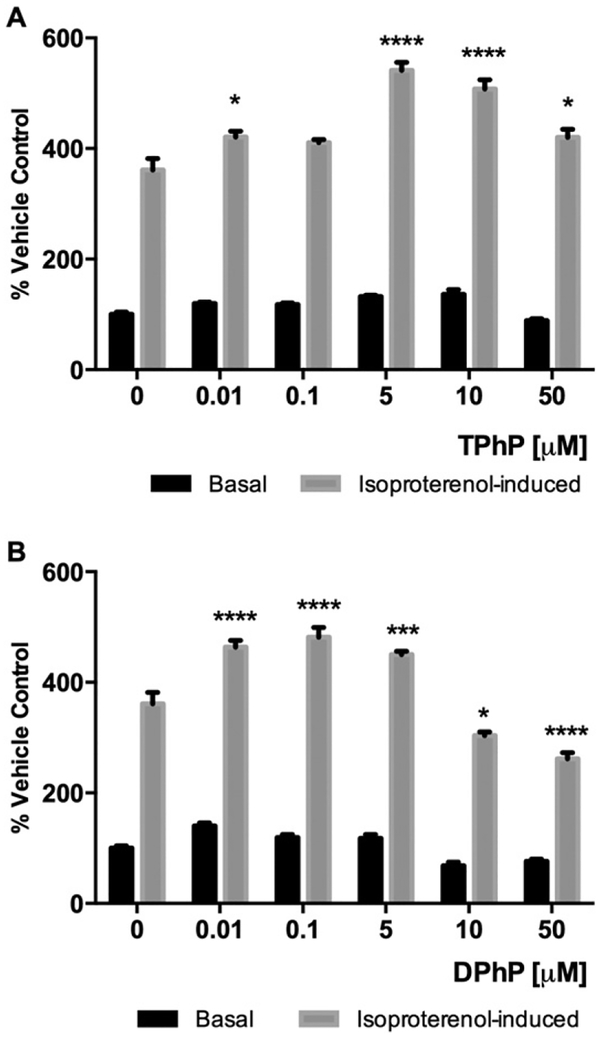
In order to assess the effect of TPhP and DPhP on mature adipocyte lipolysis, intracellular glycerol released into the media was quantitated after 48 h of TPhP or DPhP treatment of differentiated 3T3-L1 cells under basal- and isoproterenol stimulated- conditions. There were no revealed effects of TPhP or DPhP on lipolysis under basal conditions. However, when mature adipocytes treated with either TPhP or DPhP were stimulated with isoproterenol, a significant inverted U concentration effect was observed (Fig. 8A–B).
Fig. 8.
Levels of glycerol released to the media measured after treatment with TPhP or DPhP for 48 h in basal and isoproterenol-induced (2 μM) lipolytic conditions. Statistical analysis was performed using Two-way ANOVA with Dunnett’s test to compare the different dose levels of TPhP and DPhP with the respective vehicle control. Results are represented by the mean and the standard error of the mean from at least three experimental replicates (n = 3). Pinteraction < 0.0001 for both TPhP and DPhP. Significance levels are represented with asterisk as following: (*) P < 0.05, (***) P < 0.001, (****) P < 0.0001.
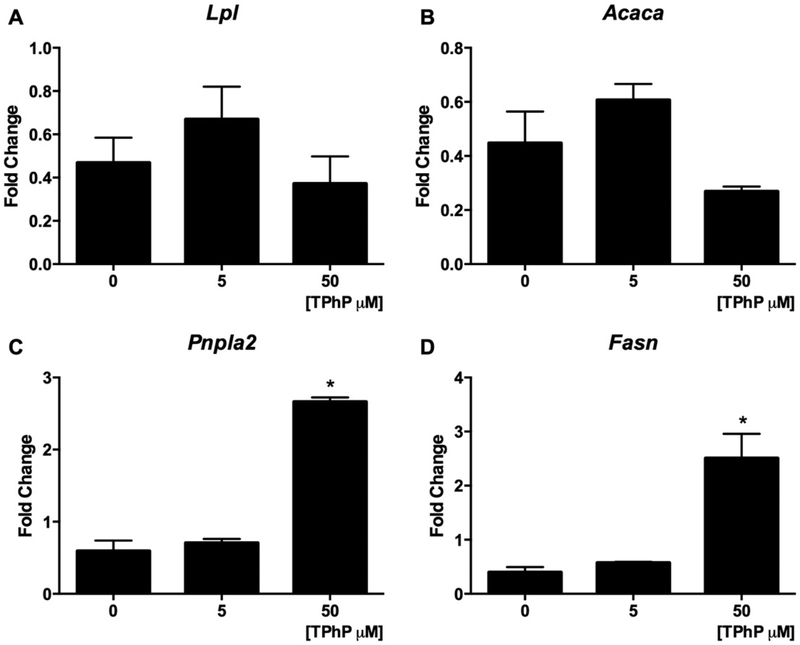
We hypothesized that the increased lipolysis resulting from TPhP exposure resulted from transcriptional changes of master regulators of lipolysis during differentiation and in mature adipocytes. Exposure of cells to TPhP during their adipogenic differentiation significantly increased the expression of genes encoding for the major lipases Lpl, Mgll and Pnpla2 at the beginning of differentiation (Day 2, Fig. 4F–H). Even under basal conditions, the treatment of mature 3T3-L1 cells with TPhP induced modest but significant increases the gene expression of Pnpla2 and Fasn at 50 μM, while mRNA levels of Acaca or Lpl were not modified (Fig. 9 A–D).
Fig. 9.
Effect of TPhP on gene expression of regulators of lipid metabolism of 3T3-L1 cells. The mature adipocytes were treated with TPhP (0, 5 and 50 μM) for 48 h. The comparative Ct method (2−ΔΔCt) was used to represent the results as fold change respective to the vehicle control and using the β-actin as endogenous control. Statistical analysis was performed using one-way ANOVA followed by a Dunnet’s test to compare the different dose levels of TPhP with the respective vehicle control. Results are represented by the mean and the standard error of the mean from three experimental replicates (n = 3). Significance levels are represented with asterisk as following: (*) P < 0.05.
4. Discussion
The present study provides evidence of the capacity of TPhP to induce the proliferation of pre-adipocyte fibroblasts and enhance their differentiation into adipocytes. These TPhP effects were supported by upregulation of RNA that controls adipogenic differentiation. We also provide several lines of evidence that nM range of TPhP exposure interacts with insulin and noradrenergic signaling by increasing glucose uptake and isoproterenol-induced lipolysis, respectively. The potency of DPhP on the proliferation and differentiation of pre-adipocytes and on 2-NBDG uptake by adipocytes was milder than TPhP, yet both phosphates enhanced isoproterenol-induced lipolysis at similar concentrations.
The results suggest that TPhP upregulates the whole adipocyte differentiation program and increases lipid abundance in mature adipocytes. These obesogenic effects of TPhP are in agreement with the increased adiposity observed among adult rats with perinatal TPhP exposure (Green et al. 2016). Both the obesogenic TPhP effects and the increased transcriptional expression of the master regulators of adipogenesis by TPhP are consistent with the PPARγ agonistic activity of TPhP identified in C57BL/6 mouse–derived bone marrow stromal cells BMS2 and a Cos7 reporter assay of PPARγ (Pillai et al. 2014). PPARγ agonists such as the anti-diabetic thiazolidinedione drug class (Amato and de Assis Rocha Neves 2012) and other obesogenic pollutants such as tributyltin (TBT) (Pagliarani et al. 2013) also increase adiposity and adipogenesis.
The insulin-sensitizing effects of the highest tested (μM) doses of TPhP and DPhP are consistent with the antidiabetic effect of PPARγ agonists (Saraf et al. 2012). Further, the effects of the majority of TPhP (nM) doses tested were similar to those of the PPARγ agonist TBT in that both TPhP and TBT enhanced the basal glucose uptake of 3T3-L1 adipocytes (Regnier et al. 2015). However this effect may be independent of PPARγ agonism given it was not reproduced by a thiazolidinedione (Regnier et al. 2015) and given TPhP stimulated glucose uptake through canonical insulin signaling despite the absence of insulin.
As is routinely observed with insulin resistance in T2DM and obesity (Qatanani and Lazar 2007; Saltiel and Kahn 2001), elevated noradrenergic lipolysis was stimulated in 3T3-L1 cells treated with either TPhP or DPhP. Both phosphates may prime the cells for greater lipid catabolism by enhancing basal expression of RNA that encode lipolytic proteins to allow for later over-amplification of noradrenergic stimulation. Such stimulation could explain the elevated free fatty acids observed in diabetic rats exposed to TPhP (Green et al. 2016), either through direct sympathetic innervation of white adipose or secondary to activity of the hypothalamic-pituitary-adrenal axis. Although evidence for TPhP enhancement of lipolysis and lipogenesis may seem contradictory, simultaneous lipogenesis and lipolysis has also been reported with other PPARγ agonists in adipocytes (Festuccia et al. 2006). However, the equipotency of DPhP and TPhP in stimulating noradrenergic lipolysis, despite that DPhP was less potent than TPhP with respect to adipo-genesis and glucose uptake, raises the possibility that these phosphates do not have complete mechanistic overlap in their metabolic toxicities.
Prior risk assessment considering traditional toxicological endpoints indicated that TPhP has low human health hazard potential (OECD 2002). Since then, the public health benefits of TPhP as a substitute for PBDE flame retardants has become questionable. Accordingly, the noradrenergic and endocrine disruption of adipocytes contribute to a growing list of adverse health effects, including reproductive dysfunctions, neurotoxicity and cardiotoxicity (Andresen et al. 2004; McGee et al. 2013; Meeker and Stapleton 2010; Meeker et al. 2013). Although human exposure assessment has not yet been extensive, the excretion of DPhP in human urine collected from California (62% detected, mean 27.2 nM), Massachusetts (96% detected, mean 39.2 nM), Belgium (93% detected, max 52 nM), and Germany (30% detected, mean 16.4 nM) and the concentration of TPhP collected in human plasma from Georgia USA (detected in nM range, median 22 nM), indicates that exposure to TPhP is prevalent and widespread (Dodson et al. 2014; Meeker et al. 2013). Given these human exposure levels, it is concerning that we were unable to establish a TPhP or DPhP level for no observed adverse effect on adipocyte lipolysis when testing as low as 10 nM.
5. Conclusions
This is the first study aiming to characterize the effect of TPhP and it major metabolite DPhP on adipogenic differentiation, glucose uptake, and lipolysis using the 3T3-L1 model. The results confirmed the obesogenic effects of TPhP by increasing the proliferation of pre-adipocytes and their adipogenic differentiation. The mechanism underlying the increased adipogenesis and insulin stimulated- glucose uptake was consistent with PPARγ agonism by TPhP. Our results indicate TPhP increased basal glucose uptake by mimicking the insulin signaling pathway. Both TPhP and DPhP also enhanced lipolysis induced by the β- adrenergic agonist isoproterenol, which appeared to result from increased basal expression of lipolytic genes during and after differentiation. The whole of data provide evidence that both the flame-retardant compound TPhP and its metabolite DPhP act as endocrine disruptors on the regulation of adipogenic differentiation and lipolysis by perturbing noradrenergic mechanisms and, in the case of TPhP, also by mimicking the insulin signaling pathway and stimulating glucose uptake.
Supplementary Material
Acknowledgements
This work is supported by the Office of Environmental Health Hazard Assessment award 13-E0014–1, and National Institutes of Health (ES023513).
Abbreviations:
- Acaca
Acetyl-coenzyme A carboxylase alpha
- ATGL
Adipose tissue triglyceride lipase
- BM1
basal media 1
- BM2
basal media 2
- Cebpa
CCAAT/enhancer binding protein alpha
- Cebpb
CCAAT/enhancer binding protein beta
- Cebpd
CCAAT/enhancer binding protein delta
- DMSO
dimethyl sulfoxide
- DPhP
diphenyl phosphate
- DMEM
Dulbecco’s modified Eagle Medium
- EDCs
endocrine disrupting chemicals
- Fasn
fatty acid synthase
- FBS
fetal bovine serum
- GLUT4
glucose transporter type 4
- IBMX
3-isobutyl-1-methylxanthine
- Lpl
lipoprotein lipase
- Mgll
monoglyceride lipase
- MTT
3-(4-5-dimethylthiazol-2-yl)-2,5-diphenyl tetrazolium
- NEFAs
non-esterified fatty acids
- NCS
newborn calf serum
- PAGE
polyacrylamide gel electrophoresis
- PBDE
polybrominated diphenyl ether
- PBS
phosphate buffered saline
- PI3K
phosphoinositide 3-kinase
- Pnpla2
patatin-like phospholipase domain containing 2
- Pparg
peroxisome proliferator-activated receptor gamma
- Rxra
retinoid X receptor alpha
- TPhP
triphenyl phosphate
- T2DM
type 2 diabetes mellitus
- 2-NBDG
2-[N (−7-nitrobenz-2-oxa1, 3-diazol-4-yl) amino]-2-deoxy-d-glucose
Footnotes
Supplementary data to this article can be found online at http://dx.doi.org/10.1016/j.tiv.2017.01.021.
Transparency document
The Transparency document associated with this article can be found, in online version.
References
- Amato AA, de Assis Rocha Neves F, 2012. Idealized ppargamma-based therapies: lessons from bench and bedside. PPAR Res 2012, 978–987. [DOI] [PMC free article] [PubMed] [Google Scholar]
- Andresen JA, Grundmann A, Bester K, 2004. Organophosphorus flame retardants and plasticisers in surface waters. Sci. Total Environ 332, 155–166. [DOI] [PubMed] [Google Scholar]
- Belcher SM, Cookman CJ, Patisaul HB, Stapleton HM, 2014. in vitro assessment of human nuclear hormone receptor activity and cytotoxicity of the flame retardant mixture fm 550 and its triarylphosphate and brominated components. Toxicol. Lett 228, 93–102. [DOI] [PMC free article] [PubMed] [Google Scholar]
- Cooper EM, Covaci A, van Nuijs AL, Webster TF, Stapleton HM, 2011. Analysis of the flame retardant metabolites bis(1,3-dichloro-2-propyl) phosphate (bdcpp) and diphenyl phosphate (dpp) in urine using liquid chromatography-tandem mass spec-trometry. Anal. Bioanal. Chem 401, 2123–2132. [DOI] [PMC free article] [PubMed] [Google Scholar]
- Dodson RE, Perovich LJ, Covaci A, Van den Eede N, Ionas AC, Dirtu AC, et al. , 2012. After the pbde phase-out: a broad suite of flame retardants in repeat house dust samples from California. Environ. Sci. Technol 46, 13056–13066. [DOI] [PMC free article] [PubMed] [Google Scholar]
- Dodson RE, Van den Eede N, Covaci A, Perovich LJ, Brody JG, Rudel RA, 2014. Uri-nary biomonitoring of phosphate flame retardants: levels in California adults and recommendations for future studies. Environ. Sci. Technol 48, 13625–13633. [DOI] [PMC free article] [PubMed] [Google Scholar]
- Felice DL, Sun J, Liu RH, 2009. A modified methylene blue assay for accurate cell counting. J. Funct. Foods 1, 109–118. [Google Scholar]
- Festuccia WT, Laplante M, Berthiaume M, Gelinas Y, Deshaies Y, 2006. Ppargamma agonism increases rat adipose tissue lipolysis, expression of glyceride lipases, and the response of lipolysis to hormonal control. Diabetologia 49, 2427–2436. [DOI] [PubMed] [Google Scholar]
- Fu M, Sun T, Bookout AL, Downes M, Yu RT, Evans RM, et al. , 2005. A nuclear receptor atlas: 3t3-l1 adipogenesis. Mol. Endocrinol. (Baltimore, Md) 19, 2437–2450. [DOI] [PubMed] [Google Scholar]
- Gore AC, Chappell VA, Fenton SE, Flaws JA, Nadal A, Prins GS, et al. , 2015. Edc-2: the endocrine society’s second scientific statement on endocrine-disrupting chemicals. Endocr. Rev 36, E1–e150. [DOI] [PMC free article] [PubMed] [Google Scholar]
- Green H, Kehinde O, 1975. An established preadipose cell line and its differentiation in culture. II. Factors affecting the adipose conversion. Cell 5, 19–27. [DOI] [PubMed] [Google Scholar]
- Green AJ, Graham JL, Gonzalez EA, La Frano MR, Petropoulou SE, Park JS, et al. , 2016. Perinatal Triphenyl Phosphate Exposure Accelerates Type 2 Diabetes Onset and Increases Adipose Accumulation in ucd-type 2 Diabetes Mellitus Rats. Reproductive Toxicology. Elmsford, NY [DOI] [PMC free article] [PubMed] [Google Scholar]
- Grun F, Blumberg B, 2006. Environmental obesogens: organotins and endocrine disruption via nuclear receptor signaling. Endocrinology 147, S50–S55. [DOI] [PubMed] [Google Scholar]
- Hwang JT, Kim SH, Lee MS, Kim SH, Yang HJ, Kim MJ, et al. , 2007. Anti-obesity effects of ginsenoside rh2 are associated with the activation of ampk signaling pathway in 3t3-l1 adipocyte. Biochem. Biophys. Res. Commun 364, 1002–1008. [DOI] [PubMed] [Google Scholar]
- Janesick A, Blumberg B, 2011. Minireview: ppargamma as the target of obesogens. J. Steroid Biochem. Mol. Biol 127, 4–8. [DOI] [PMC free article] [PubMed] [Google Scholar]
- Kaur J, Bachhawat AK, 2009. A modified western blot protocol for enhanced sensitivity in the detection of a membrane protein. Anal. Biochem 384, 348–349. [DOI] [PubMed] [Google Scholar]
- La Merrill M, Birnbaum LS, 2011. Childhood obesity and environmental chemicals. Mt. Sinai J. Med., New York 78, 22–48. [DOI] [PMC free article] [PubMed] [Google Scholar]
- Livak KJ, Schmittgen TD, 2001. Analysis of relative gene expression data using real-time quantitative pcr and the 2(−delta delta c(t)) method. Methods (San Diego, Calif) 25, 402–408. [DOI] [PubMed] [Google Scholar]
- McGee SP, Konstantinov A, Stapleton HM, Volz DC, 2013. Aryl phosphate esters within a major pentabde replacement product induce cardiotoxicity in developing zebrafish embryos: potential role of the aryl hydrocarbon receptor. Toxicol. Sci 133, 144–156. [DOI] [PubMed] [Google Scholar]
- Meeker JD, Stapleton HM, 2010. House dust concentrations of organophosphate flame retardants in relation to hormone levels and semen quality parameters. Environ. Health Perspect 118, 318–323. [DOI] [PMC free article] [PubMed] [Google Scholar]
- Meeker JD, Cooper EM, Stapleton HM, Hauser R, 2013. Urinary metabolites of organ-ophosphate flame retardants: temporal variability and correlations with house dust concentrations. Environ. Health Perspect 121, 580–585. [DOI] [PMC free article] [PubMed] [Google Scholar]
- Mendelsohn E, Hagopian A, Hoffman K, Butt CM, Lorenzo A, Congleton J, et al. , 2016. Nail polish as a source of exposure to triphenyl phosphate. Environ. Int 86, 45–51. [DOI] [PMC free article] [PubMed] [Google Scholar]
- NCD-RisC, 2016. Trends in adult body-mass index in 200 countries from 1975 to 2014: a pooled analysis of 1698 population-based measurement studies with 19.2 million participants. Lancet (London, England) 387, 1377–1396. [DOI] [PMC free article] [PubMed] [Google Scholar]
- OECD. 2002. Sids Initial Assessment Report: Triphenyl Phosphate Paris, France. [Google Scholar]
- Ogden CL, Carroll MD, Kit BK, Flegal KM, 2014. Prevalence of childhood and adult obesity in the United States, 2011–2012. JAMA 311, 806–814. [DOI] [PMC free article] [PubMed] [Google Scholar]
- Pagliarani A, Nesci S, Ventrella V, 2013. Toxicity of organotin compounds: shared and unshared biochemical targets and mechanisms in animal cells. Toxicol. in vitro 27, 978–990. [DOI] [PubMed] [Google Scholar]
- Patisaul HB, Roberts SC, Mabrey N, McCaffrey KA, Gear RB, Braun J, et al. , 2013. Accumulation and endocrine disrupting effects of the flame retardant mixture firemaster(r) 550 in rats: an exploratory assessment. J. Biochem. Mol. Toxicol 27, 124–136. [DOI] [PMC free article] [PubMed] [Google Scholar]
- Pereira-Fernandes A, Vanparys C, Hectors TL, Vergauwen L, Knapen D, Jorens PG, et al. , 2013. Unraveling the mode of action of an obesogen: mechanistic analysis of the model obesogen tributyltin in the 3t3-l1 cell line. Mol. Cell. Endocrinol 370, 52–64. [DOI] [PubMed] [Google Scholar]
- Pereira-Fernandes A, Vanparys C, Vergauwen L, Knapen D, Jorens PG, Blust R, 2014. Toxicogenomics in the 3t3-l1 cell line, a new approach for screening of obesogenic compounds. Toxicol. Sci 140, 352–363. [DOI] [PubMed] [Google Scholar]
- Phuchareon J, McCormick F, Eisele DW, Tetsu O, 2015. EGFR inhibition evokes innate drug resistance in lung cancer cells by preventing Akt activity and thus inactivating Ets-1 function. Proc. Natl. Acad. Sci 112, E3855–E3863. [DOI] [PMC free article] [PubMed] [Google Scholar]
- Pillai HK, Fang M, Beglov D, Kozakov D, Vajda S, Stapleton HM, et al. , 2014. Ligand binding and activation of ppargamma by firemaster(r) 550: effects on adipogenesis and osteogenesis in vitro. Environ. Health Perspect 122, 1225–1232. [DOI] [PMC free article] [PubMed] [Google Scholar]
- Qatanani M, Lazar MA, 2007. Mechanisms of obesity-associated insulin resistance: many choices on the menu. Genes Dev 21, 1443–1455. [DOI] [PubMed] [Google Scholar]
- Qi L, Cho YA, 2008. Gene-environment interaction and obesity. Nutr. Rev 66, 684–694. [DOI] [PMC free article] [PubMed] [Google Scholar]
- Regnier SM, El-Hashani E, Kamau W, Zhang X, Massad NL, Sargis RM, 2015. Tributyltin differentially promotes development of a phenotypically distinct adipocyte. Obesity (Silver Spring, Md) 23, 1864–1871. [DOI] [PMC free article] [PubMed] [Google Scholar]
- Rosen ED, MacDougald OA, 2006. Adipocyte differentiation from the inside out. Nat. Rev. Mol. Cell Biol 7, 885–896. [DOI] [PubMed] [Google Scholar]
- Rosen ED, Hsu CH, Wang X, Sakai S, Freeman MW, Gonzalez FJ, et al. , 2002. C/ebpalpha induces adipogenesis through ppargamma: a unified pathway. Genes Dev 16, 22–26. [DOI] [PMC free article] [PubMed] [Google Scholar]
- Saltiel AR, Kahn CR, 2001. Insulin signalling and the regulation of glucose and lipid metabolism. Nature 414, 799–806. [DOI] [PubMed] [Google Scholar]
- Saraf N, Sharma PK, Mondal SC, Garg VK, Singh AK, 2012. Role of pparg2 transcription factor in thiazolidinedione-induced insulin sensitization. J. Pharm. Pharmacol 64, 161–171. [DOI] [PubMed] [Google Scholar]
- Silventoinen K, Jelenkovic A, Sund R, Hur YM, Yokoyama Y, Honda C, et al. , 2016. Genetic and environmental effects on body mass index from infancy to the onset of adulthood: an individual-based pooled analysis of 45 twin cohorts participating in the collaborative project of development of anthropometrical measures in twins (codatwins) study. Am. J. Clin. Nutr 104, 371–379. [DOI] [PMC free article] [PubMed] [Google Scholar]
- Su G, Crump D, Letcher RJ, Kennedy SW, 2014. Rapid in vitro metabolism of the flame retardant triphenyl phosphate and effects on cytotoxicity and mrna expression in chicken embryonic hepatocytes. Environ. Sci. Technol 48, 13511–13519. [DOI] [PubMed] [Google Scholar]
- van der Veen I, de Boer J, 2012. Phosphorus flame retardants: properties, production, environmental occurrence, toxicity and analysis. Chemosphere 88, 1119–1153. [DOI] [PubMed] [Google Scholar]
- Vishwanath D, Srinivasan H, Patil MS, Seetarama S, Agrawal SK, Dixit MN, et al. , 2013. Novel method to differentiate 3t3 l1 cells in vitro to produce highly sensitive adipocytes for a glut4 mediated glucose uptake using fluorescent glucose analog. J. Cell Commun. Signal 7, 129–140. [DOI] [PMC free article] [PubMed] [Google Scholar]
- WHO, 2014. Global Status Report on Noncommunicable Diseases 2014 Geneva, Switzerland. [Google Scholar]
- Zebisch K, Voigt V, Wabitsch M, Brandsch M, 2012. Protocol for effective differentiation of 3t3-l1 cells to adipocytes. Anal. Biochem 425, 88–90. [DOI] [PubMed] [Google Scholar]
- Zoeller RT, Brown TR, Doan LL, Gore AC, Skakkebaek NE, Soto AM, et al. , 2012. Endocrine-disrupting chemicals and public health protection: a statement of principles from the endocrine society. Endocrinology 153, 4097–4110. [DOI] [PMC free article] [PubMed] [Google Scholar]
Associated Data
This section collects any data citations, data availability statements, or supplementary materials included in this article.


