

Abstract
Scope:
Persistent reduction in Glomerular Filtration Rate (GFR) is a hallmark of Chronic Kidney Disease (CKD) and is associated with an elevation of Blood Urea Nitrogen (BUN). This metabolomics pilot study sought to identify metabolites that differentiated patients with CKD whose BUN decreased on a probiotic and possible mechanisms.
Methods and Results:
Metabolomics was used to analyze baseline plasma samples previously diagnosed with CKD Stage III-IV. Patients had participated in a dose escalation study of the probiotic Renadyl™. A total of 24 samples were categorized depending on whether BUN increased or decreased from baseline after 4 months of probiotic use. Multivariate analysis was used to analyze the data and determine the metabolites that best differentiated the phenotypic groups. The sixteen patients who had a decrease in BUN were not significantly different based on demographic and clinical measures from those whose BUN increased or did not change with the exception of age. Eleven of the fourteen metabolites that differentiated the groups were known to be modulated by gut microflora, which may eventually provide a mechanistic link between probiotic and outcomes.
Conclusions:
Metabolomics revealed metabolites at baseline that may predict individuals with CKD that would most benefit from a probiotics.
Keywords: BUN, chronic kidney disease, microbial metabolism, multivariate analysis, NMR metabolomics, probiotics
INTRODUCTION
Chronic Kidney Disease (CKD) has become the 9th leading cause of death in the United States (Johnson, Hayes et al. 2014). More than 20 million people, aged 20 years or older in the United States have CKD (Shahinian, Hedgeman et al. 2013). The population of people with far advanced CKD, also called End Stage Renal Disease (ESRD), on dialysis in 2013 was 661,648 (Saran, Li et al. 2015). Most recently, it has been suggested that the prevalence of CKD in adults will increase to 14.4% by 2020 and 16.7% by 2030 (Hoerger, Simpson et al. 2015). Earlier detection and awareness by providers and the associations of CKD with advanced age, diabetes, hypertension, cardiovascular disease and obesity (Tanner, Brown et al. 2012) have all been suggested to explain the changing incidence of CKD worldwide. Providing renal replacement therapies such as dialysis to patients with ESRD is lifesaving but is very expensive and challenging. New treatment approaches capable of preventing or delaying progression to ESRD would not only reduce these costs, but improve patient quality of life.
CKD is usually identified in the clinic with an elevation of Blood Urea Nitrogen (BUN) or serum creatinine and is defined as a reduction in Glomerular Filtration Rate (GFR) of < 60 ml/min/1.732 BSA for 3 months or more. This definition includes only its filtering ability and omits other kidney functions such as endocrine and tubular secretory functions which might also change as the kidney begins to lose its filtering capacity. The metabolome could reflect changes in each of these functions; however, the interaction between kidney pathophysiology and the metabolome is not fully investigated (Rhee 2015). Recently, metabolomics has been used to examine changes in metabolite profiles in patients with AKI before and after Ischemia/Reperfusion (Wei, Xiao et al. 2014) and applied to identify metabolites that would predict the kidney rejection after transplantation in children (Blydt-Hansen, Sharma et al. 2014). These findings have begun to provide biomarkers and mechanistic insights into early disease pathogenesis.
The intestinal epithelial barrier facilitates cross-talk between the gut microbiome and kidney (Ramezani and Raj 2014). Nutrients and other exogenous materials are processed by the gut microbiome and enter the bloodstream through this barrier, and conversely components of the blood not removed by the kidney can enter the intestinal lumen and influence the health and composition of the microbiome. Progression of CKD is, for example, associated with increased microbial counts in both the duodenum and jejunum (Strid, Simren et al. 2003) and low levels of lactobacilli, bifidobacteria, and prevotellacae (Gibson and Roberfroid 1995, Schepers, Glorieux et al. 2010, Vaziri, Yuan et al. 2013). A rise in luminal concentrations of urea (Kang 1993) and uric acid (Vaziri, Freel et al. 1995), among other metabolites (Meinardi, Jin et al. 2013), are thought to contribute to this shift in population, while production of uremic toxins such as indoxyl sulfate (Meijers and Evenepoel 2011), p-cresol sulfate (Liabeuf, Barreto et al. 2010) and TMAO (Tang, Wang et al. 2015) by colonic bacteria likely exacerbate CKD progression. End products of intestinal fermentation acetate, proprionate and butyrate, as well as probiotic treatment with acetate-producing bacteria, were recently demonstrated to protect the kidney in a model of ischemia reperfusion injury (Andrade-Oliveira, Amano et al. 2015). Prebiotics can also reduce production of uremic toxins and increase fermentation in the colon (Sirich, Plummer et al. 2014). By targeting treatments to the gut microflora, the opportunity exists to simultaneously improve gut function and remove circulating uremic toxins that influence progression of CKD.
Using BUN as a phenotypic marker of disease status, this exploratory study focused on understanding biomarkers and biochemical pathways involved in probiotic response in CKD Stage III-IV patients.
MATERIALS & METHODS
Subjects
The open label study of a probiotic supplement called Renadyl™ has been described previously (Ranganathan, Pechenyak et al. 2013). Briefly, all subjects were age 18–75 years old, previously diagnosed with CKD Stage III–IV or had a serum creatinine > 2.5 mg/dL, were pre-ESRD, and stable at least one year. Details of inclusion and exclusion criteria are outlined in the clinical trial sponsored by Kibow Biotech (KB) at Thomas Jefferson University (TJU), Philadelphia, PA, in 2011–2012 (www.clinicaltrials.gov #NCT01450657).
Protocol
Samples submitted to NIH repository represented plasma samples from 27 patients who completed the trial. Study participants were given Renadyl™ (Kibow Biotech, Inc.), which contained 30 billion Colony Forming Units (CFU) of S. thermophilus KB 19, L. acidophilus KB 27, and B. longum KB 31 strains per enteric coated vegetarian gel capsule over a 4 month period. In month one, participants received 90 billion CFU per day. At each month after baseline, participants had blood drawn for hematology and biochemical testing and the dose of the probiotics was escalated by 90 billion CFU to a maximum of 270 CFU. This design aimed to confirm dose safety and tolerability and demonstrate measurable improvement in biochemical markers.
Baseline plasma samples from 27 of the 28 subjects who completed the trial were selected for metabolomics analysis. Two plasma samples were excluded due to poor water suppression during NMR data acquisition, and one was excluded from the analysis due to missing BUN measurements.
Metabolomics Analysis
Sample preparation, data acquisition, statistics, and pathway analysis were performed similarly as previously described (Beckonert, Keun et al. 2007). Each plasma sample (350 μL) was prepared by addition of a 0.9% saline solution containing 0.2% NaN3 and 2 mM formate (chemical shift indicator) in D2O. In addition, 50 μL of each plasma samples was pooled, mixed, divided into 3 aliquots, and prepared identically to the individual study samples. Metabolomics data were acquired for each individual study and pooled samples. 1H NMR spectra were acquired on a Bruker Advance III 700 MHz NMR spectrometer (located at the David H. Murdock Research Institute at Kannapolis, NC, USA) using the 1D CPMG pulse sequence (cpmgpr1d). NMR spectra were pre-processed using ACD 1D NMR Processor 12.0 (ACD Labs, Toronto, CA). NMR bins (0.50–8.00 ppm) were made after excluding water (4.58–4.93 ppm) using intelligent binning width of 0.04 ppm and 50% looseness factor. Integrals of each of the bins were normalized to total integral of each of the spectrum.
Normalized binned NMR data were Pareto scaled and centered prior to multivariate analysis. Multivariate data analysis methods (e.g. principal component analysis [PCA], orthogonal partial least squares discriminant analysis [OPLS-DA]) were used to reduce the dimensionality and to enable the visualization of the separation of the study groups (SIMCA 13, Umetrics, Umeå, Sweden). The PCA scores plots were inspected to ensure that the pooled samples were tightly clustered in the center of all of the individual study samples, a quality control method that is widely used in metabolites studies (Chan, Pasikanti et al. 2011). Loadings plots and variable importance for projections (VIP) plots were inspected, and bins that had a VIP ≥ 1.0 with a jackknife confidence interval that did not include 0 were determined to be important to differentiating the study groups. Chenomx NMR Suite 8.1 Professional software (Edmonton, Alberta, Canada) was used to match the signals in the identified bins to metabolites. All raw and processed analytical data and associated de-identified metadata have been uploaded to the publically accessible NIH Common Fund Metabolomics Data Repository (http://dx.doi.org/10.21228/M8FW2N).
Statistical Analyses
Statistical analyses were conducted using SAS 9.4 (SAS Institute Inc, Cary, NC). Normality was not assumed due to the small sample size; therefore, descriptive statistics for continuous variables are based on the median value of the sample distribution. Statistical tests for determining whether the median percent change was different from zero for the clinical data across all subjects was conducted using the two-sided Wilcoxon Signed Rank Test. Differences in continuous measurements of subject characteristics, clinical data, and binned NMR data by phenotypic group were tested for statistical significance using the two-sided Wilcoxon Rank Sum Test, and categorical subject characteristics by phenotypic group were tested using the two-sided Fisher’s Exact Test. P-values < 0.05 were considered to be statistically significant.
Identification of BUN as phenotypic anchor
The Wilcoxon Signed Rank Test that was used to determine whether the median percent change of the clinical data across all study samples was statistically different from zero. As shown in Table 1, percent change in BUN was statistically different from 0 (p=0.02) while systolic blood pressure, diastolic blood pressure creatinine, CRP, hemoglobin, and potassium were not statistically different from zero.
Table 1.
Percent change of clinical data across all study samples.
| Clinical Measurement*† | All Study Samples (n=24) | p-value** |
|---|---|---|
| BUN % Change | −10.4(16.0) | 0.02 |
| Systolic Blood Pressure % Change | 0.0(13.6) | 0.58 |
| Diastolic Blood Pressure % Change | 2.8 (24.0) | 0.13 |
| Creatinine % Change | −1.7(10.8) | 0.70 |
| CRP % Change | 0.0 (25.0) | 0.78 |
| Hemoglobin % Change | 0.5(10.7) | 0.26 |
| Potassium % Change | −2.6(11.1) | 0.23 |
Values reported are the median (IQR).
Two missing values for CRP percent change and one missing value for Potassium percent change.
Wilcoxon Signed Rank Test.
% Change calculation: (Month 4 – Baseline)/Baseline * 100.
For the metabolomics analysis, subjects were divided into two phenotypic groups based on the change in BUN measurements over 4 months: BUN measurement decreased at 4 months compared to baseline (Decreased BUN) and BUN measurement did not decrease over the 4 month period (Increased BUN).
RESULTS
Twenty-seven plasma samples were selected for metabolomics analysis from a previously reported dose escalation study of the probiotic Renadyl™ (Ranganathan, Pechenyak et al. 2013). Of these three were excluded and the remainder were stratified by change in BUN over four months of supplementation. Sixteen subjects had a decrease in BUN at the end of the 4-month trial, and BUN for the remaining 8 subjects was at or above the baseline level. Figure 1 shows the distribution of BUN at baseline, month 4, and the percentage of change as well as the distribution of age. The study population is described in Table 2. Age was statistically different between the two groups (p=0.045). There were no statistical differences for BMI, gender, race/ethnicity, diagnosis of diabetes, diagnosis of hypertension, and CKD stage. The clinical data at baseline, month 4, and the percentage change during the trial is described in Table 3. There was a statistical difference for BUN at baseline (p=0.03) with median BUN of 58.5 mg/dL (IQR=31.0) for the decreased BUN group and 36.5 mg/dL (IQR=17.0) for the increased BUN group. At the 4-month visit the median BUN had decreased to 48.5 mg/dL (IQR=20.0) for the decreased BUN group and increased to 43.5 mg/dL (IQR=11.0) for the increased BUN group so that there was no longer a statistical difference between the two groups (p=0.49). There was a significant difference in the percentage change of BUN (p=0.0007) with the decreased BUN group having a median change −12.5% (IQR=7.8) and the increased BUN group having a median change of 3.3% (IQR=25.7). There were no statistical differences for systolic blood pressure, diastolic blood pressure, creatinine, CRP, hemoglobin, and potassium at measured at baseline and month 4 as well as no statistical differences for the percent change in measurements between month 4 and baseline.
Figure 1.
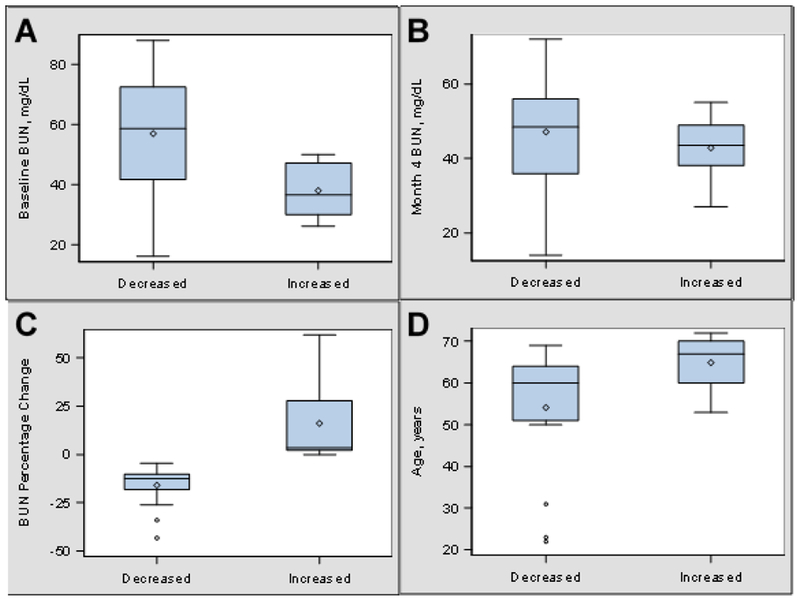
Distribution of BUN and Age by Phenotypic Group. A. Boxplots showing the distribution of BUN at baseline. B. Boxplots showing the distribution of BUN at 4 Months. C. Boxplots showing the distribution of percent change of BUN. D. Boxplots showing the distribution of age.
Table 2.
Baseline Demographics.
| Characteristic* | Decreased BUN** (n=16) | Increased BUN (n=8) | p-value† |
|---|---|---|---|
| Age, median (IQR), years | 60.0(13.0) | 67.00(10.0) | 0.045 |
| BMI, median (IQR), (kg/m2) | 32.5 (9.7) | 29.65 (5.8) | 0.37 |
| Gender | |||
| Female | 9 (56.3%) | 5 (62.5%) | 1.00 |
| Male | 7 (43.8%) | 3 (37.5%) | |
| Race/Ethnicity | |||
| Caucasian | 8 (53.3%) | 3 (37.5%) | 0.83 |
| African American | 5 (33.3%) | 4 (50.0%) | |
| Other | 2(13.3%) | 1 (12.5%) | |
| Diabetes | |||
| Yes | 5 (33.3%) | 3 (37.5%) | 1.00 |
| No | 10(66.7%) | 5 (62.5%) | |
| Hypertension | |||
| Yes | 12(80.0%) | 8(100.0%) | 0.53 |
| No | 3 (20.0%) | 0 (0.0%) | |
| CKD Stage (MDRD) | |||
| Stage III | 5 (31.3%) | 5 (62.5%) | 0.20 |
| Stage IV/V‡ | 11 (68.8%) | 3 (37.5%) | |
Missing value for Race/Ethnicity, Diabetes, and Hypertension.
Percentages may not sum to 100 due to rounding.
Wilcoxon-Rank Sum Test for continuous variables and Fisher’s Exact Test for categorical variables.
One subject was determined to be Stage V after meeting inclusion criteria and remained pre-ESRD.
Table 3.
Clinical Data.
| Clinical Measurement* | Decreased BUN (n=16) | Increased BUN (n=8) | p-value** |
|---|---|---|---|
| BUN, mg/dL | |||
| Baseline | 58.5(31.0) | 36.5(17.0) | 0.03 |
| Month 4 | 48.5 (20.0) | 43.5(11.0) | 0.49 |
| % Change† | −12.5(7.8) | 3.3 (25.7) | 0.0007 |
| Systolic Blood Pressure, mmHg | |||
| Baseline | 130.0(14.0) | 129.0(23.0) | 0.90 |
| Month 4 | 135.0(30.0) | 125.0(23.0) | 0.26 |
| % Change† | 2.19(11.9) | −4.1 (17.2) | 0.13 |
| Diastolic Blood Pressure, mmHg | |||
| Baseline | 69.0(17.0) | 70.0 (9.0) | 0.41 |
| Month 4 | 73.0(12.0) | 70.0(13.0) | 0.54 |
| % Change† | 7.4 (22.5) | −4.5(18.1) | 0.15 |
| Creatinine, mg/dL | |||
| Baseline | 2.4(1.2) | 2.0 (0.8) | 0.10 |
| Month 4 | 2.4(1.4) | 2.0 (0.8) | 0.43 |
| % Change† | −1.9(13.8) | −1.7(26.9) | 0.29 |
| CRP, mg/L | |||
| Baseline | 0.3 (0.4) | 0.3 (0.4) | 0.68 |
| Month 4 | 0.3 (0.5) | 0.3 (0.3) | 0.64 |
| % Change† | 0.0 (45.0) | 0.0 (25.0) | 0.61 |
| Hemoglobin, mg/dL | |||
| Baseline | 10.4(2.10) | 11.2(1.65) | 0.35 |
| Month 4 | 10.7(2.25) | 11.0(0.90) | 0.37 |
| % Change† | 2.5(11.60) | −0.5 (5.83) | 0.74 |
| Potassium, mmol/L | |||
| Baseline | 4.7(1.00) | 4.6(1.10) | 0.72 |
| Month 4 | 4.4 (0.60) | 4.6 (0.50) | 0.61 |
| % Change† | −4.5(10.40) | 2.2(11.26) | 0.34 |
Values reported are the median (IQR).
Two missing values for CRP at month 4 and one missing value for Potassium at baseline.
Wilcoxon Rank Sum Test.
% Change calculation: (Month 4 – Baseline)/Baseline * 100.
Metabolomics using BUN of phenotypic anchor
Unsupervised multivariate analysis (PCA) of plasma samples differentiated subjects with increased BUN (Figure 2a, black squares, upper right quandrant) or decreased BUN (empty circles). A supervised analysis (OPLS-DA) resulted in 100% correct classification of BUN (Figure 2b), with a Fisher’s probability of 1.4 E-06. The metabolites that differentiated the BUN groups are listed in Table 4. Many of the metabolites that comprise the marker profile are significantly different (p<0,05) between the BUN groups. These metabolites are related to pathways of carbohydrate metabolism, and energy metabolism and regulation, and choline metabolism (Table 5).
Figure 2.
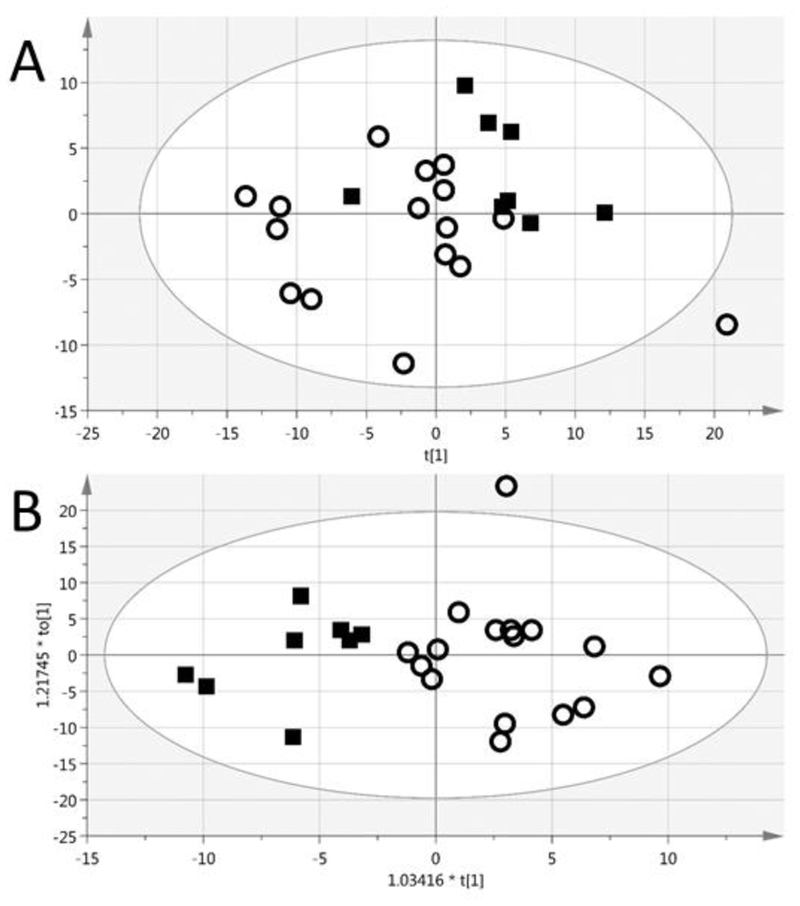
The PCA (A) of the plasma samples differentiated subjects with increased BUN (black squares, upper right quandrant) or decreased BUN (empty circles) The OPLS-DA (B) had a 100% correct classification and Fisher’s probability of 1.4 E-06. R2X(cum) = 0.40, Q2(cum) = 0.31
Table 4.
NMR Bins that differentiate decreased and increased BUN groups
| Associated Metabolites | Bin [ppm range] | VIP* | p-value** | Fold Change† |
|---|---|---|---|---|
| Lipoproteins, Lactate, Threonine | [1.28 .. 1.34] | 5.4 | 0.018 | 1.1 |
| O-Acetylcholine, O-Phosphocholine | [3.20 .. 3.26] | 4.9 | 0.013 | −1.2 |
| Creatine, Creatinine | [2.99 .. 3.05] | 4.2 | 0.006 | −1.4 |
| Glucose | [5.18.. 5.24] | 2.8 | 0.009 | 1.2 |
| Choline, O-Acetylcholine | [3.17.. 3.20] | 2.8 | 0.018 | −1.2 |
| Creatinine | [4.02 .. 4.07] | 2.4 | 0.030 | −1.5 |
| Betaine, Creatine | [3.91 .. 3.96] | 2.3 | 0.092 | −1.2 |
| Malonate | [3.08 ..3.11] | 1.9 | 0.257 | −1.4 |
| Proline | [2.04 .. 2.08] | 1.8 | 0.030 | −1.1 |
| 1,3-Dimethylurate | [3.28 ..3.31] | 1.7 | 0.209 | −1.4 |
| Ethylene glycol | [3.65 .. 3.67] | 1.3 | 0.071 | −1.3 |
| Trimethylamine, Dimethylglycine | [2.88 .. 2.93] | 1.2 | 0.025 | −1.5 |
| Unknown | [3.60 .. 3.62] | 1.2 | 0.035 | −1.5 |
| Tartrate | [4.28 .. 4.34] | 0.9 | 0.025 | −2.3 |
Jackknifed confidence interval does not include 0
Wilcoxon Rank Sum Test
Positive fold change means the bin peak intensity of increased BUN is higher than decreased BUN.
Table 5.
The VIP metabolites and their related biochemical pathways.
| Metabolite | Pathway information | Microbial Related | Related to Renal Function |
|---|---|---|---|
| 1,3-Dimethylurate | Theophylline Metabolism | -- | -- |
| Betaine | Choline Metabolism | (Nicholson, Holmes et al. 2012) | (Grunewald and Eckstein 1995) |
| Choline | Choline Metabolism | (Nicholson, Holmes et al. 2012) | (Rhee, Clish et al. 2013) |
| Creatine | Creatine and Creatinine Metabolism | (Wrong 1978) | In affected pathway |
| Creatinine | Creatine and Creatinine Metabolism | (Wrong 1978) | (Levey, Perrone et al. 1988) |
| Dimethylglycine | Choline Metabolism | (Nicholson, Holmes et al. 2012) | (McGregor, Dellow etal. 2001, Vanholder, De Smet et al. 2003) |
| Ethylene glycol | Exogenous | -- | -- |
| Glucose | Carbohydrate Metabolism | (Zheng, Xie etal. 2011) | (de Boer 2008) |
| Lactate | Carbohydrate Metabolism | (Zheng, Xie etal. 2011) | -- |
| Lipoproteins | Nutrient Absorption and Energy Regulation | (Krajmalnik-Brown, llhan etal. 2012) | (Lin, Khetarpal et al. 2015) |
| Malonate | Pyrimidine metabolism | (Krajmalnik-Brown, llhan etal. 2012) | (Rhee, Souza et al. 2010) |
| O-Acetylcholine | Choline Metabolism | (Nicholson, Holmes et al. 2012) | In affected pathway |
| O-Phosphocholine | Choline Metabolism | (Nicholson, Holmes et al. 2012) | In affected pathway |
| Proline | Arginine and proline metabolism | (Zheng, Xie etal. 2011) | (Tizianello, De Ferrari etal. 1980) |
| Tartrate | Exogenous | -- | -- |
| Threonine | Essential amino acid | (Puiman, Stoll et al. 2013) | (Tizianello, De Ferrari etal. 1980, Rhee, Clish et al. 2013) |
| Trimethylamine | Choline Metabolism | (Nicholson, Holmes et al. 2012) | (Duranton, Cohen et al. 2012) |
Additionally, a supervised multivariate analysis (OPLS-DA) was able to differentiate the Stage III profiles from Stage IV/V, as shown in Figure 3. The VIP metabolites for the progression of disease are listed in Table 6, and Table 7 highlights the metabolites that are unique to the differentiation of the BUN groups and of disease progression.
Figure 3.
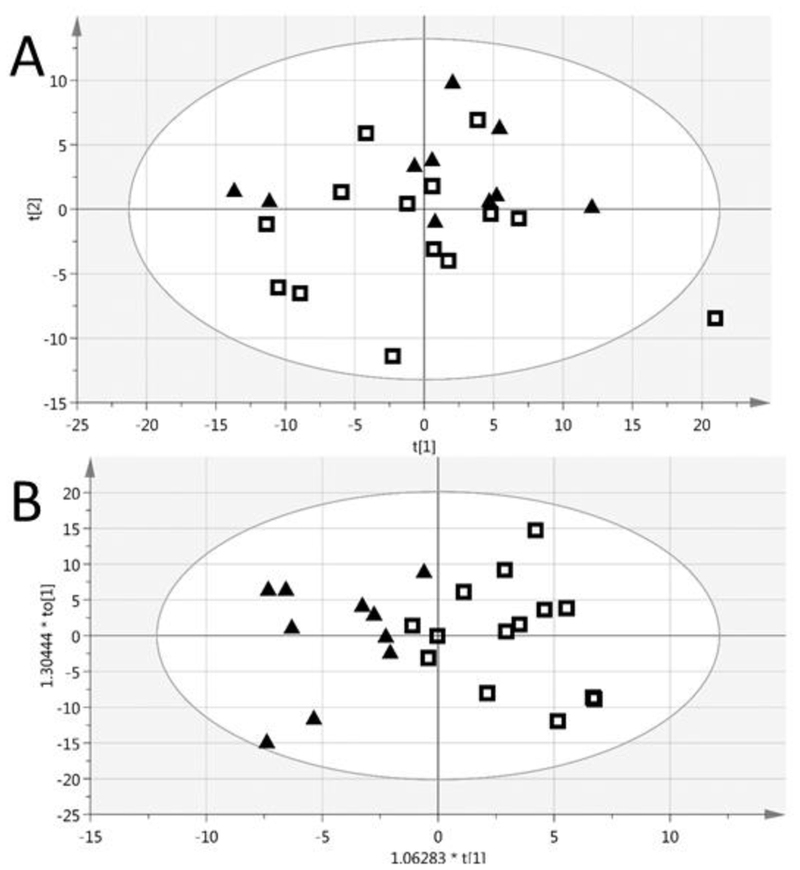
The PCA (A) and supervised multivariate analysis (OPLS-DA) (B) of the Stage 3A/B (black triangles) and Stage 4/5 (empty squares) profiles. CKD stage assignment is based on creatinine measured in baseline plasma samples and the MDRD equation. The OPLS-DA had 91.7% correct classification and a Fisher’s probability of 7.2E-05. R2X(cum) = 0.375, Q2(cum) = 0.357
Table 6.
NMR Bins that differentiate CKD stages III and IV/V‡
| Associated Metabolites | Bin [ppm range] | VIP* | p-value** | Fold Change† |
|---|---|---|---|---|
| Glucose, 1,3-Dimethylurate | [3.43 .. 3.48] | 3.9 | 0.71 | −1.0 |
| Unknown | [0.82 .. 0.85] | 3.2 | 0.01 | 1.3 |
| Alanine | [1.42.. 1.48] | 3.2 | 0.06 | 1.1 |
| Proline, N-Acetylamino acids | [1.98.. 2.04] | 3.1 | 0.39 | 1.1 |
| Glucose | (6 bins) | 1.2–3.0 | 0.07–0.91 | (−1.1)-(1.0) |
| Creatine, Creatinine | [2.99 .. 3.05] | 2.7 | 0.14 | −1.2 |
| Propylene glycol | [1.09.. 1.14] | 2.7 | 0.04 | 1.5 |
| Choline, O-Acetylcholine | [3.17.. 3.20] | 1.8 | 0.10 | −1.2 |
| Glycerol | [3.62 .. 3.65] | 1.4 | 0.28 | −1.1 |
| Lipids | [1.14.. 1.17] | 1.0 | 0.12 | 1.2 |
Jackknifed confidence interval does not include 0,
Wilcoxon Rank Sum Test,
Positive fold change means the bin peak intensity of stage III is higher than stage IV/V.
One subject was determined to be Stage V after meeting inclusion criteria and remained pre-ESRD.
Table 7.
Metabolites that are unique to differentiating the BUN groups and CKD stage.
| Metabolites Unique to ΔBUN Phenotype | Metabolites Unique to CKD Stage Phenotype |
|---|---|
| Betaine | Alanine |
| Dimethylglycine | Glycerol |
| Ethylene glycol | Lipids |
| Lactate | N-Acetylamino acids |
| Lipoproteins | Propylene glycol |
| Malonate | Unknown |
| O-Phosphocholine | |
| Tartrate | |
| Threonine | |
| Trimethylamine |
DISCUSSION
These results indicate a subset of patients with CKD III or IV respond positively to probiotic use as measured by the primary outcome of a decrease in BUN after 4 months. A metabolic phenotype was present prior to starting the regimen that has potential to predict response. This phenotype has characteristics unique to the BUN response phenotype when compared to kidney function.
BUN was chosen as the primary outcome measure because it was the only clinical measure to change significantly across all study samples over the course of probiotic use. This observation was consistent with a previous pilot that found BUN was the measure of kidney function most affected by probiotics (Ranganathan, Friedman et al. 2009). The observed change in BUN is an important outcome of the clinical trial (Ranganathan, Pechenyak et al. 2013), because BUN is a marker of kidney function and an indicator of protein carbamylation, an independent mortality risk factor among kidney failure patients (Berg, Drechsler et al. 2013). The observed decrease from 58.5 mg/dL to 48.5 mg/dL BUN among responders can be considered clinically encouraging; however, the four month time scale is too short to evaluate the impacts on clinical decisions such as starting dialysis. The BUN concentration decreased for 16 of the study participants and increased for 8. Another clinical trial has probed the use of probiotics and observed differences in the gut microbiome response in their subject population (Wang, Zhang et al. 2014).
The first observed characteristic of the predictive metabolic phenotype was a higher BUN concentration at baseline in the decreased BUN group. Many probiotics, including the probiotic used in this study, include urease producing bacteria in an effort to increase degradation of urea (Vaziri, Zhao et al. 2016). Presumably, bacterial ureases are driving the observed change in BUN. A recent review questioned the safety of this approach (Vaziri, Zhao et al. 2016) and hypothesized that the conversion of urea to ammonium hydroxide could raise the pH of the intestinal lumen and damage the intestinal epithelial barrier (Vaziri, Yuan et al. 2013). While not indicative of local pH changes, a previous pilot study (Ranganathan, Friedman et al. 2009), however, demonstrated lower fecal pH with probiotic use. This can be explained by consumption of ammonia for biosynthesis and simultaneous production of lactic acid by L. acidophilous which is also known to lower circulating simple aliphatic amines (Dunn, Simenhoff et al. 1998).
Metabolic profiling revealed a phenotype in the baseline samples that was predictive of the subset of study participants that would respond to probiotic supplement use (decreased BUN group). The large majority of metabolites contributing to this phenotype (Table 5) have been described in the gut microflora and kidney disease literature, which include metabolites involved in creatinine, choline, carbohydrate, and amino acid pathways. Creatinine values are generally expected to correlate with BUN when changes are due to glomerular filtration rate. Creatinine is a waste product of muscle metabolism which uses the creatine-phosphocreatine buffer as an energy source, and may build up in the blood if glomerular injury has occurred. For this reason, serum creatinine concentrations and creatinine glomerular filtration rate (GFR) are commonly used as clinical indicators of kidney function (Hosten 1990). The metabolomics analysis found significantly lower integrals in both creatinine NMR bins (p=0.006 and p=0.03) for the increased compared to decreased BUN group, consistent with the clinical measurement (p=0.10, Table 3). Creatinine is degraded by gut microflora (Levey, Perrone et al. 1988) and has been found slightly elevated in plasma concentrations in conventional compared to germ-free mice (Wikoff, Anfora et al. 2009), while both creatine and creatinine were found to be higher in feces of rats treated with antibiotics (Zheng, Xie et al. 2011).
Choline metabolism is important for osmoregulation within the kidney. The kidney synthesizes osmolytes betaine (Grunewald and Eckstein 1995) and glycerophosphocholine (Zablocki, Miller et al. 1991) from choline to retain water and respond to changes in tonicity. Choline deficiency is associated with damage to the kidney (Denninghoff, Ossani et al. 2014) and changes in gut microbial ecology (Spencer, Hamp et al. 2011). Due to its metabolism in proximal tubular cells, others have hypothesized that elevated plasma choline may signal tubulointerstitial dysfunction, a pathology which is even more highly correlated with CKD prognosis than glomerular injury (Rhee, Clish et al. 2013). Trimethylamine and dimethylglycine are known uremic solutes (McGregor, Dellow et al. 2001, Duranton, Cohen et al. 2012), and metabolism of choline by the gut microbiome is a major contributor to their synthesis (al-Waiz, Mikov et al. 1992, Matsumoto, Kibe et al. 2012) The presence of dimethylglycine in the intestinal lumen has also been positively correlated with the presence of Enterobacteriaceae and negatively with Lactobacillus sp. (Matsumoto, Kibe et al. 2012). There are several genetic polymorphisms that are correlated with choline deficiency (Zeisel 2006), such as a 5,10-methylenetetrahydrofolate dehydrogenase 1958A allele. Carriers were more likely to develop a choline deficiency than noncarriers in a healthy population (Kohlmeier, da Costa et al. 2005). Additional insight would come from understanding the influence of this allele on probiotic response in a validation study population. Choline monitoring in CKD patients as not been attempted previously; however, this would be straightforward and modifiable through dietary intervention.
Carbohydrate metabolism deficiencies were observed in uremia (Perkoff, Thomas et al. 1958) and chronic renal failure (Hampers, Soeldner et al. 1966) as far back as 1958, but it is not clear if this glucose imbalance is a part of the pathology, progression of disease, or both (de Boer 2008). The genus Bifidobacterium has been studied in detail because the constituent genomes encode a large number of carbohydrate-modifying enzymes (Pokusaeva, Fitzgerald et al. 2011). S. thermophilius is a significant producer of lactate in yogurt cultures (Gezginc, Topcal et al. 2015), while L. acidophilus is noted for its carbohydrate metabolism (Goh and Klaenhammer 2014) and lactate consumption (Sulek, Frandsen et al. 2012).
The renal arteriovenous metabolite gradients of amino acids indicate that the kidney actively absorbs and metabolizes proline from arterial blood and releases the essential amino acid threonine (Tizianello, De Ferrari et al. 1980). An 80–90% reduction in both activities was observed in patients with reduced kidney function. Proline has been observed to increase in the urine of rats after treatment with antibiotics (Zheng, Xie et al. 2011) and threonine levels were higher in serum after antibiotic treatment of neonatal pigs (Puiman, Stoll et al. 2013). The majority of threonine is used to support intestinal mucin synthesis and is critical to maintaining intestinal barrier function (van der Schoor, Wattimena et al. 2007).
The higher BUN and trend to higher creatinine levels measured in the decreased group raises the possibility that a probiotic supplement may be most effective for CKD III-IV patients with poorer kidney function. However, when the CKD stage was used to determine the metabolic phenotype related to kidney function (Table 6), the metabolites most important for separating Stage III from Stage IV/V subjects had some overlap, but were not the same as those most important for the change in BUN (Table 7). Of the metabolites unique to predicting BUN response, choline metabolism represents the majority of the distinguishing bins.
While metabolomics studies have investigated metabolic signatures of uremia (Duranton, Cohen et al. 2012) or disease progression (Rhee, Clish et al. 2013), not many studies have reported changes in metabolic profiles with progression from CKD stage III to IV (Krajmalnik-Brown, Ilhan et al. 2012, Lin, Khetarpal et al. 2015). Of those metabolites observed to be unique to the CKD stage model, alanine (Rhee, Clish et al. 2013), lipids (Rhee, Souza et al. 2010), and N-acetylamino acids (Sekula, Goek et al. 2016) have been reported in previous CKD metabolomics studies. Notably, other markers of renal dysfunction (Niewczas, Sirich et al. 2014) including dimethylarginine, arginine, citrulline, ornithine, spermidine, tryptophan, kynurenine, serotonin, indoxyl-sulfate, tyrosine, phenylalanine, p-cresol, TMAO and acylcarnitines were not determined to be important for differentiating CKD stage in this data.
The predictive metabolic phenotype may reflect the status of the gut microbiome at baseline, and the lack of change in BUN in the increased BUN group may be a reflection of a more resilient gut microbiome less altered by poor kidney function. Mechanistic effects of this dietary probiotic supplement use remain to be worked out in detail.
Variables that could influence the generation of gut originated metabolites, diet and medications were kept constant for the duration of the study. However, no food intake diaries were kept, and CKD patients are often provided with nutritional recommendations such as restricting intake of protein, sodium and potassium. Any dietary changes were expected to be random, but an independent study could verify this.
The probiotic supplementation may cause changes in the diversity and/or function of the gut microbiome, leading to changes in BUN, metabolite profiles, kidney function, and clinical outcomes. A future study measuring each in parallel could lead to further mechanistic insights. The predictive metabolic phenotype warrants validation in a larger cohort and longer study, particularly to understand the generalizability of the phenotype to other prebiotic and probiotic treatments. The current study also demonstrates the feasibility of a larger study with serial microbiome measurements for a mechanistic understanding of probiotic treatment related improvements in kidney function and personalized intervention strategies in CKD.
ACKNOWLEDGEMENTS
The metabolomics study was performed under the RTI RCMRC NIH Common Fund Program grant U24 DK097193 (Sumner, PI). NIH Common Fund Program grant K01 GM109320 provided salary support for J. G.
REFERENCES
- al-Waiz M, Mikov M, Mitchell SC and Smith RL (1992). “The exogenous origin of trimethylamine in the mouse.” Metabolism 41(2): 135–136. [DOI] [PubMed] [Google Scholar]
- Andrade-Oliveira V, Amano MT, Correa-Costa M, Castoldi A, Felizardo RJ, de Almeida DC, Bassi EJ, Moraes-Vieira PM, Hiyane MI, Rodas AC, Peron JP, Aguiar CF, Reis MA, Ribeiro WR, Valduga CJ, Curi R, Vinolo MA, Ferreira CM and Camara NO (2015). “Gut Bacteria Products Prevent AKI Induced by Ischemia-Reperfusion.” J Am Soc Nephrol 26(8): 1877–1888. [DOI] [PMC free article] [PubMed] [Google Scholar]
- Beckonert O, Keun HC, Ebbels TM, Bundy J, Holmes E, Lindon JC and Nicholson JK (2007). “Metabolic profiling, metabolomic and metabonomic procedures for NMR spectroscopy of urine, plasma, serum and tissue extracts.” Nat Protoc 2(11): 2692–2703. [DOI] [PubMed] [Google Scholar]
- Berg AH, Drechsler C, Wenger J, Buccafusca R, Hod T, Kalim S, Ramma W, Parikh SM, Steen H, Friedman DJ, Danziger J, Wanner C, Thadhani R and Karumanchi SA (2013). “Carbamylation of serum albumin as a risk factor for mortality in patients with kidney failure.” Sci Transl Med 5(175): 175ra129. [DOI] [PMC free article] [PubMed] [Google Scholar]
- Blydt-Hansen TD, Sharma A, Gibson IW, Mandal R and Wishart DS (2014). “Urinary metabolomics for noninvasive detection of borderline and acute T cell-mediated rejection in children after kidney transplantation.” Am J Transplant 14(10): 2339–2349. [DOI] [PubMed] [Google Scholar]
- Chan EC, Pasikanti KK and Nicholson JK (2011). “Global urinary metabolic profiling procedures using gas chromatography-mass spectrometry.” Nat Protoc 6(10): 1483–1499. [DOI] [PubMed] [Google Scholar]
- de Boer IH (2008). “Vitamin D and glucose metabolism in chronic kidney disease.” Curr Opin Nephrol Hypertens 17(6): 566–572. [DOI] [PMC free article] [PubMed] [Google Scholar]
- Denninghoff V, Ossani G, Uceda A, Rugnone M, Fernandez E, Fresno C, Gonzalez G, Diaz ML, Avagnina A, Elsner B and Monserrat A (2014). “Molecular pathology of acute kidney injury in a choline-deficient model and fish oil protective effect.” Eur J Nutr 53(3): 897–906. [DOI] [PubMed] [Google Scholar]
- Dunn SR, Simenhoff ML, Ahmed KE, Gaughan WJ, Eltayeb BO, Fitzpatrick M-ED, Emery SM, Ayres JW and Holt KE (1998). “Effect of Oral Administration of Freeze-Dried Lactobacillus acidophilus on Small Bowel Bacterial Overgrowth in Patients with End Stage Kidney Disease: Reducing Uremic Toxins and Improving Nutrition.” International Dairy Journal 8(5–6): 545–553. [Google Scholar]
- Duranton F, Cohen G, De Smet R, Rodriguez M, Jankowski J, Vanholder R, Argiles A and on behalf of the European Uremic Toxin Work Group (2012). “Normal and pathologic concentrations of uremic toxins.” J Am Soc Nephrol 23(7): 1258–1270. [DOI] [PMC free article] [PubMed] [Google Scholar]
- Gezginc Y, Topcal F, Comertpay S and Akyol I (2015). “Quantitative analysis of the lactic acid and acetaldehyde produced by Streptococcus thermophilus and Lactobacillus bulgaricus strains isolated from traditional Turkish yogurts using HPLC.” J Dairy Sci 98(3): 1426–1434. [DOI] [PubMed] [Google Scholar]
- Gibson GR and Roberfroid MB (1995). “Dietary modulation of the human colonic microbiota: introducing the concept of prebiotics.” J Nutr 125(6): 1401–1412. [DOI] [PubMed] [Google Scholar]
- Goh YJ and Klaenhammer TR (2014). “Insights into glycogen metabolism in Lactobacillus acidophilus: impact on carbohydrate metabolism, stress tolerance and gut retention.” Microb Cell Fact 13: 94. [DOI] [PMC free article] [PubMed] [Google Scholar]
- Grunewald RW and Eckstein A (1995). “Osmotic regulation of the betaine metabolism in immortalized renal cells.” Kidney Int 48(6): 1714–1720. [DOI] [PubMed] [Google Scholar]
- Hampers CL, Soeldner JS, Doak PB and Merrill JP (1966). “Effect of chronic renal failure and hemodialysis on carbohydrate metabolism.” Journal of Clinical Investigation 45(11): 1719–1731. [DOI] [PMC free article] [PubMed] [Google Scholar]
- Hoerger TJ, Simpson SA, Yarnoff BO, Pavkov ME, Ríos Burrows N, Saydah SH, Williams DE and Zhuo X (2015). “The Future Burden of CKD in the United States: A Simulation Model for the CDC CKD Initiative.” American Journal of Kidney Diseases 65(3): 403–411. [DOI] [PMC free article] [PubMed] [Google Scholar]
- Hosten AO (1990). BUN and Creatinine Clinical Methods: The History, Physical, and Laboratory Examinations. Walker HK, Hall WD and Hurst JW. Boston, Butterworth Publishers, a division of Reed Publishing. [PubMed] [Google Scholar]
- Johnson NB, Hayes LD, Brown K, Hoo EC and Ethier KA (2014). “CDC National Health Report: Leading Causes of Morbidity and Mortality and Associated Behavioral Risk and Protective Factors - United States 2005–2013.” MMWR Morb Mortal Wkly Rep 63(04): 3–27. [PubMed] [Google Scholar]
- Kang JY (1993). “The gastrointestinal tract in uremia.” Dig. Dis. Sci 38: 257–268. [DOI] [PubMed] [Google Scholar]
- Kohlmeier M, da Costa K-A, Fischer LM and Zeisel SH (2005). “Genetic variation of folate-mediated one-carbon transfer pathway predicts susceptibility to choline deficiency in humans.” Proceedings of the National Academy of Sciences of the United States of America 102(44): 16025–16030. [DOI] [PMC free article] [PubMed] [Google Scholar]
- Krajmalnik-Brown R, Ilhan Z-E, Kang D-W and DiBaise JK (2012). “Effects of Gut Microbes on Nutrient Absorption and Energy Regulation.” Nutrition in clinical practice : official publication of the American Society for Parenteral and Enteral Nutrition 27(2): 201–214. [DOI] [PMC free article] [PubMed] [Google Scholar]
- Levey AS, Perrone RD and Madias NE (1988). “Serum creatinine and renal function.” Annu Rev Med 39: 465–490. [DOI] [PubMed] [Google Scholar]
- Liabeuf S, Barreto DV, Barreto FC, Meert N, Glorieux G, Schepers E, Temmar M, Choukroun G, Vanholder R, Massy ZA and European Uraemic Toxin Work Group (EUTox) (2010). “Free p-cresylsulphate is a predictor of mortality in patients at different stages of chronic kidney disease.” Nephrol Dial Transplant 25(4): 1183–1191. [DOI] [PubMed] [Google Scholar]
- Lin J, Khetarpal SA, Terembula K, Reilly MP and Wilson FP (2015). “Relation of atherogenic lipoproteins with estimated glomerular filtration rate decline: a longitudinal study.” BMC Nephrol 16: 130. [DOI] [PMC free article] [PubMed] [Google Scholar]
- Matsumoto M, Kibe R, Ooga T, Aiba Y, Kurihara S, Sawaki E, Koga Y and Benno Y (2012). “Impact of intestinal microbiota on intestinal luminal metabolome.” Sci Rep 2: 233. [DOI] [PMC free article] [PubMed] [Google Scholar]
- McGregor DO, Dellow WJ, Lever M, George PM, Robson RA and Chambers ST (2001). “Dimethylglycine accumulates in uremia and predicts elevated plasma homocysteine concentrations.” Kidney Int 59(6): 2267–2272. [DOI] [PubMed] [Google Scholar]
- Meijers BK and Evenepoel P (2011). “The gut-kidney axis: indoxyl sulfate, p-cresyl sulfate and CKD progression.” Nephrol Dial Transplant 26(3): 759–761. [DOI] [PubMed] [Google Scholar]
- Meinardi S, Jin KB, Barletta B, Blake DR and Vaziri ND (2013). “Exhaled breath and fecal volatile organic biomarkers of chronic kidney disease.” Biochim Biophys Acta 1830(3): 2531–2537. [DOI] [PubMed] [Google Scholar]
- Nicholson JK, Holmes E, Kinross J, Burcelin R, Gibson G, Jia W and Pettersson S (2012). “Host-Gut Microbiota Metabolic Interactions.” Science 336(6086): 1262–1267. [DOI] [PubMed] [Google Scholar]
- Niewczas MA, Sirich TL, Mathew AV, Skupien J, Mohney RP, Warram JH, Smiles A, Huang X, Walker W, Byun J, Karoly ED, Kensicki EM, Berry GT, Bonventre JV, Pennathur S, Meyer TW and Krolewski AS (2014). “Uremic solutes and risk of end-stage renal disease in type 2 diabetes: metabolomic study.” Kidney Int 85(5): 1214–1224. [DOI] [PMC free article] [PubMed] [Google Scholar]
- Perkoff GT, Thomas CL, Newton JD, Sellman JC and Tyler FH (1958). “Mechanism of impaired glucose tolerance in uremia and experimental hyperazotemia.” Diabetes 7(5): 375–383. [DOI] [PubMed] [Google Scholar]
- Pokusaeva K, Fitzgerald GF and van Sinderen D (2011). “Carbohydrate metabolism in Bifidobacteria.” Genes & Nutrition 6(3): 285–306. [DOI] [PMC free article] [PubMed] [Google Scholar]
- Puiman P, Stoll B, Molbak L, de Bruijn A, Schierbeek H, Boye M, Boehm G, Renes I, van Goudoever J and Burrin D (2013). “Modulation of the gut microbiota with antibiotic treatment suppresses whole body urea production in neonatal pigs.” Am J Physiol Gastrointest Liver Physiol 304(3): G300–310. [DOI] [PMC free article] [PubMed] [Google Scholar]
- Ramezani A and Raj DS (2014). “The gut microbiome, kidney disease, and targeted interventions.” J Am Soc Nephrol 25(4): 657–670. [DOI] [PMC free article] [PubMed] [Google Scholar]
- Ranganathan N, Friedman EA, Tam P, Rao V, Ranganathan P and Dheer R (2009). “Probiotic dietary supplementation in patients with stage 3 and 4 chronic kidney disease: a 6 month pilot scale trial in Canada.” Curr Med Res Opin 25(8): 1919–1930. [DOI] [PubMed] [Google Scholar]
- Ranganathan N, Pechenyak B, Vyas U, Ranganathan P, DeLoach S, Falkner B, Weinberg A, Saggi SJ and Friedman DJ (2013). “Dose Escalation, Safety and Impact of a Strain-Specific Probiotic (Renadyl™) on Stages III and IV Chronic Kidney Disease Patients.” J Nephrol Ther 3(141). [Google Scholar]
- Rhee EP (2015). “Metabolomics and renal disease.” Curr Opin Nephrol Hypertens 24(4): 371–379. [DOI] [PMC free article] [PubMed] [Google Scholar]
- Rhee EP, Clish CB, Ghorbani A, Larson MG, Elmariah S, McCabe E, Yang Q, Cheng S, Pierce K, Deik A, Souza AL, Farrell L, Domos C, Yeh RW, Palacios I, Rosenfield K, Vasan RS, Florez JC, Wang TJ, Fox CS and Gerszten RE (2013). “A combined epidemiologic and metabolomic approach improves CKD prediction.” J Am Soc Nephrol 24(8): 1330–1338. [DOI] [PMC free article] [PubMed] [Google Scholar]
- Rhee EP, Souza A, Farrell L, Pollak MR, Lewis GD, Steele DJ, Thadhani R, Clish CB, Greka A and Gerszten RE (2010). “Metabolite profiling identifies markers of uremia.” J Am Soc Nephrol 21(6): 1041–1051. [DOI] [PMC free article] [PubMed] [Google Scholar]
- Saran R, Li Y, Robinson B, Ayanian J, Balkrishnan R, Bragg-Gresham J, Chen JT, Cope E, Gipson D, He K, Herman W, Heung M, Hirth RA, Jacobsen SS, Kalantar-Zadeh K, Kovesdy CP, Leichtman AB, Lu Y, Molnar MZ, Morgenstern H, Nallamothu B, O’Hare AM, Pisoni R, Plattner B, Port FK, Rao P, Rhee CM, Schaubel DE, Selewski DT, Shahinian V, Sim JJ, Song P, Streja E, Kurella Tamura M, Tentori F, Eggers PW, Agodoa LY and Abbott KC (2015). “US Renal Data System 2014 Annual Data Report: Epidemiology of Kidney Disease in the United States.” Am J Kidney Dis 66(1 Suppl 1): Svii, S1–305. [DOI] [PMC free article] [PubMed] [Google Scholar]
- Schepers E, Glorieux G and Vanholder R (2010). “The gut: the forgotten organ in uremia?” Blood Purif 29(2): 130–136. [DOI] [PubMed] [Google Scholar]
- Sekula P, Goek ON, Quaye L, Barrios C, Levey AS, Romisch-Margl W, Menni C, Yet I, Gieger C, Inker LA, Adamski J, Gronwald W, Illig T, Dettmer K, Krumsiek J, Oefner PJ, Valdes AM, Meisinger C, Coresh J, Spector TD, Mohney RP, Suhre K, Kastenmuller G and Kottgen A (2016). “A Metabolome-Wide Association Study of Kidney Function and Disease in the General Population.” J Am Soc Nephrol 27(4):1175–88. [DOI] [PMC free article] [PubMed] [Google Scholar]
- Shahinian VB, Hedgeman E, Gillespie BW, Young EW, Robinson B, Hsu CY, Plantinga LC, Burrows NR, Eggers P, Saydah S, Powe NR, Saran R and C. C. S. System (2013). “Estimating prevalence of CKD stages 3–5 using health system data.” Am J Kidney Dis 61(6): 930–938. [DOI] [PMC free article] [PubMed] [Google Scholar]
- Sirich TL, Plummer NS, Gardner CD, Hostetter TH and Meyer TW (2014). “Effect of increasing dietary fiber on plasma levels of colon-derived solutes in hemodialysis patients.” Clin J Am Soc Nephrol 9(9): 1603–1610. [DOI] [PMC free article] [PubMed] [Google Scholar]
- Spencer MD, Hamp TJ, Reid RW, Fischer LM, Zeisel SH and Fodor AA (2011). “Association between composition of the human gastrointestinal microbiome and development of fatty liver with choline deficiency.” Gastroenterology 140(3): 976–986. [DOI] [PMC free article] [PubMed] [Google Scholar]
- Strid H, Simren M, Stotzer PO, Ringstrom G, Abrahamsson H and Bjornsson ES (2003). “Patients with chronic renal failure have abnormal small intestinal motility and a high prevalence of small intestinal bacterial overgrowth.” Digestion 67(3): 129–137. [DOI] [PubMed] [Google Scholar]
- Sulek K, Frandsen H, Smedsgaard J, Skov T, Wilcks A and Licht T (2012). “Metabolic footprint of Lactobacillus acidophilus NCFM at different pH.” Metabolomics 8(2): 244–252. [Google Scholar]
- Tang WH, Wang Z, Kennedy DJ, Wu Y, Buffa JA, Agatisa-Boyle B, Li XS, Levison BS and Hazen SL (2015). “Gut microbiota-dependent trimethylamine N-oxide (TMAO) pathway contributes to both development of renal insufficiency and mortality risk in chronic kidney disease.” Circ Res 116(3): 448–455. [DOI] [PMC free article] [PubMed] [Google Scholar]
- Tanner RM, Brown TM and Muntner P (2012). “Epidemiology of obesity, the metabolic syndrome, and chronic kidney disease.” Curr Hypertens Rep 14(2): 152–159. [DOI] [PubMed] [Google Scholar]
- Tizianello A, De Ferrari G, Garibotto G, Gurreri G and Robaudo C (1980). “Renal metabolism of amino acids and ammonia in subjects with normal renal function and in patients with chronic renal insufficiency.” J Clin Invest 65(5): 1162–1173. [DOI] [PMC free article] [PubMed] [Google Scholar]
- van der Schoor SR, Wattimena DL, Huijmans J, Vermes A and van Goudoever JB (2007). “The gut takes nearly all: threonine kinetics in infants.” Am J Clin Nutr 86(4): 1132–1138. [DOI] [PubMed] [Google Scholar]
- Vanholder R, De Smet R, Glorieux G, Argiles A, Baurmeister U, Brunet P, Clark W, Cohen G, De Deyn PP, Deppisch R, Descamps-Latscha B, Henle T, Jorres A, Lemke HD, Massy ZA, Passlick-Deetjen J, Rodriguez M, Stegmayr B, Stenvinkel P, Tetta C, Wanner C, Zidek W and European Uremic Toxin Work Group (EUTox) (2003). “Review on uremic toxins: classification, concentration, and interindividual variability.” Kidney Int 63(5): 1934–1943. [DOI] [PubMed] [Google Scholar]
- Vaziri ND, Freel RW and Hatch M (1995). “Effect of chronic experimental renal insufficiency on urate metabolism.” J Am Soc Nephrol 6(4): 1313–1317. [DOI] [PubMed] [Google Scholar]
- Vaziri ND, Yuan J and Norris K (2013). “Role of urea in intestinal barrier dysfunction and disruption of epithelial tight junction in chronic kidney disease.” Am J Nephrol 37(1): 1–6. [DOI] [PMC free article] [PubMed] [Google Scholar]
- Vaziri ND, Zhao YY and Pahl MV (2016). “Altered intestinal microbial flora and impaired epithelial barrier structure and function in CKD: the nature, mechanisms, consequences and potential treatment.” Nephrol Dial Transplant 31(5):737–46s [DOI] [PubMed] [Google Scholar]
- Wang L, Zhang J, Guo Z, Kwok L, Ma C, Zhang W, Lv Q, Huang W and Zhang H (2014). “Effect of oral consumption of probiotic Lactobacillus planatarum P-8 on fecal microbiota, SIgA, SCFAs, and TBAs of adults of different ages.” Nutrition 30(7–8): 776–783 e771. [DOI] [PubMed] [Google Scholar]
- Wei Q, Xiao X, Fogle P and Dong Z (2014). “Changes in Metabolic Profiles during Acute Kidney Injury and Recovery following Ischemia/Reperfusion.” PLoS ONE 9(9): e106647. [DOI] [PMC free article] [PubMed] [Google Scholar]
- Wikoff WR, Anfora AT, Liu J, Schultz PG, Lesley SA, Peters EC and Siuzdak G (2009). “Metabolomics analysis reveals large effects of gut microflora on mammalian blood metabolites.” Proc Natl Acad Sci U S A 106(10): 3698–3703. [DOI] [PMC free article] [PubMed] [Google Scholar]
- Wrong O (1978). “Nitrogen metabolism in the gut.” Am J Clin Nutr 31(9): 1587–1593. [DOI] [PubMed] [Google Scholar]
- Zablocki K, Miller SP, Garcia-Perez A and Burg MB (1991). “Accumulation of glycerophosphocholine (GPC) by renal cells: osmotic regulation of GPC:choline phosphodiesterase.” Proc Natl Acad Sci U S A 88(17): 7820–7824. [DOI] [PMC free article] [PubMed] [Google Scholar]
- Zeisel SH (2006). “Choline: Critical Role During Fetal Development and Dietary Requirements in Adults.” Annu Rev Nutr 26: 229–250. [DOI] [PMC free article] [PubMed] [Google Scholar]
- Zheng X, Xie G, Zhao A, Zhao L, Yao C, Chiu NH, Zhou Z, Bao Y, Jia W, Nicholson JK and Jia W (2011). “The footprints of gut microbial-mammalian co-metabolism.” J Proteome Res 10(12): 5512–5522. [DOI] [PubMed] [Google Scholar]