. 2019 Feb 15;8:e41556. doi: 10.7554/eLife.41556

Figure 4. Exemplary validation of candidate genes by qRT-PCR and expression domains in the head.

(a–a’’,b–b’’) Maturation markers fatty acid binding protein and qpeptin. (c–c’’,d–d’’) Sexual differentiation markers dmrt and sten. (a–d): qRT-PCR validation of the candidates relative to the arithmetic mean of the reference genes cdc5 and sams. All graphs show the arithmetic mean with standard deviation, and the individual data points. (a’–d’’) Whole mount in situ hybridisations of the respective genes, comparing premature animals (PM, (a’,b’) with mature animals (M, a’’,b’’), and males (c’,d’,d’’’) with females (c’’,d’’, d’’’), respectively. All images except d’’’and d’’’’: dorsal views, anterior to the top, scale bar: 250 µm. d’’’ and d’’’’: ventral views, anterior top, scale bar: 200 µm. Also see Figure 4—figure supplement 1 for further validations. a.e.: anterior eye; p.e.: posterior eye, an: antenna, pa: palpa.

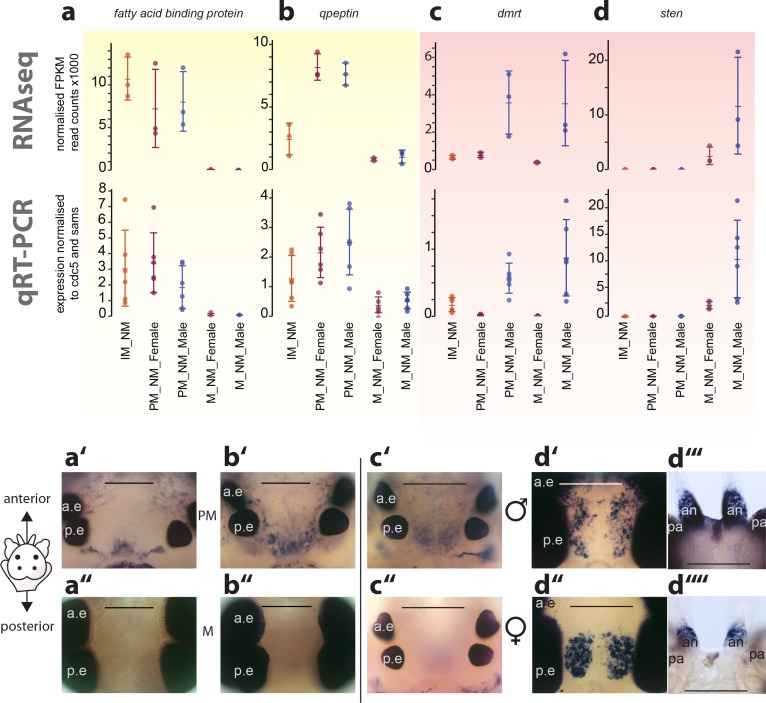
Figure 4—source data 1. Expression values relative to sams and cdc5 as obtained by qRT-PCR.
This file contains the qRT-PCR expression values of the candidate genes relative to the expression of the arithmetic mean of the reference genes sams and cdc5. Each gene is contained in a separate tab.
DOI: 10.7554/eLife.41556.041

Figure 4.

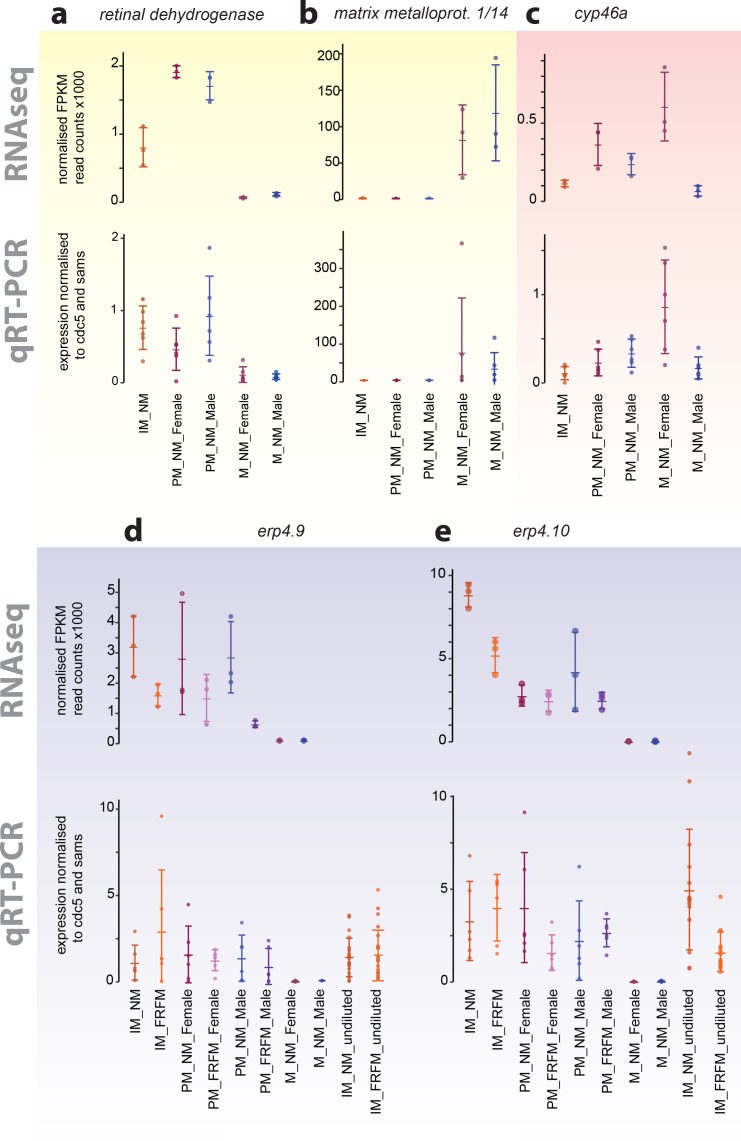
Figure 4—figure supplement 1. Exemplary validation of additional transcripts differentially expressed during maturation, between sexes or between circalunar clock phases:

Figure 4—figure supplement 1.

(a,b) yellow- identified as maturation regulated; (c) light red- identified as sex-biased regulated; (d,e) light blue- identified as circalunar phase regulated. Note that for circalunar phase regulated transcripts verification by qPCR needs a higher cDNA amount input than for the tested maturation and sex-specific regulated transcripts. The graphs show the arithmetic mean with standard deviation, together with individual data points. Further details see Figure 4 (legend) and Materials and methods.