

Summary:
The non-hematopoietic cell fraction of the bone marrow (BM) is classically identified as CD45− Ter119− CD31− (herein referred to as triple-negative cells or TNCs). Although TNCs are believed to contain heterogeneous stromal cell populations, they remain poorly defined. Here we showed that the vast majority of TNCs (~85%) have a hematopoietic rather than mesenchymal origin. Single cell RNA-sequencing revealed erythroid and lymphoid progenitor signatures among CD51− TNCs. Ly6D+ CD44+ CD51− TNCs phenotypically and functionally resembled CD45+ pro-B lymphoid cells, whereas Ly6D− CD44+ CD51− TNCs were enriched in previously unappreciated stromal-dependent erythroid progenitors hierarchically situated between preCFU-E and proerythroblasts. Upon adoptive transfer, CD44+ CD51− TNCs contributed to repopulate the B-lymphoid and erythroid compartments. CD44+ CD51− TNCs also expanded during phenylhydrazine-induced acute hemolysis or in a model of sickle cell anemia. These findings thus uncover physiologically relevant new classes of stromal-associated functional CD45− hematopoietic progenitors.
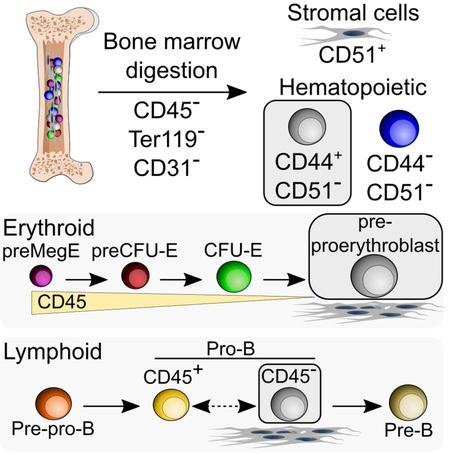
Graphical Abstract
eTOC Blurb
Bone marrow triple-negative CD45− Ter119− CD31− cells are thought to contain heterogeneous stromal cell populations. Boulais et al. show these cells are mostly hematopoietic in origin and contain previously unappreciated stromal-associated erythroid and B-lymphoid progenitor populations.
Bone marrow (BM) stromal cells forming the non-hematopoietic fraction are classically isolated by negative selection using the combination of CD45, Ter119 and CD31 markers (Mendez-Ferrer et al., 2010; Morikawa et al., 2009; Omatsu et al., 2010; Park et al., 2012; Schepers et al., 2012; Worthley et al., 2015; Zhou et al., 2014). CD45 is a type I transmembrane molecule reported on the surface of all nucleated hematopoietic cells and their precursors (Penninger et al., 2001), except for erythroid cells which are excluded by the expression of Ter119, an antigen associated with glycophorinA found in the early mouse proerythroblast to mature erythrocyte stage (Kina et al., 2000). Following endothelial cell exclusion (using CD31 or Tie2 expression), the non-hematopoietic cell fraction (hereafter referred to as CD45− Ter119− CD31− triple-negative cells or TNCs) represents ~0.5% of the mouse adult BM cellularity, and comprises a population of stromal cells currently thought to be derived from mesenchymal precursors (Mizoguchi et al., 2014; Park et al., 2012; Pinho et al., 2013; Worthley et al., 2015; Zhou et al., 2014).
The phenotype of murine BM mesenchymal-derived stem cells (MSCs) or skeletal stem cells (SSCs) has been defined by several recent studies. In the developing marrow (embryonic day 15.5), a population of progenitors with the surface markers CD45− Tie2− CD51+ CD105+ Thy1.1− can form endochondral bone and marrow cavity when implanted under the kidney capsule (Chan et al., 2009). In the adult BM, stromal cells marked by Nestin-GFP contain all colony-forming units-fibroblast (CFU-F) activity or sphere-forming activity detectable in the BM cavity (Mendez-Ferrer et al., 2010). These Nestin-GFP+ cells associate with hematopoietic stem cells (HSCs) and express high amounts of HSC niche factors, suggesting that they form an HSC niche (Mendez-Ferrer et al., 2010) that highly overlaps with leptin receptor (Lepr)-expressing stromal cells and Cxcl12-abundant reticular (CAR) cells (Asada et al., 2017; Ding et al., 2012; Kunisaki et al., 2013; Pinho et al., 2013; Sugiyama et al., 2006). Cell surface receptors PDGFRα and CD51 mark most Nestin-GFP+ BM MSCs (Pinho et al., 2013). Compact bone contains much higher CFU-F activity than the marrow cavity (Pinho et al., 2013; Short et al., 2009), and these bone-associated MSCs express Sca-1 and PDGFRα (Morikawa et al., 2009). In addition, high CFU-F activity has also been described in bone-associated stromal cells expressing Gremlin-1 (Worthley et al., 2015) or CD200 (Chan et al., 2015). Lineage-tracing studies have revealed the presence of endogenous osteoprogenitors (Park et al., 2012), mesenchymal-derived stem cells that possess trilineage differentiation capacity (Mizoguchi et al., 2014; Zhou et al., 2014) or bone-associated SSCs deprived of adipocyte potential (Chan et al., 2015; Worthley et al., 2015), confirming an important role for distinct MSC or SSC populations in bone and stromal regeneration.
Owen and Friedenstein suggested three decades ago that non-hematopoietic BM stromal cells may be organized hierarchically in a manner as complex as the hematopoietic tree (Owen and Friedenstein, 1988). While some progress has been accomplished to define the stromal hierarchical tree (Chan et al., 2015), much of the non-hematopoietic BM fraction remains undefined. If non-hematopoietic cells originated from a common progenitor, we would expect that all BM stroma would descend from a definitive mesenchymal-derived precursor. Here, we analyzed the TNC population and show that the majority of TNCs are derived from HSCs and contain stromal-dependent CD45− B-lymphoid and erythroid progenitors.
RESULTS
Bone marrow TNCs are largely derived from HSCs
To trace the mesenchymal lineage in the bone marrow, we intercrossed transgenic lines expressing Cre recombinase driven by neural-glial antigen-2 (NG2) (Asada et al., 2017), Lepr (Ding et al., 2012) or Osterix (Osx) (Nakashima et al., 2002) with the ROSA26-loxP-stop-loxP-tdTomato reporter (iTdTomato). Constitutive NG2 or Lepr-mediated expression labeled a minor fraction (<20%) of TNCs (Figures 1A and 1B). Conditional tamoxifen-induced labeling of Osx-expressing cells at postnatal day 5 which was shown to mark long-lived BM MSCs (Mizoguchi et al., 2014), also labeled a small subset of TNCs (<3%; Figure 1B). By contrast, constitutive Csf1r-iCre, Tie2-Cre and Vav1-iCre which can drive expression in hematopoietic and endothelial cells labeled most TNCs (59 to 69%; Figure 1C). We further probed the heterogeneity among TNCs by evaluating in more detail the expression of a wide range of surface markers by fluorescence-activated cell sorting (FACS). These analyses revealed expression of hematopoietic markers such as CD24, CD43, CD44, CD71 and CD105 in the majority of TNCs (40 to 60%; Figure S1A), indicating heterogeneity in the TNC population in bone marrow.
Figure 1. The majority of TNCs are hematopoietic cells.

(A)Representative FACS plots showing the percentage of iTdTomato+ TNCs isolated from NG2-Cre;iTdTomato.
(B)Percentage of marked TNCs in mesenchymal cell-selective labeling models. n=40-11 mice per group.
(C)Percentage of marked TNCs in non-selective labeling models. n=3-5 mice per group.
(D)Experimental design to determine the percentage of host and donor-derived TNCs in the bone marrow after transplantation of wild-type bone marrow in irradiated (IR) or non-irradiated (Non-IR) ROSA26-ACTB-tdTomato-EGFP (Rosa26mTmG) mice recipients that ubiquitously express the fluorescent reporter iTdTomato.
(E)Frequency of donor-derived cells within the CD45+/Ter119+ hematopoietic fraction of mice treated as in D. Donor chimerism was calculated by the frequency of unlabeled wild-type cells transplanted into iTdTomato+ mice. n=6 mice per group.
(F)Frequency of donor-derived cells within TNCs of mice treated as in D. n=6 mice per group.
(G)Percentage of colony-forming fibroblast (CFU-F) activity that originated from host or donor TNCs in transplanted mice. CFU-F assays was performed by sorting host (iTdTomato+) and donor (iTdTomato−) TNCs and seeding 1–3×10³ cells per well. n=6 mice per group.
(H)Frequency of donor-derived cells within the CD51 and PDGFRα TNC fractions of mice as treated in D. n=6 mice per group.
(I)Cell surface marker expression on host iTdTomato+ TNCs after transplantation as depicted in D. n=6 mice per group.
(J)Percentage of donor-derived (iTdTomato−) TNCs within CD44 and/or CD51 expressing fraction after transplantation of wild-type bone marrow into lethally irradiated Rosa26mTmG mice. (n=6 mice per group).
Statistical significance was assessed using two-tailed t-test (E-G), one-way ANOVA followed by Tukey’s multiple comparison test (H, J), two-way ANOVA followed by Sidak multiple comparison test (I) *P ≤ 0.05, **P ≤ 0.01, ***P ≤ 0.001, ****P ≤ 0.0001. Data are represented as mean ± SEM from at least 2 independent experiments.
See also Figure S1.
Although non-hematopoietic BM stromal cells are generally considered non-transplantable (Simmons et al., 1987), recent studies have suggested that fresh stromal cells may engraft the BM of lethally irradiated recipients (Morikawa et al., 2009; Park et al., 2012; Zhou et al., 2014). We used a transplantation strategy to define TNCs by transplantation of wild-type unlabeled BM into irradiated and non-irradiated ROSA26-ACTB-tdTomato-EGFP (Rosa26mTmG) mice that constitutively express the fluorescent reporter iTdTomato (Figure 1D). Both the hematopoietic (CD45+ or Ter119+) and TNC fractions were highly replaced by donor cells (95% and 89%, respectively) 4 months after transplantation of lethally irradiated recipients (Figures 1E and 1F). We next evaluated CFU-F activity by sorting donor (iTdTomato−) or host (iTdTomato+) TNCs from transplanted mice. These analyses revealed that CFU-F activity was exclusively derived from host TNCs (Figure 1G) and confirmed that CFU-Fs were not transplantable.
Since CD51 and PDGFRα have been reported to mark Nestin-GFP+ MSCs in mouse BM (Pinho et al., 2013), we assessed their expression among donor and host TNCs. As expected, PDGFRα+ CD51+ TNCs were highly enriched in the non-transplantable fraction whereas the vast majority of PDGFRα− CD51− TNCs (90%) were derived from the donor (Figure 1H). Analysis of CD51 and CD44 expression in host-derived TNCs before and after WT transplantation revealed that CD44+ cells (and to a lesser extent CD105) were highly replaced by donor cells after transplantation while CD51 expression and other stromal markers (PDGFRα and Lepr) were largely derived from the host (Figures 1I and 1J). These results suggest that CD44 and CD51 expression could discriminate host from donor-derived TNCs.
Differential expression of CD44 and CD51 distinguishes mesenchymal- from HSC-derived TNCs
We thus evaluated CD44 and CD51 expression among steady-state TNCs (i.e. not transplanted) to characterize stromal cell subsets. We determined the optimal enzymatic concentration needed to maximize recovery yield for all TNC subsets. After optimal enzymatic BM cell dissociation (collagenase IV 2 mg/mL and dispase 1 mg/mL), TNC recovery was markedly increased compared to flushed BM (Figures S1B-S1D). CD44+ CD51− and CD44− CD51− cells accounted for 87% of TNCs (Figures 2A and 2B). The TNC markers (CD45, Ter119, and CD31) as well as CD51 were not sensitive to enzymatic cell dissociation while CD44 staining was affected by enzymatic treatment (Figures S1E and S1F). Since CD51+ CD44+ cells accounted for < 1% of TNCs and were largely host-derived (Figure 1J), we have lumped total CD51+ TNCs as single fraction in further analyses (Figures 2A-2C). Giemsa staining of cytospun sorted cells showed that CD44+ CD51− TNCs have a blast-like morphology with high nucleus/cytoplasm ratio and large size, whereas CD44− CD51− TNCs were smaller in size (Figure S1G). Remarkably, cell cycle analysis revealed that CD44+ CD51− and CD44− CD51− TNCs were highly proliferative as determined by Ki-67 expression (~92% and ~71% Ki-67+, respectively) while by contrast, CD51+ TNCs were largely quiescent (~6% Ki-67+; Figures 2D and 2E). In addition, CD51+ TNCs expressed most niche factor activity compared to the two other cell fractions (Figure 2F). Consistent with their mesenchymal origin, CFU-F activity was restricted to CD51+ TNCs and undetectable in CD44+ CD51− or CD44− CD51− cells (Figure 2G). Lineage-tracing experiments from Osx-marked BM MSCs revealed that the labeling was restricted to CD51+ TNCs (Figures 2H and 2I). In addition, Nestin-GFP, NG2-Cre and Lepr-Cre largely labeled the CD51+ TNC fraction (Figures S2A-C, S2G, and S2H). By contrast, when Cre recombinase was driven by promoters known to mark hematopoietic cells such as Csf1r-iCre, Tie2-Cre or Vav1-iCre (Figures S2D-H), TNCs were labeled with a dimmer iTdTomato signal than CD51+ cells and were located mostly within the CD44+ CD51− fraction. These results provide compelling evidence that the majority of BM cells in the CD45− Ter119− CD31− “stroma” have a hematopoietic, rather than mesenchymal, origin.
Figure 2. CD44 and CD51 expression in TNCs separates bona fide stromal cells from hematopoietic-derived TNCs.

A-C) Representative FACS plots (A), absolute (B) and relative (C) numbers of CD44 and/or CD51 expressing TNCs in enzymatically digested bone marrow. n=5 mice per group.
(D and E) Cell cycle analyses of TNCs by FACS using anti-Ki-67 and Hoescht 33342. Representative plots (D) and quantification (E) are shown. n=7-8 per group.
(F)Niche factor gene expression in sorted TNCs expressing CD44 and/or CD51 by qPCR. n=6-9 mice per group.
(G)CFU-F activity in TNC subsets. n=5 mice per group.
(H)Percentage of iTdTomato+ hematopoietic (CD45+/Ter119+) cells and TNCs from Osx-CreERT2;iTdTomato mice induced at post-natal day 5 and analyzed after 15 weeks of chase. Right panel shows TNC fractions. n=5 mice per group.
(I)Whole-mount image of sternal bone marrow from Osx-CreERT2;iTdTomato mice 15 weeks after tamoxifen injection at post-natal day 5 and stained with anti-CD44, anti-CD31 and anti-CD144 (VE-Cadherin) antibodies. Scale bar: 10 μm.
Statistical significance was assessed using one-way ANOVA followed by Tukey’s multiple comparison test (B, C, F, G), two-way ANOVA followed by Sidak multiple comparison test (E) and two-tailed t test (H). *P ≤ 0.05, **P ≤ 0.01, ***P ≤ 0.001, ****P ≤ 0.0001. Data are represented as mean ± SEM from at least 2 independent experiments.
See also Figures S1 and S2.
HSC-derived CD44+ CD51− TNCs exhibit erythroid and B-lymphoid gene signatures
To evaluate directly whether TNCs can indeed be derived from HSCs or progenitors, we sorted HSCs (Lineage (Lin)− Sca-1+ c-Kit+ CD135− CD48− CD34− CD150+) or multipotent progenitors (MPP1, Lin− Sca-1+ c-Kit+ CD135− CD48− CD34+ CD150+; MPP2, Lin− Sca-1+ c-Kit+ CD135− CD48+ CD34+ CD150+; MPP3, Lin− Sca-1+ c-Kit+ CD135− CD48+ CD34+ CD150−; MPP4, Lin− Sca-1+ c-Kit+ CD135+ CD48+ CD34+ CD150−) from Rosa26mTmG mice and assessed whether they could reconstitute TNCs after transplantation (Figure 3A). We found that HSCs and MPP1/2 efficiently repopulated CD44+ CD51− TNCs 2 weeks after transplantation (Figures Figures 3B-3D), whereas MPP3/4 mostly repopulated CD44− CD51− TNCs (Figures 3E and 3F). These results support the notion that two major subsets of TNCs, encompassing nearly >85% of the canonical “stromal” gating strategy, have a hematopoietic origin.
Figure 3. CD51− TNCs are generated upon HSPC transplantation and display erythroid and lymphoid gene signatures.

(A)Experimental design to assess bone marrow reconstitution of TNCs by hematopoietic stem and progenitor cells (HSPCs). iTdTomato+ HSPC populations (250 HSCs; Lin− Sca-1+ c-Kit+ CD34− CD135− CD48− CD150+, 250 MPP1; Lin− Sca-1+ c-Kit+ CD34+ CD135− CD48− CD150+, 250 MPP2; Lin− Sca-1+ c-Kit+ CD34+ CD135− CD48+ CD150+, 1,500 MPP3; Lin− Sca-1+ c-Kit+ CD34+ CD135− CD48+ CD150−, 2,000 MPP4; Lin− Sca-1+ c-Kit+ CD34+ CD135+ CD48+ CD150−) were isolated from Rosa26mTmG mice and transplanted individually into lethally irradiated (12Gy) wild-type recipients. Percentage of donor TNCs was assessed by iTdTomato expression in bone marrow TNCs 2 weeks post-transplantation.
(B-F) Frequency of donor-derived TNCs in mice transplanted with HSC (B), MPP1 (C), MPP2 (D), MPP3 (E) and MPP4 (F). n=6-8 mice per group.
(G, H) RNA sequencing from single TNC. T-distributed stochastic neighbor embedding (t-SNE) map representation of transcriptome similarities represented by cluster 1 (blue), cluster 2 (black; erythroid progenitors), cluster 3 (pink), cluster 4 (green; B-cell progenitors), cluster 5 (purple; granulocytes), cluster 6 (light blue; erythroblasts), cluster 7 (yellow; stromal cells), cluster 8 (red), cluster 9 (brown) (G) and t-SNE map representation showing the origin of single cells within each cluster (H) where gray= CD44+ CD51− TNCs and blue= CD44− CD51− TNCs. Single cells from 2 independent sorting experiments.
Statistical significance was assessed using one-way ANOVA followed by Tukey’s multiple comparison test (B-F) *P ≤ 0.05, **P ≤ 0.01, ***P ≤ 0.001, ****P ≤ 0.0001. Data are represented as mean ± SEM from at least 2 independent experiments.
See also Figures S3, S4 and Tables S1-S3.
To confirm their origin and evaluate further the nature of HSC-derived TNCs, we compared the transcriptome of CD44+ CD51− TNCs (the subpopulation that presented the highest donor chimerism in transplantation experiments, Figure 1J), with that of CD51+ TNCs. These analyses showed that CD51+ TNCs were highly enriched, as expected, in niche-associated genes such as Cxcl12, Spp1, Kitl, Pdgfrα, Il7, Cspg4, Runx2, while the expression of these genes was negligible in CD44+ CD51− TNCs (Figure S3A; Tables S1 and S2). CD44+ CD51− TNCs have high expression of hematopoietic genes (Figure S3A; Table S2), especially erythroid genes, such as Klf1, Gata1 and Gfi1b (Hattangadi et al., 2011). We evaluated further the expression of these genes in TNCs by qPCR, in comparison with established erythroid progenitors including CFU-E (Lin− Sca-1− c-Kit+ CD41− CD16/32− CD105+ CD150−), pre-CFU-E (Lin− Sca-1− c-Kit+ CD41− CD16/32− CD105+ CD150+) and preMegE (Lin− Sca-1− c-Kit+ CD41− CD16/32− CD105− CD150+) (Pronk et al., 2007). We found that Klf1, Gata1 and Gfi1b expression was similar between CD44+ CD51− TNCs and bona fide erythroid progenitors (Figure S3B). Expression of genes associated with mature erythroid progeny (RhD, Epor) were found to be expressed at higher levels in CD44− CD51− TNCs than in the other cell populations (Figure S3B, bottom panels). Principal component analysis of CD44+ CD51− and CD51+ TNCs with murine erythroblasts (An et al., 2014) revealed that CD44+ CD51− TNCs clustered close to proerythroblasts whereas CD51+ TNCs clustered away from all cell populations (Figure S3C). These results were confirmed by hierarchical clustering showing the distinct profile of CD51+ TNCs while CD44+ CD51− TNCs were close to early erythroblast populations (Figure S3D). To dissect further the heterogeneity of hematopoietic-derived TNCs, we carried out single-cell RNA-Seq analysis of CD51− TNCs using a recently described approach to identify cell populations by cluster-specific upregulation of marker genes (Grun et al., 2016). Our analysis revealed the presence of erythroid progenitors (cluster 2) which represented > 38% of all cells analyzed while B-cell progenitors (cluster 4), granulocytes (cluster 5), erythroblasts (cluster 6) and stromal cells (cluster 7) were also detected (Figures 3G, 3H, S4A, and S4B; Table S3) as confirmed by cluster-specific gene expression (Figures S4C-I). Interestingly, CD44+ CD51− TNCs were mostly identified as erythroid progenitors (cluster 2) while CD44− CD51− TNCs were distributed among the clusters (Figure 3H). Index sorting analysis of cell clusters from single-cell RNAseq (Figures 3G and 3H) confirmed that CD44 was expressed at higher levels in erythroid progenitors (cluster 2) and B-cell progenitors (cluster 4) compared with stromal cells (cluster 7) from CD51− TNCs (Figure S4J). Therefore, excluding CD44+ CD51− cells from TNCs by flow cytometry would significantly enrich for bone marrow stromal cells (Figure S4K). These data suggest heterogeneity among HSC-derived TNCs, of which the erythroid and B-lymphoid signatures appear more prominent.
TNCs contain stromal-dependent erythroid and B-lymphoid progenitors
To assess the differentiation capacities of HSC-derived CD44+ CD51− and CD44− CD51− TNCs, we sorted TNC populations and evaluated their ability to form colonies in culture. While CD44− CD51− TNCs did not exhibit any colony-forming activity (Table 1), CD44+ CD51− TNCs were able to generate pre-B colonies, supporting the idea that this fraction contains B-lymphoid progenitors (Table 1). Both CD44+ CD51− and CD44− CD51− TNCs presented no or very low burst-forming unit-erythroid (BFU-E) and colonyforming units-erythroid (CFU-E) activity, in contrast to sorted erythroid progenitors (Table 1). Therefore, we assessed whether sorted TNCs would perform better when plated in the presence of BM-derived stromal cells (Figure 4A). We found that both CD44+ CD51− and CD44− CD51− TNCs generated B cells, whereas only CD44+ CD51− TNCs were able to generate erythroid cells (Figures 4B and 4C). Erythroid expansion of CD44+ CD51− TNCs was significantly increased in the presence of stromal cells and reached levels comparable to sorted CFU-E (Figures 4B-F). The viability of CD44+ CD51− TNCs was also increased when cultured with BM stromal cells (Figures S5A-E). We crossed Lepr-Cre mice with transgenic mice expressing an inducible diphtheria toxin receptor (iDTR) receptor to further evaluate the dependence of CD44+ CD51− TNCs on stromal cells. Administration of DT to deplete BM stromal cells reduced, as expected, the number of Lepr+ cells which overlap with CD51+ TNCs (Figure S5F-H). In addition, the number of CD44+ CD51− TNCs were also significantly reduced 1 week after DT administration whereas the number of CD44− CD51− TNCs or CD45+ erythroid progenitors were not significantly altered (Figure S5G-I).
Table 1 –
Colony-forming activity of CD51− TNCs
| Colony assay | Cell population | Colony-forming activity per 103 cells ± SEM | n |
|---|---|---|---|
| CFU-C | CD44+ CD51− TNCs | 0.0 ± 0.0 | 5 |
| CD44− CD51− TNCs | 0.0 ± 0.0 | 5 | |
| LSK | 35.6 ± 13.9 | 5 | |
| BFU-E | CD44+ CD51− TNCs | 0.0 ± 0.0 | 6 |
| CD44− CD51− TNCs | 0.0 ± 0.0 | 6 | |
| CFU-E | 0.0 ± 0.0 | 5 | |
| preCFU-E | 2.0 ± 1.4 | 5 | |
| preMegE | 9.8 ± 2.9 | 5 | |
| CFU-E | CD44+ CD51− TNCs | 0.6 ± 0.4 | 5 |
| CD44− CD51− TNCs | 0.0 ± 0.0 | 5 | |
| CFU-E | 13.4 ± 1.2 | 5 | |
| preCFU-E | 4.2 ± 3.1 | 5 | |
| preMegE | 0.0 ± 0.0 | 5 | |
| CFU pre-B | CD44+ CD51− TNCs | 6.2 ± 1.9 | 6 |
| CD44− CD51− TNCs | 0.0 ± 0.0 | 6 | |
| CD11b− Gr-1− CD3ε− | 1.1 ± 0.1 | 6 | |
| Ter119− B220+ | |||
Cell populations were sorted (500-2,000 cells) from C57BL/6 mice bone marrow and plated in methylcellulose (Stem Cell Technologies, Cat#: 3434 (CFU-C), Cat#: 3436 (BFU-E), Cat#: M3334 (CFU-E) Cat#: 3630 (CFU pre-B + 25ng/mL SCF)) and incubated for 7 days (BFU-E, CFU pre-B) or 2-3 days (CFU-E) at 37°C in 5% CO 2. CFU-C, colony-forming unit-cell; BFU-E, burst-forming unit-erythroid; CFU-E, colonyforming unit-erythroid; TNCs: CD45− Ter119− CD31− cells; CFU-E cell population: Lin− Sca-1− c-Kit+ CD41− CD16/32− CD105+ CD150−; pre-CFU-E cell population: Lin− Sca-1− c-Kit+ CD41− CD16/32− CD105+ CD150+; preMegE: Lin− Sca-1− c-Kit+ CD41− CD16/32− CD105− CD150+). LSK: Lineage− (B220−, CD11b−, Gr-1−, CD3ε− and Ter119−) Sca-1+ c-Kit+.
Figure 4. TNCs differentiate into erythroid and lymphoid cells in the presence of stromal cells.

(A) Experimental design to determine the lineage potentials of erythroid progenitors isolated from flushed BM and TNCs from digested BM of Rosa26mTmG mice. Sorted cells were plated at a density of 500-2,500 cells/well in liquid culture with cytokines (stem cell factor, IL-3, IL-6, erythropoietin, thrombopoietin; 25ng/mL each) in the absence or presence of BM-derived stromal cells for 24h and 48h.
(B-F) Myeloid (CD11b+/Gr1+), B lymphoid (B220+), T lymphoid (CD4+/CD8+), Erythroid (Ter119+), and megakaryocyte (FSCHi CD41+) lineage potential of sorted iTdTomato+ CD44+ CD51− TNCs (B), CD44− CD51− TNCs (C), CFU-E (D) preCFU-E (E) and preMegE (F). Cell numbers for each population were normalized as a percentage of total cell plated per well (% of cells plated). n=5-6 mice in two independent sorting experiments.
(G, H) Erythroid maturation of CD44+ CD51− TNCs and erythroid progenitors assessed by erythroblast generation in vitro. (G) Representative FACS plot showing iTdTomato+ erythroblasts (CD45− CD11b− Ter119+) based on CD44 expression and size (forward scatter or FSC). (H) Frequencies of erythroblast populations generated by CD44+ CD51− TNCs and erythroid progenitors. n=5-6 mice in two independent sorting experiments.
(I)Lineage potentials of sorted Ly6D+ CD44+ CD51− TNCs and Ly6D− CD44+ CD51− TNCs from BM and plated in co-culture with BM-derived stromal cells for 48h. n=7 mice per group in two independent cell sorting experiments.
(J)Representative FACS plots showing lymphoid maturation of Ly6D+ CD44+ CD51− TNCs and B-lymphoid progenitors (pre-pro-B; B220+ IgM− CD24− CD43+, pro-B; B220+ IgM− CD24+ CD43+ and pre-B; B220+ IgM− CD24+ CD43−) isolated from BM and plated in co-culture with BM-derived stromal cells for 48h. n=6 mice per group in two independent cell sorting experiments.
Statistical significance was assessed using one-way ANOVA followed by Tukey’s multiple comparison test (B-F, I) *P ≤ 0.05, **P ≤ 0.01, ***P ࣘ 0.001 ****P ≤ 0.0001. Data are represented as mean ± SEM.
Flow cytometry analysis of erythroid maturation after 48h of culture in the presence of stromal cells confirmed that CD44+ CD51− TNCs generated mostly late erythroblast (iii, iv and v) populations (Figures 4G and 4H). Early erythroblasts (i, ii) were gradually increased from CFU-E to preMegE (Figures 4G and 4H) suggesting they are located upstream of CD44+ CD51− TNCs. As Ly6D was reported to label B-lymphoid progenitors in the BM (Inlay et al., 2009), we tested whether it could help to discriminate lymphoid from erythroid TNCs. We cultured Ly6D− CD44+ CD51− and Ly6D+ CD44+ CD51−TNCs in the presence of BM-derived stromal cells with hematopoietic cytokines for 48h and evaluated the capacity to generate myeloid, lymphoid, erythroid and megakaryocytic cell lineages. Remarkably, the Ly6D− CD44+ CD51−TNC fraction exclusively gave rise to Ter119+ erythroid cells while Ly6D+ CD44+ CD51− TNCs produced only B220+ B cells (Figure 4I). To evaluate the hierarchical position of Ly6D+ CD44+ CD51− TNCs among B-lymphoid progenitors, we compared their maturation profile with CD45+ classical B-cell progenitors fractionated by CD24 and CD43 expression (Figure S6A, pre-pro-B; B220+ IgM− CD24− CD43+, pro-B; B220+ IgM− CD24+ CD43+ and pre-B; B220+ IgM− CD24+ CD43−). Our data revealed that Ly6D+ CD44+ CD51− TNCs expressed pro-B cell markers (CD24+CD43+) and matured like classical CD45+ CD24+ CD43+ pro-B cells in co-culture with BM-derived stromal cells (Figure 4J; Figure S6B).
To ascertain whether the erythroid and B-lymphoid progenitor activities were derived from distinct progenitors, we bred Epor-iCre knock-in mice with the iTdTomato reporter mouse to label erythroid progenitors (Heinrich et al., 2004), and sorted 2,304 single CD44+ CD51− TNCs which were then cultured on bone marrow-derived stromal cells in the presence of hematopoietic cytokines (stem cell factor, IL-3, IL-6, IL-7, erythropoietin, thrombopoietin; Figure 5A). Erythroid contribution from single CD44+ CD51− TNCs was assessed after 2 days of co-culture by the presence of iTdTomato+ colonies while the generation of B-lymphoid cells was evaluated in the same wells after 1 week of co-culture by FACS (B220+ cells; Figure 5A). We found that 23.1% of CD44+ CD51− TNCs were able to generate Epor+ erythroid colonies and 1.4% of plated single cells generated B-cell progeny under these conditions (Figures 5B and 5C). We observed no occurrence of single TNCs producing both erythroid and B-lymphoid progeny, confirming that the progenitor activity emerged from distinct cells (Figures 5B and 5C). Index sorting analysis confirmed that the Epor and Ly6D expression segregated in erythroid and B-lymphoid progenitors, respectively (Figure 5D). Indeed, the vast majority (83.8%) of Ly6D− CD44+ CD51− TNCs were marked by iTdTomato in Epor-iCre mice whereas Ly6D+ CD44+ CD51− TNCs were iTdTomato− (Figure S6C). These results indicate that CD44+ CD51− TNCs contains at least two distinct progenitors capable of erythroid or lymphoid differentiation.
Figure 5. CD44+ CD51− TNCs contain two distinct progenitor populations.

(A) Experimental design to assess the heterogeneity of CD44+ CD51− TNCs at the single-cell level. Single CD44+ CD51− TNCs were sorted from digested BM of Epor-iCre;iTdTomato mice and seeded on BM-derived stromal cells in 384-well plates containing co-culture media with cytokines (stem cell factor, IL-3, IL-6, IL-7 erythropoietin, thrombopoietin; 25ng/mL each). After 2 days, contribution to the erythroid lineage was assessed by the presence of iTdTomato+ colonies. After 1 week, cells within each well were stained for lineage markers and B-lymphoid contribution (B220+ cells) was assessed by FACS. Scale bar represents 20 μm.
(B)384-well plate map (2,304 wells) scored for erythroid (red), B lymphoid (blue), dual erythroid/B-lymphoid (green), or no colony-forming activity (white).
(C)Lineage output frequency of single CD44+ CD51− TNCs as described in (B)
(D)Normalized expression of iTdTomato (top panel) and Ly6D (bottom panel) based on index sorting values of single CD44+ CD51− TNCs that were positive for erythroid or B-lymphoid output. Mean index values of control cells (iTdTomato− or Ly6D−) were used for normalization. n=33 for B-lymphoid, n=533 for erythroid colonies and n=382 for negative controls.
Statistical significance was assessed using one-way ANOVA followed by Tukey’s multiple comparison test (D) *P ≤ 0.05, ****P ≤ 0.0001. Box and whisker plots display the median, 25th, and 75th percentile of the distribution (box), and whiskers extend to the minimum and maximum data point. Grubbs test (α = 0.05) was used to identify outliers.
See also Figures S6.
TNCs repopulate the B-lymphoid and erythroid compartments in vivo
At the steady state, erythroid TNC progenitor numbers are comparable to CFU-E (Figure S7A; left panel) while the proportion of lymphoid TNCs is lower than B-lymphoid progenitors (Figure S7A; right panel). To assess their in vivo contribution, we sorted TNCs from UBC-GFP mice [allowing detection of RBC reconstitution (Schaefer et al., 2001)], and transplanted them into lethally irradiated mice. Donor chimerism 1-week post-transplantation revealed the presence of circulating RBCs in mice transplanted with CD44+ CD51− TNCs whereas no donor RBCs were detected from mice transplanted with CD44− CD51− TNCs (Figures 6A and 6B). Interestingly, CD51− TNCs repopulated the B lymphoid compartment in the bone marrow, whereas CD44+ CD51− TNCs generated mostly erythroid or megakaryocytic cells in the spleen (Figures 6C and 6D). Transplantation of either preCFU-E or preMegE populations gave rise to higher chimerism than TNCs and were able to reconstitute the CD44+ CD51− TNC population, suggesting that they may lie upstream in the hematopoietic hierarchy (Figure 6E). These data further support the contribution of TNCs in the generation of erythroid or B lymphoid cells.
Figure 6. CD44+ CD51− TNCs contribute to stress erythropoiesis in vivo.

(A-E) Contributions of sorted TNCs (20,000 CD44+ CD51− TNCs and 10,000 CD44− CD51− TNCs) or erythroid progenitors (20,000 CFU-E, 5,000 preCFU-E and 5,000 preMegE) from UBC-GFP transgenic mice after transplantation in lethally irradiated recipients. (n = 5-9 mice per group). Representative FACS plot (A) and quantification (B), showing donor-derived RBC chimerism in transplanted mice. Myeloid, B-lymphoid T-lymphoid, erythroid and megakaryocyte chimerism in bone marrow (C) or spleen (D), showing that TNCs give rise to B-lymphoid cells in bone marrow whereas they colonize the spleen to give rise to erythroid progenitors. Donor chimerism of bone marrow TNCs
(E), showing that preMegE and preCFU-E are upstream of TNCs in the hematopoietic hierarchy.
(F-I) TNC response after phenylhydrazine (PHZ)-induced acute hemolysis. Mice were treated with PHZ 40mg/kg for two consecutive days (day 0 and day 1) and analyzed on day 2 and day 4. n=5-10 mice per group. Representative FACS plot (F) and quantification (G-I) showing TNC counts per femur during PHZ treatment.
(J-M) Analyses of TNCs in Berkeley sickle cell mice (Tg[Hu-miniLCα1GγAγδβS]Hba−/− Hbb−/−), referred to as SCD mice, and control hemizygous mice (Tg[Hu-miniLCRα1GγAγδβS]Hba−/− Hbb+/−), referred to as SA mice. Representative FACS plot (J) and quantification (K-M) showing TNC counts per femur in SA and SCD mice. n=7-8 mice per group from 2 independent experiments.
Statistical significance was assessed using one-way ANOVA followed by Tukey’s multiple comparison test (B, G-I) and two-tailed t test (K-M). *P ≤ 0.05, **P ≤ 0.01, ***P ≤ 0.001 ****P ≤ 0.0001. Data are represented as mean ± SEM from at least 2 independent experiments.
See also Figure S7.
To evaluate the TNC function in pathological conditions, we assessed TNC numbers in BM of mice with acute hemolysis or a chronic hemoglobinopathy. Following the injection of the hemoglobin-oxidizing agent phenylhydrazine (PHZ) to induce acute hemolytic anemia, we found that the number of CD44+ CD51− TNCs significantly expanded 2 days after PHZ injection (Figure 6F-I) whereas CD45+ erythroid populations expanded only 4 days after treatment (Figure S7A-D). Furthermore, the numbers of CD51+ or CD44− CD51− TNCs remained unchanged during PHZ treatment (Figures 6F-I). In addition, we also challenged mice with sublethal irradiation (4 Gy) which induces stress erythropoiesis during the recovery period. Irradiation-induced stress erythropoiesis expanded by 10-fold the number of CD44+ CD51− TNCs in contrast with other erythroid progenitor populations that showed limited recovery 6 days after irradiation (Figures S7E-J). Furthermore, we analyzed the bone marrow of humanized mice with sickle cell disease (SCD) which have severe chronic anemia (Paszty et al., 1997). SCD mice also exhibited a significant elevation of CD44+ CD51−, but not CD51+ or CD44− CD51−, TNCs, compared to hemizygous (SA) animals (Figures 6J-M). The expansion of CD44+ CD51− TNCs in both acute and chronic anemias further supports their important role as erythroid precursor cells involved in stress erythropoiesis.
Discussion
Here, we show that most cellular constituents among CD45− Ter119− CD31− bone marrow cells were HSC-derived elements. Single-cell transcriptomic and functional analyses allowed us to probe TNC heterogeneity and uncovered the presence of distinct CD45− B-lymphoid and erythroid progenitor populations, whose activity was enhanced by BM stromal cells. Further, our results suggest that Ly6D expression can separate B-lymphoid- (Ly6D+) from erythroid- (Ly6D−) producing progenitors among HSC-derived CD44+ CD51− TNCs.
While recent efforts have focused to isolate prospectively bone marrow MSCs or SSCs among non-endothelial CD45− stroma using various phenotypes such as CD146+ (human BM), CD51+ CD105+ Thy1.1− (fetal BM), Nestin-GFP+, Sca-1+ PDGFRα+, CD51+ PDGFRα+, Lepr+, CD51+ CD200+ Thy1.1− 6C3−, Gremlin+ (Chan et al., 2009; Chan et al., 2015; Mendez-Ferrer et al., 2010; Morikawa et al., 2009; Sacchetti et al., 2007; Worthley et al., 2015; Zhou et al., 2014), there has been little information about the composition of others cells forming the non-hematopoietic BM TNC “stroma”. That transgenic lines marking BM mesenchymal-derived stem cells at the perinatal stage (Osx-CreERT2, Lepr-Cre, or NG2-Cre), would label a minor fraction (10-20%) of the CD45− Ter119− CD31− population indicates that most TNCs descend from another precursor. Our results indeed revealed that the majority of TNCs are HSC-derived and that significant enrichment for bona fide stromal cells would be achieved if CD51 expression was included in the analysis of stromal cells. For example, Nestin-GFP+ cells were thought to comprise a small fraction (<10%) of CD45− Ter119− CD31− “stroma” (Mendez-Ferrer et al., 2010), but after exclusion of HSC-derived TNCs, Nestin-GFP+ cells would comprise the vast majority (>85%) of the bone marrow stromal cells. Although this may project homogeneity among bone marrow stromal cells, further heterogeneity certainly awaits future analyses of CD51+ TNCs.
CD45, the antigen widely used to select for hematopoietic cells, encodes for a protein tyrosine phosphatase (Penninger et al., 2001). Although its expression is ubiquitous among leukocytes, it has been extensively studied in the context of antigen-stimulated proliferation of T and B lymphocytes (Trowbridge and Thomas, 1994). CD45 regulates cell adhesion in that hematopoietic progenitors from CD45-null mice were shown to exhibit increased adherence to stromal cells due to unchecked Src kinase activity (Shivtiel et al., 2008). Human CD45 also plays a key role in homing and repopulation of hematopoietic stem and progenitor cells in immunodeficient mice (Shivtiel et al., 2011). Our studies showing the absence of CD45 expression in a subset of hematopoietic progenitors may reflect a transient requirement during ontogeny for enhanced adhesion to stromal cells. HSC-derived TNCs indeed appear to be tightly adhered to their microenvironment since enzymatic digestion releases the CD44+ CD51− fraction to the same extent as the bona fide CD51+ stromal cells (by ~10- and 13-fold, respectively, compared to non-digested flushed BM). A tight association of TNCs with stromal cells is also supported by the fact that colony-forming activity for erythroid cells is greatly enhanced by the presence of a cultured stromal layer, indicating that these erythroid precursors depend on stroma-derived signals.
Erythroid progenitor activity is classically detected by colony formation in nonadherent methylcellulose cultures where the most immature colonies (BFU-E) give rise to rapidly dividing CFU-E (Hattangadi et al., 2011). CD45 has been reported to be expressed on erythroid progenitors that have BFU-E or CFU-E activity (Li et al., 2014) and is downregulated as they further differentiate into Ter119-expressing erythroblast (Chen et al., 2009; Liu et al., 2013). CD44 and CD71 expression has also been used to monitor erythroblast maturation from the proerythroblast stage (CD45− CD11b− CD44hi CD71hi Ter119lo) to reticulocytes (CD45− CD11b− CD44− CD71− Ter119hi) (Chen et al., 2009; Socolovsky et al., 2001). The presence of erythroid progenitors in the CD45-negative and Ter119-negative cell fraction has, to our knowledge, not been previously described, likely due to the fact that they don't form colonies in methylcellulose (by contrast to BFU-E and CFU-E) and require stromal cells for their maintenance. Based on our co-culture and transplantation experiments, CD44+ CD51− TNCs may represent an intermediate progenitor stage upstream of Ter119lo/+ proerythroblasts, and downstream of CD45+ CFU-E, and may be referred to as a “pre-proerythroblast” (by analogy to pre-pro-B-cells).
The role of stromal cells in the regulation of B-lymphopoiesis has been extensively studied (Hardy et al., 2007; Nagasawa, 2006). B-lymphoid-committed progenitors rely on CXCR4 to localize near IL-7+ BM stromal cells which promote their survival and differentiation (Cordeiro Gomes et al., 2016). In vitro studies have revealed that B-cell precursors can differentiate in a stromal-free environment, but their selfrenewal and survival capacities require stromal cells (Montecino-Rodriguez and Dorshkind, 2006; Rolink et al., 2000). During their maturation, pre-B cells transit through a stromal-adherent stage, allowing them to expand before entering a non-adherent phase where self-renewal is lost at the expense of differentiation (Joshi et al., 2014). Although B-lymphoid cells are known to express CD45 (Thomas, 1989), our results have uncovered the presence of yet unappreciated CD45− B-lymphoid precursors within HSC-derived TNCs that appear phenotypically similar to pro-B cells. We have found that Ly6D, which labels the earliest committed B-cell progenitors in the BM (Inlay et al., 2009), is expressed on CD44+ CD51− TNCs that contain B-lymphoid colony-forming activity. Indeed, Ly6D expression allows the separation of B-lymphoid from erythroid progenitors in CD44+ CD51− TNCs. Although single cell cultures show that TNC-derived B-lymphoid progenitor frequency is lower than the erythroid progenitor activity (1 to 16 ratio), the TNC-derived B-lymphoid progenitors are functionally active as they can robustly repopulate the bone marrow after transplantation. Given the permeation of the CD45− Ter119− CD31− cell fraction by hematopoietic progenitors, our results suggest that additional markers such as CD44 and CD51 should be routinely included in future analyses and isolation of bone marrow stromal cells.
STAR METHODS
CONTACT FOR REAGENT AND RESOURCE SHARING
Further information and requests for reagents may be directed to, and will be fulfilled by, the Lead Contact, Paul S. Frenette (paul.frenette@einstein.yu.edu).
EXPERIMENTAL MODEL AND SUBJECT DETAILS
Mice
B6; FVB-Tg(Cspg4-Cre)1Akik/J (NG2-Cre), B6.129-Leprtm2(Cre)Rck/J(Lepr-Cre), B6.CgGt(ROSA)26Sortm14.CAG-tdTomato/Hze/J (iTdTomato), B6.129(Cg)-Gt(ROSA)26Sortm4(ACTB-tdTomato,-EGFP)Luo/J (Rosa26mTmG), B6.Cg-Tg(Tek-Cre)12Flv/J (Tie2-Cre), C57BL/6-Tg(UBC-GFP)30Scha/J (UBC-GFP), C57BL/6-Gt(ROSA)26Sortm1 (HBEGF)Awai/J(iDTR), C57BL/6-CD45.1/2 congenic strains (all from Jackson laboratory), Nestin-GFP mice (Mignone et al., 2004), Vav1-iCre (de Boer et al., 2003), Epor-iCre (Heinrich et al., 2004) and Osx-CreERT2 mice (Maes et al., 2010) were bred in our facilities. Csf1r-iCre mice (Deng et al., 2010) were provided by Dr. Jeffrey W. Pollard (Albert Einstein College of Medicine). Berkeley sickle cell mice (Tg[Hu-miniLCRα1GγAγδβS]Hba−/− Hbb−/−), referred to as SCD mice, and control hemizygous mice (Tg[Hu-miniLCRα1GγAγδβS]Hba−/− Hbb+/−), referred to as SA mice, were at least 18 weeks old and have been used and previously described (Paszty et al., 1997). All mice were maintained on the C57BL/6 background. Unless indicated otherwise, 9–13 week-old male and female mice were used. All mice were housed in pathogen-free conditions and fed with autoclaved food, and all experimental procedures were approved by the Animal Care and Use Committees of Albert Einstein College of Medicine.
Bone marrow-derived stromal cells
Cells were isolated from flushed bone marrow from male C57BL/6 mice and dissociated using 21G needle. Cells were then plated in 10-cm petri dish containing αMEM with 20% FBS, 100 U/mL penicillin-streptomycin, L-glutamine 2 mM, Fibroblast growth factor (R&D Systems) 5 ng/mL and incubate at 37°C 5% CO 2 for 3 weeks. Depletion of CD45+ cells was done weekly for 3 weeks using anti-CD45 magnetic beads (Miltenyi Biotec) according to the manufacturer’s recommendations. Stromal cells were allowed to reach 80-90% confluency and were subcultured for no more than 8 passages. Bone marrow-derived cells were used at passage 5-6 to get rid of all hematopoietic cells.
METHOD DETAILS
Cell sorting and flow cytometry
For the analyses of hematopoietic cells, BM cells were flushed and dissociated by gently passing through a 21G needle. Ammonium chloride was used for red blood cell (RBC) lysis. For analysis of stromal cells, BM plugs were flushed and sequentially digested in HBSS buffer containing collagenase type IV (2 mg/mL, Gibco) and dispase (1 mg/mL, Gibco) 3 times for 10 minutes at 37°C and the supernatant is collected between digestions and pooled into a tube containing ice-cold FACS buffer (PBS, EDTA 2 mM, BSA 0.1%, 0.05% NaN3). Cells were surface-stained in PEB buffer (PBS supplemented with 0.5% BSA and 2mM EDTA) for 15-20 min on ice. Multiparametric flow cytometric analyses were performed on a LSRII equipped with FACS Diva 8.0 software (BD Biosciences) and analyzed with FlowJo software (Tree Star). Cell sorting experiments were performed using an Aria Cell Sorter (BD) and Moflow Astrios (Beckman Coulter). Dead cells were excluded by FSC, SSC and 4’,6-diamino-2-phenylindole (DAPI, Sigma) for freshly isolated cells or 7-Aminoactinomycin (7-AAD) for cultured cells. Antibodies used: anti-mouse mABs Sca-1/Ly-6A/E (D7, eBioscience), CD117/c-Kit (2B8, BioLegend), CD135/Flt3 (A2F10, eBioscience), lineage cocktail (BD PharMingen cat# 559971), CD41 (MWReg30, eBioscience), CD45 (30-F11, eBioscience), Ter119 (clone Ly-76, eBioscience), CD31 (390, eBioscience), Gr-1 (RB6-8C5, eBioscience), CD11b (M1/70, eBioscience), CD48 (HM48-1, eBioscience), CD4 (GK1.5, eBioscience), CD8 (53-6.7, eBioscience), B220 (RA3-6B2, eBioscience), CD44 (IM7, eBioscience), CD105 (MJ7/18, BioLegend), CD150 (TC15-12F12.2, BioLegend), CD16/32 (93, eBioscience), CD140a (AP5, eBioscience), CD51 (RMV-7, eBioscience), anti-Lepr (R&D systems), CD31 (MEC13.3, BioLegend), CD71 (R17217, eBioscience), CD34 (RAM34, eBioscience), CD24 (M1/69, BioLegend), CD43 (1B11, BioLegend), VCAM-1 (429, BioLegend), CD90 (HIS51, eBioscience), Ly6C (HK1.4, eBioscience), CD127 (A7R34, eBioscience), Ly6D (49-H4, BioLegend), CD19 (ID3, eBioscience), CD144 (BV13, BioLegend).
RNA isolation and quantitative real-time PCR (Q-PCR)
Messenger RNA isolation was performed using Dynabeads mRNA DIRECT MicroKit (Life Technologies) and reverse transcription was performed using RNA to cDNA EcoDry Premix (Clontech) according to the manufacturer's protocols. Quantitative PCR was performed with SYBR Green (Roche) on the QuantStudio 6 Flex Real-time PCR System (Applied Biosystems). The PCR protocol consisted of 1 cycle at 95°C (10 min) followed by 40 cycles of 95°C (15 s) and 60°C (1 mi n). For list of primers see Table S4. Expression of glyceraldehyde-3-phosphate dehydrogenase (Gapdh) was used as standard. The average threshold cycle number (Ct) for each tested mRNA was used to quantify the relative expression of each gene; 2 − [Ct(gene) − Ct(standard)].
RNA preparation from bulk populations and next-generation sequencing
Total RNA from sorted TNCs was extracted using the RNAeasy Plus Micro kit (Qiagen). The integrity and purity of total RNA were assessed using an Aligent 2100 Bioanalyzer (Agilent Technologies). Complementary DNA was generated using the SMART-Seq v4 Ultra Low Input RNA Kit for Sequencing (Clontech Laboratories) from 1 ng of totalRNA. The Nextera XT DNASample preparation Kit (Illumina) was used for preparation of DNA libraries. The libraries were then submitted for Illumina HiSeq2500 sequencing (Illumina) according to the standard operation procedure.
Bulk RNA-sequencing (RNA-Seq) data analysis
Gene lengths were obtained from the annotation file gencode.vM9.annotation.gtf. To determine the length of a gene, the combined length of non-overlapping exons was used. Raw values from the RNA-Seq data were converted to log2 RPKM values using the gene lengths in R, with the prior.count argument set to 1. Gene expression data was included only for cell types from the CD44+ CD51− and CD51+ TNC samples. Genes with a CPM value > 0.1 in at least 25% of all 12 samples were retained, resulting in a total of 25,955 genes. Normalization factors were used to scale library sizes via the TMM method from edgeR (version 3.16.5). The “estimateDisp” function in edgeR was then used to estimate common, trended, and tagwise negative binomial dispersions. A negative binomial generalized log-linear model was fitted to the read counts for each gene and this model was used to test for differentially expressed genes between the CD44+ CD51− and CD51+ TNCs using a generalized linear model (GLM) likelihood ratio test. The fitting and tests were done using edgeR functions glmFit and glmLRT.
To assess the difference between CD44+ CD51− and CD51+ TNCs, the differentially expressed genes were defined as those genes with statistical significance passing an adjusted P-value of 0.05. To do this, raw counts for each sample were used. There were 6 total samples with 3 samples in each group. A gene was only tested for differential expression in this analysis if it had a CPM > 0.1 in at least 50% of samples. edgeR was used to calculate normalization factors to scale the library sizes using the TMM method. The “estimateDisp” function in edgeR was used to estimate common, trended, and tagwise negative binomial dispersions. An exact test was used to find differentially expressed genes between CD44+ CD51− and CD51+ TNCs. There were 7351 differentially expressed genes. Biomart was used to get the gene symbols from ensemble IDs. The raw counts from CD44+ CD51− TNCs, CD51+ TNCs and erythroblasts (GSE53983) were combined. The length of each gene was found using the annotation file gencode.vM9.annotation.gtf. Using this annotation file, the combined length of non-overlapping exons in each gene was found. The raw counts were then converted to log2 RPKM values using the RPKM function in edgeR with the prior.count argument set to 1. The log2 RPKM values were retrieved for genes that were differentially expressed between CD44+ CD51− and CD51+ TNCs.
The PCA plot was created from the matrix of log2 RPKM values using the prcomp function in R with arguments scale equal to TRUE and center equal to TRUE. The hierarchical cluster plots were created based on the Pearson correlation coefficient (R2) as the distance metric, specifically 1 – R2 and using the as.dist function in R. The hclust function in R was used with the complete linkage to perform hierarchical clustering. The log2 RPKM values were used to create a heatmap using the heatmap.2 function (gplots version 3.0.1). The hclust method used was complete and the distance function used was a distance matrix made from the correlations of the log2 RPKM values subtracted from 1.
Single-cell RNA sequencing and analysis
The SORTseq single cell RNA sequencing protocol was carried out as described previously (Muraro et al., 2016). Briefly, single cells were sorted into 384 well plates containing CEL-Seq2 primer solution plus mineral oil and were immediately frozen on dry ice and stored at −80°C. CEL-Seq2 primers were dispensed with the Mosquito HTS (TTPlabtech). Before cell lysis by means of a heat shock, ERCC Spike-in RNA (0.02 μL of 1 : 50,000 dilution) was added to each well. RT and second strand synthesis reagents were dispensed using the Nanodrop II (GC biotech). After generation of cDNA from the original mRNA, all cells from the plate were pooled and the pooled sample was amplified linearly by performing in vitro transcription. The amplified RNA was then RT’d to cDNA using a random hexamer primer, as described in the CEL-Seq2 manual (Hashimshony et al., 2016). To generate sequencing libraries, RPI-series index primers were used for library PCR. Libraries were sequenced on an Illumina Nextseq500 using 75 bp paired end sequencing. Paired end reads obtained by sequencing were aligned to the transcriptome using bwa (version 0.7.10) as described previously and the RaceID2 algorithm was used to generate single cell clusters (Grun et al., 2016). RaceID2 was run with parameters mintotal=1000, minexpr=5, maxexpr=500 and default parameters otherwise. We removed mitochondrial genes and other non-cell-type specific genes (Malat1, Rn45s, Kcnq1ot1, Mir5109, GM17821, Vmn2r55, Ptma and Lars) found in all clusters. The R-code and documentation of RaceID2 is available for download at https://github.com/dgrun/StemID.
Cell cycle analysis
BM cells were stained with surface markers, fixed and permeabilized using BD Cytofix/Cytoperm™ Fixation/Permeabilization Kit according to the manufacturer’s protocol, and stained with anti-Ki67 antibody and Hoechst 33342 at 20 μg/mL for 30 min. After washing, cells were analyzed by LSRII Flow Cytometer (Becton Dickinson).
Immunofluorescence imaging
Whole-mount sternum immunofluorescence was performed as previously described (Asada et al., 2017). Mice were injected with Alexa Fluor 647-anti-CD144 (VE-Cadherin) (BV13, BioLegend, 5 μg per mouse) and Alexa Fluor 647-anti-CD31 (MEC13.3, BioLegend,cat, 5 μg per mouse) via the retro-orbital plexux 10 minutes before euthanasia. Sternal BM was exposed and fixed with 4% PFA for 20 min. Bone fragments were then washed in PBS and blocked/permeabilized in PBS containing 20% normal goat serum and 0.5% Triton X-100. Sternal bones were incubated with primary antibodies overnight. Primary antibodies used were anti-CD44-biotin (IM7, BioLegend,) and anti-CD45 pacific blue (30-F11, BioLegend). After washing in PBS, tissues were incubated with secondary antibodies for 2 hours. Secondary antibodies used were Alexa Fluor 488 goat anti-rabbit IgG (Molecular Probes, A-11034).
In vivo treatments
For induction Osx-CreERT2-mediated recombination, mice at post-natal day 5 (P5) were injected with 2 mg/30 g tamoxifen (Sigma) by intragastric injection and were analyzed after a chase of 15 weeks. For phenylhydrazine (PHZ) treatment, mice were injected i.p. with 40mg/kg PHZ for two consecutive days and analyzed 2 days and 4 days after the first injection. For sublethal irradiation experiments, mice were irradiated with 6 Gy and analyzed 1 week later. For DT-mediated Lepr+ cell depletion using Lepr-Cre;iDTR mice, 250 ng of DT (Sigma) were injected i.p. every 24 h over 7 days.
Bone marrow transplantation
Whole BM transplantation was performed by harvesting BM cells from C57BL/6 mice and transplanted 3×10⁶ cells into each lethally irradiated (12Gy) mice. For HSPC transplantation, HSC (Lin− Sca-1+ c-Kit+ CD34− CD135− CD48− CD150+), MPP1 (Lin− Sca-1+c-Kit+ CD34+ CD135− CD48− CD150+), MPP2 (Lin− Sca-1+ c-Kit+ CD34+ CD135− CD48+ CD150+), MPP3 (Lin− Sca-1+ c-Kit+ CD34+ CD135− CD48+ CD150−) and MPP4 (Lin− Sca-1+ c-Kit+ CD34+ CD135+ CD48+ CD150−) were sorted from Rosa26mTmG mice and injected individually in lethally irradiated mice (12 Gy) in combination with 200,000 unlabeled BM cells. HSPC numbers were determined based on the frequency of each subset within 3×10⁶ BM cells (approximately 250 HSCs, 250 MPP1, 250 MPP2; 1,500 MPP3 and 2,000 MPP4). For erythroid progenitor transplantation, CFU-E (Lin− Sca-1− c-Kit+ CD41− CD16/32− CD105+ CD150−), pre-CFU-E (Lin− Sca-1− c-Kit+ CD41− CD16/32− CD105+ CD150+) and preMegE (Lin− Sca-1− c-Kit+ CD41” CD16/32” CD105” CD150+) (Pronk et al., 2007) as well as TNC populations were sorted individually from UBC-GFP mice (20,000 CFU-E, 5,000 preCFU-E and 5,000 preMegE, 20,000 CD CD44+ CD51− TNCs, 10,000 CD44− CD51− TNCs) and injected in lethally irradiated mice (12 Gy).
Cell culture assays
To evaluate CFU-F activity, sorted cells (1–3×10³) were seeded per well in a 12-well adherent tissue culture plate using phenol-red free α-MEM (Gibco) supplemented with 20% FBS (Hyclone), 10% MesenCult stimulatory supplement (StemCell Technologies) and 0.5% penicillin-streptomycin. One-half of the media was replaced after 7 days and at day 14 cells were stained with Differential Quik Stain (modified Giemsa) Kit (Polysciences).
For BFU-E, CFU-E and CFU pre-B, CD44+ CD51− and CD44− CD51− TNCs (500-2000 per plate) were individually sorted from C57BL/6 mice BM and plated in methylcellulose (Stem Cell Technologies, Cat#: 3630 (CFU pre-B), Cat#: 3436 (BFU-E), Cat#: 3434 (CFU-E)) and incubated for 7 days (BFU-E, CFU pre-B) or 2-3 days (CFUE) at 37°C in 5% CO2. Stem cell factor (25ng/mL) was added to CFU pre-B methylcellulose.
In vitro liquid culture was performed as previously described with modifications (Chen et al., 2009). Sorted CD44+ CD51− TNCs, CD44− CD51− TNCs, CFU-E, preCFU-E and preMegE from Rosa26mTmG mice (500-2,500 per well) were cultured in 96-well plates containing co-culture media composed of DMEM (Corning Cellgro #10-017-CV), 30% FBS, 100 U/mL penicillin-streptomycin, 1-thioglycerol 0.1 mM (Sigma #M6145), Insulin-Transferrin-Selenium-Ethanolamine (ITS-X) (ThermoFisher Scientific #51500-056), 2 U/mL erythropoietin (BioLegend #587602), stem cell factor (25ng/mL), IL-3 (Peprotech #213-13, 25ng/mL), IL-6 (Peprotech #216-16, 25ng/mL), Thrombopoietin (Prospec #CYT-346, 25ng/mL). IL-7 (Peprotech #217-17, 25ng/mL) was added to previous cytokines in order to evaluate lymphoid maturation from sorted Ly6D+ CD44+ CD51− TNCs, pro-B, pre-B and pre-pro-B (200-1000 cells per well). Cultured cells were seeded in the presence or absence of cultured BM-derived stromal cells (3000 cells) seeded 24h prior to co-culture experiments. Lineage potential of sorted iTdTomato+ TNCs and erythroid progenitors was measured by FACS using myeloid (CD11b+/Gr1+), B lymphoid (B220+), T lymphoid (CD4+/CD8+), erythroid (Ter119+), and megakaryocyte (FSCHi CD41+) markers. Cell numbers for each population were normalized as a percentage of total cell plated per well (% of cells plated).
For single-cell co-culture assays, BM-derived stromal cells (300 cells) were seeded in 384-well plates 24h prior to co-culture. Single CD44− CD51− TNCs from Epor-iCre;iTdTomato mice were seeded in plates containing co-culture media with IL-7 as previously described. After 2 days, each well was assessed for the presence of iTdTomato+ colonies for erythroid lineage contribution. After 1 week, cells within each well were stained for lineage markers as described previously and B-lymphoid contribution was assessed by FACS.
QUANTIFICATION AND STATISTICAL ANALYSIS
All data are represented as mean ± S.E.M. n represents mouse number analyzed in each experiment, as detailed in figure legends. Comparison between two samples were done using two-tailed Student's t-tests. One-way analysis of variance (ANOVA) analyses followed by Tukey’s multiple comparison test or two-way ANOVA followed by Sidak multiple comparison test were used for multiple group comparisons. Statistical analyses were performed using GraphPad Prism 7 software. *P<0.05, **P<0.01, ***P<0.001, ****P<0.0001.
DATA AND SOFTWARE AVAILABILITY
The accession number for the raw data files for the RNA-Seq analyses reported in this paper is GSE107775 and GSE114161.
Supplementary Material
Expression values (RPKM) for CD44+ CD51− TNCs and CD51+ TNCs. n=3 mice per group.
Z scores of gene expression values for hematopoietic- and stromal-associated across replicates for CD44+ CD51− TNCs and CD51+ TNCs. n=3 mice per group.
Clusters were generated using RaceID2 algorithm based on cluster-specific gene expression values from single CD44+ CD51− and CD44− CD51− TNCs. Average gene expression outside cell cluster (mean.ncl); Average gene expression within cell cluster (mean.cl); fold change (fc); p-value (pv).
List of qPCR primers used in this study.
Highlights.
The majority of TNCs in the bone marrow have a hematopoietic origin.
Bona fide stromal-derived TNCs are selected by CD51 positive selection.
Ly6D+ CD44+ CD51− TNCs are enriched in pro-B lymphoid cells.
Ly6D− CD44+ CD51− TNCs contain “pre-proerythroblasts− that expand in anemia.
Acknowledgments
We are grateful to C. Prophete, P. Ciero, C. Cruz, L. Tesfa from the Flow Cytometry Core Facility and P. Guo from the Analytical Imaging Facility for their technical assistance; S. Pinho and Q. Wei for helpful scientific discussions; D. Sun from Human Stem Cell FACS and Xenotransplantation Facility for cell sorting assistance. This work was supported by grants from the NIH (DK056638, HL069438, DK112976, DK116312, and HL097819 to P.S.F.). We are also grateful to the New York State Department of Health (NYSTEM Program) for shared facility (C029154) and research support (N13G-262) and the Leukemia and Lymphoma Society’s Translational Research Program. The Analytical Imaging Facility is supported by a grant from NCI cancer center (P30CA013330). P.E.B is supported by a postdoctoral fellowship from Fonds de recherche du Québec-Santé (FRQS). F.N. is supported by a Postdoctoral Fellowship for Research Abroad from the Japan Society for the Promotion of Science. J.C.M and S.Z are supported by NYSTEM C029154.
Footnotes
Declaration of interests
The authors declare no competing interests.
Publisher's Disclaimer: This is a PDF file of an unedited manuscript that has been accepted for publication. As a service to our customers we are providing this early version of the manuscript. The manuscript will undergo copyediting, typesetting, and review of the resulting proof before it is published in its final citable form. Please note that during the production process errors may be discovered which could affect the content, and all legal disclaimers that apply to the journal pertain.
References
- An X, Schulz VP, Li J, Wu K, Liu J, Xue F, Hu J, Mohandas N, and Gallagher PG (2014). Global transcriptome analyses of human and murine terminal erythroid differentiation. Blood 123, 3466–3477. [DOI] [PMC free article] [PubMed] [Google Scholar]
- Asada N, Kunisaki Y, Pierce H, Wang Z, Fernandez NF, Birbrair A, Ma'ayan A, and Frenette PS (2017). Differential cytokine contributions of perivascular haematopoietic stem cell niches. Nat Cell Biol 19, 214–223. [DOI] [PMC free article] [PubMed] [Google Scholar]
- Chan CK, Chen CC, Luppen CA, Kim JB, DeBoer AT, Wei K, Helms JA, Kuo CJ, Kraft DL, and Weissman IL (2009). Endochondral ossification is required for haematopoietic stem-cell niche formation. Nature 457, 490–494. [DOI] [PMC free article] [PubMed] [Google Scholar]
- Chan CK, Seo EY, Chen JY, Lo D, McArdle A, Sinha R, Tevlin R, Seita J, Vincent-Tompkins J, Wearda T, et al. (2015). Identification and specification of the mouse skeletal stem cell. Cell 160, 285–298. [DOI] [PMC free article] [PubMed] [Google Scholar]
- Chen K, Liu J, Heck S, Chasis JA, An X, and Mohandas N (2009). Resolving the distinct stages in erythroid differentiation based on dynamic changes in membrane protein expression during erythropoiesis. Proc Natl Acad Sci U S A 106, 17413–17418. [DOI] [PMC free article] [PubMed] [Google Scholar]
- Cordeiro Gomes A, Hara T, Lim VY, Herndler-Brandstetter D, Nevius E, Sugiyama T, Tani-Ichi S, Schlenner S, Richie E, Rodewald HR, et al. (2016). Hematopoietic Stem Cell Niches Produce Lineage-Instructive Signals to Control Multipotent Progenitor Differentiation. Immunity 45, 1219–1231. [DOI] [PMC free article] [PubMed] [Google Scholar]
- de Boer J, Williams A, Skavdis G, Harker N, Coles M, Tolaini M, Norton T, Williams K, Roderick K, Potocnik AJ, et al. (2003). Transgenic mice with hematopoietic and lymphoid specific expression of Cre. Eur J Immunol 33, 314–325. [DOI] [PubMed] [Google Scholar]
- Deng L, Zhou JF, Sellers RS, Li JF, Nguyen AV, Wang Y, Orlofsky A, Liu Q, Hume DA, Pollard JW, et al. (2010). A novel mouse model of inflammatory bowel disease links mammalian target of rapamycin-dependent hyperproliferation of colonic epithelium to inflammation-associated tumorigenesis. Am J Pathol 176, 952–967. [DOI] [PMC free article] [PubMed] [Google Scholar]
- Ding L, Saunders TL, Enikolopov G, and Morrison SJ (2012). Endothelial and perivascular cells maintain haematopoietic stem cells. Nature 481, 457–462. [DOI] [PMC free article] [PubMed] [Google Scholar]
- Grun D, Muraro MJ, Boisset JC, Wiebrands K, Lyubimova A, Dharmadhikari G, van den Born M, van Es J, Jansen E, Clevers H, et al. (2016). De Novo Prediction of Stem Cell Identity using Single-Cell Transcriptome Data. Cell Stem Cell 19, 266–277. [DOI] [PMC free article] [PubMed] [Google Scholar]
- Hardy RR, Kincade PW, and Dorshkind K (2007). The protean nature of cells in the B lymphocyte lineage. Immunity 26, 703–714. [DOI] [PubMed] [Google Scholar]
- Hashimshony T, Senderovich N, Avital G, Klochendler A, de Leeuw Y, Anavy L, Gennert D, Li S, Livak KJ, Rozenblatt-Rosen O, et al. (2016). CEL-Seq2: sensitive highly-multiplexed single-cell RNA-Seq. Genome Biol 17, 77. [DOI] [PMC free article] [PubMed] [Google Scholar]
- Hattangadi SM, Wong P, Zhang L, Flygare J, and Lodish HF (2011). From stem cell to red cell: regulation of erythropoiesis at multiple levels by multiple proteins, RNAs, and chromatin modifications. Blood 118, 6258–6268. [DOI] [PMC free article] [PubMed] [Google Scholar]
- Heinrich AC, Pelanda R, and Klingmuller U (2004). A mouse model for visualization and conditional mutations in the erythroid lineage. Blood 104, 659–666. [DOI] [PubMed] [Google Scholar]
- Inlay MA, Bhattacharya D, Sahoo D, Serwold T, Seita J, Karsunky H, Plevritis SK, Dill DL, and Weissman IL (2009). Ly6d marks the earliest stage of B-cell specification and identifies the branchpoint between B-cell and T-cell development. Genes Dev 23, 2376–2381. [DOI] [PMC free article] [PubMed] [Google Scholar]
- Joshi I, Yoshida T, Jena N, Qi X, Zhang J, Van Etten RA, and Georgopoulos K (2014). Loss of Ikaros DNA-binding function confers integrin-dependent survival on pre-B cells and progression to acute lymphoblastic leukemia. Nat Immunol 15, 294–304. [DOI] [PMC free article] [PubMed] [Google Scholar]
- Kina T, Ikuta K, Takayama E, Wada K, Majumdar AS, Weissman IL, and Katsura Y (2000). The monoclonal antibody TER-119 recognizes a molecule associated with glycophorin A and specifically marks the late stages of murine erythroid lineage. Br J Haematol 109, 280–287. [DOI] [PubMed] [Google Scholar]
- Kunisaki Y, Bruns I, Scheiermann C, Ahmed J, Pinho S, Zhang D, Mizoguchi T, Wei Q, Lucas D, Ito K, et al. (2013). Arteriolar niches maintain haematopoietic stem cell quiescence. Nature 502, 637–643. [DOI] [PMC free article] [PubMed] [Google Scholar]
- Li J, Hale J, Bhagia P, Xue F, Chen L, Jaffray J, Yan H, Lane J, Gallagher PG, Mohandas N, et al. (2014). Isolation and transcriptome analyses of human erythroid progenitors: BFU-E and CFU-E. Blood 124, 3636–3645. [DOI] [PMC free article] [PubMed] [Google Scholar]
- Liu J, Zhang J, Ginzburg Y, Li H, Xue F, De Franceschi L, Chasis JA, Mohandas N, and An X (2013). Quantitative analysis of murine terminal erythroid differentiation in vivo: novel method to study normal and disordered erythropoiesis. Blood 121, e43–49. [DOI] [PMC free article] [PubMed] [Google Scholar]
- Maes C, Kobayashi T, Selig MK, Torrekens S, Roth SI, Mackem S, Carmeliet G, and Kronenberg HM (2010). Osteoblast precursors, but not mature osteoblasts, move into developing and fractured bones along with invading blood vessels. Dev Cell 19, 329–344. [DOI] [PMC free article] [PubMed] [Google Scholar]
- Mendez-Ferrer S, Michurina TV, Ferraro F, Mazloom AR, Macarthur BD, Lira SA, Scadden DT, Ma'ayan A, Enikolopov GN, and Frenette PS (2010). Mesenchymal and haematopoietic stem cells form a unique bone marrow niche. Nature 466, 829–834. [DOI] [PMC free article] [PubMed] [Google Scholar]
- Mignone JL, Kukekov V, Chiang AS, Steindler D, and Enikolopov G (2004). Neural stem and progenitor cells in nestin-GFP transgenic mice. J Comp Neurol 469, 311–324. [DOI] [PubMed] [Google Scholar]
- Mizoguchi T, Pinho S, Ahmed J, Kunisaki Y, Hanoun M, Mendelson A, Ono N, Kronenberg HM, and Frenette PS (2014). Osterix marks distinct waves of primitive and definitive stromal progenitors during bone marrow development. Dev Cell 29, 340–349. [DOI] [PMC free article] [PubMed] [Google Scholar]
- Montecino-Rodriguez E, and Dorshkind K (2006). Stromal cell-dependent growth of B-1 B cell progenitors in the absence of direct contact. Nat Protoc 1, 1140–1144. [DOI] [PubMed] [Google Scholar]
- Morikawa S, Mabuchi Y, Kubota Y, Nagai Y, Niibe K, Hiratsu E, Suzuki S, Miyauchi-Hara C, Nagoshi N, Sunabori T, et al. (2009). Prospective identification, isolation, and systemic transplantation of multipotent mesenchymal stem cells in murine bone marrow. J Exp Med 206, 2483–2496. [DOI] [PMC free article] [PubMed] [Google Scholar]
- Muraro MJ, Dharmadhikari G, Grun D, Groen N, Dielen T, Jansen E, van Gurp L, Engelse MA, Carlotti F, de Koning EJ, et al. (2016). A Single-Cell Transcriptome Atlas of the Human Pancreas. Cell Syst 3, 385–394 e383. [DOI] [PMC free article] [PubMed] [Google Scholar]
- Nagasawa T (2006). Microenvironmental niches in the bone marrow required for B-cell development. Nat Rev Immunol 6, 107–116. [DOI] [PubMed] [Google Scholar]
- Nakashima K, Zhou X, Kunkel G, Zhang Z, Deng JM, Behringer RR, and de Crombrugghe B (2002). The novel zinc finger-containing transcription factor osterix is required for osteoblast differentiation and bone formation. Cell 108, 17–29. [DOI] [PubMed] [Google Scholar]
- Omatsu Y, Sugiyama T, Kohara H, Kondoh G, Fujii N, Kohno K, and Nagasawa T (2010). The essential functions of adipo-osteogenic progenitors as the hematopoietic stem and progenitor cell niche. Immunity 33, 387–399. [DOI] [PubMed] [Google Scholar]
- Owen M, and Friedenstein AJ (1988). Stromal stem cells: marrow-derived osteogenic precursors. Ciba Found Symp 136, 42–60. [DOI] [PubMed] [Google Scholar]
- Park D, Spencer JA, Koh BI, Kobayashi T, Fujisaki J, Clemens TL, Lin CP, Kronenberg HM, and Scadden DT (2012). Endogenous bone marrow MSCs are dynamic, fate-restricted participants in bone maintenance and regeneration. Cell Stem Cell 10, 259–272. [DOI] [PMC free article] [PubMed] [Google Scholar]
- Paszty C, Brion CM, Manci E, Witkowska HE, Stevens ME, Mohandas N, and Rubin EM (1997). Transgenic knockout mice with exclusively human sickle hemoglobin and sickle cell disease. Science 278, 876–878. [DOI] [PubMed] [Google Scholar]
- Penninger JM, Irie-Sasaki J, Sasaki T, and Oliveira-dos-Santos AJ (2001). CD45: new jobs for an old acquaintance. Nat Immunol 2, 389–396. [DOI] [PubMed] [Google Scholar]
- Pinho S, Lacombe J, Hanoun M, Mizoguchi T, Bruns I, Kunisaki Y, and Frenette PS (2013). PDGFRalpha and CD51 mark human nestin+ sphere-forming mesenchymal stem cells capable of hematopoietic progenitor cell expansion. J Exp Med 210, 1351–1367. [DOI] [PMC free article] [PubMed] [Google Scholar]
- Pronk CJ, Rossi DJ, Mansson R, Attema JL, Norddahl GL, Chan CK, Sigvardsson M, Weissman IL, and Bryder D (2007). Elucidation of the phenotypic, functional, and molecular topography of a myeloerythroid progenitor cell hierarchy. Cell Stem Cell 1, 428–442. [DOI] [PubMed] [Google Scholar]
- Rolink AG, Winkler T, Melchers F, and Andersson J (2000). Precursor B cell receptor-dependent B cell proliferation and differentiation does not require the bone marrow or fetal liver environment. J Exp Med 191, 23–32. [DOI] [PMC free article] [PubMed] [Google Scholar]
- Sacchetti B, Funari A, Michienzi S, Di Cesare S, Piersanti S, Saggio I, Tagliafico E, Ferrari S, Robey PG, Riminucci M, et al. (2007). Self-renewing osteoprogenitors in bone marrow sinusoids can organize a hematopoietic microenvironment. Cell 131, 324–336. [DOI] [PubMed] [Google Scholar]
- Sanjuan-Pla A, Macaulay IC, Jensen CT, Woll PS, Luis TC, Mead A, Moore S, Carella C, Matsuoka S, Bouriez Jones T, et al. (2013). Platelet-biased stem cells reside at the apex of the haematopoietic stem-cell hierarchy. Nature 502, 232–236. [DOI] [PubMed] [Google Scholar]
- Schaefer BC, Schaefer ML, Kappler JW, Marrack P, and Kedl RM (2001). Observation of antigen-dependent CD8+ T-cell/ dendritic cell interactions in vivo. Cell Immunol 214, 110–122. [DOI] [PubMed] [Google Scholar]
- Schepers K, Hsiao EC, Garg T, Scott MJ, and Passegue E (2012). Activated Gs signaling in osteoblastic cells alters the hematopoietic stem cell niche in mice. Blood 120, 3425–3435. [DOI] [PMC free article] [PubMed] [Google Scholar]
- Shivtiel S, Kollet O, Lapid K, Schajnovitz A, Goichberg P, Kalinkovich A, Shezen E, Tesio M, Netzer N, Petit I, et al. (2008). CD45 regulates retention, motility, and numbers of hematopoietic progenitors, and affects osteoclast remodeling of metaphyseal trabecules. J Exp Med 205, 2381–2395. [DOI] [PMC free article] [PubMed] [Google Scholar]
- Shivtiel S, Lapid K, Kalchenko V, Avigdor A, Goichberg P, Kalinkovich A, Nagler A, Kollet O, and Lapidot T (2011). CD45 regulates homing and engraftment of immature normal and leukemic human cells in transplanted immunodeficient mice. Exp Hematol 39, 1161–1170 e1161. [DOI] [PubMed] [Google Scholar]
- Short BJ, Brouard N, and Simmons PJ (2009). Prospective isolation of mesenchymal stem cells from mouse compact bone. Methods Mol Biol 482, 259–268. [DOI] [PubMed] [Google Scholar]
- Simmons PJ, Przepiorka D, Thomas ED, and Torok-Storb B (1987). Host origin of marrow stromal cells following allogeneic bone marrow transplantation. Nature 328, 429–432. [DOI] [PubMed] [Google Scholar]
- Socolovsky M, Nam H, Fleming MD, Haase VH, Brugnara C, and Lodish HF (2001). Ineffective erythropoiesis in Stat5a(−/−)5b(−/−) mice due to decreased survival of early erythroblasts. Blood 98, 3261–3273. [DOI] [PubMed] [Google Scholar]
- Sugiyama T, Kohara H, Noda M, and Nagasawa T (2006). Maintenance of the hematopoietic stem cell pool by CXCL12-CXCR4 chemokine signaling in bone marrow stromal cell niches. Immunity 25, 977–988. [DOI] [PubMed] [Google Scholar]
- Thomas ML (1989). The leukocyte common antigen family. Annu Rev Immunol 7, 339–369. [DOI] [PubMed] [Google Scholar]
- Trowbridge IS, and Thomas ML (1994). CD45: an emerging role as a protein tyrosine phosphatase required for lymphocyte activation and development. Annu Rev Immunol 12, 85–116. [DOI] [PubMed] [Google Scholar]
- Worthley DL, Churchill M, Compton JT, Tailor Y, Rao M, Si Y, Levin D, Schwartz MG, Uygur A, Hayakawa Y, et al. (2015). Gremlin 1 identifies a skeletal stem cell with bone, cartilage, and reticular stromal potential. Cell 160, 269–284. [DOI] [PMC free article] [PubMed] [Google Scholar]
- Zhou BO, Yue R, Murphy MM, Peyer JG, and Morrison SJ (2014). Leptin-receptor-expressing mesenchymal stromal cells represent the main source of bone formed by adult bone marrow. Cell Stem Cell 15, 154–168. [DOI] [PMC free article] [PubMed] [Google Scholar]
Associated Data
This section collects any data citations, data availability statements, or supplementary materials included in this article.
Supplementary Materials
Expression values (RPKM) for CD44+ CD51− TNCs and CD51+ TNCs. n=3 mice per group.
Z scores of gene expression values for hematopoietic- and stromal-associated across replicates for CD44+ CD51− TNCs and CD51+ TNCs. n=3 mice per group.
Clusters were generated using RaceID2 algorithm based on cluster-specific gene expression values from single CD44+ CD51− and CD44− CD51− TNCs. Average gene expression outside cell cluster (mean.ncl); Average gene expression within cell cluster (mean.cl); fold change (fc); p-value (pv).
List of qPCR primers used in this study.
Data Availability Statement
The accession number for the raw data files for the RNA-Seq analyses reported in this paper is GSE107775 and GSE114161.