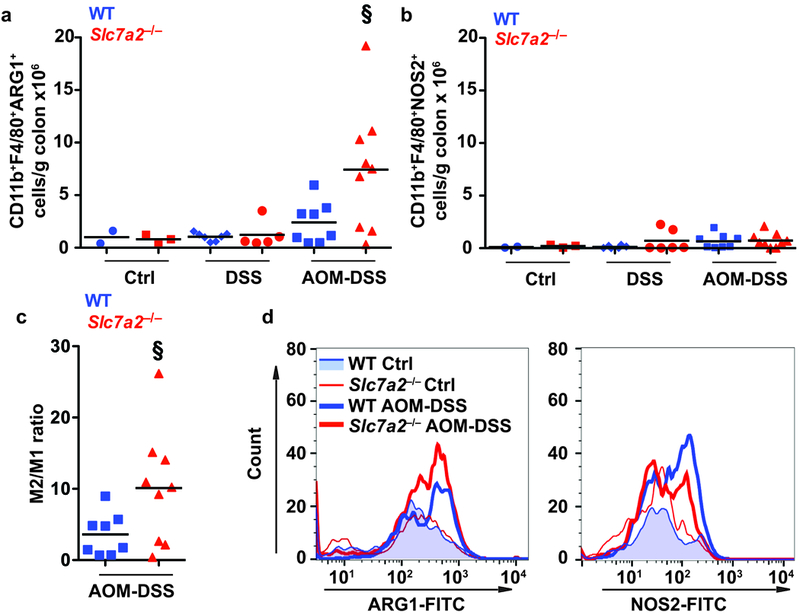
Figure 4. AOM-DSS exposure leads to increased M2 colonic macrophages in Slc7a2–/– mice.

(a-b) Quantification of CD11b+F4/80+ARG1+ macrophages and CD11b+F4/80+NOS2+ macrophages per gram of colon tissue. (c) Ratio of CD11b+F4/80+ARG1+/CD11b+F4/80+NOS2+ in the same colon. (d) Representative flow plots showing the increase in CD11b+F4/80+ARG1+ macrophages in Slc7a2–/– AOM-DSS colon compared to WT AOM-DSS colon. In a-c, §P < 0.05 versus WT AOM-DSS by one-way ANOVA with Student-Newman-Keuls posthoc multiple comparisons test. n = 2–3 control, 5–7 DSS-treated, and 7–9 AOM-DSS-treated per genotype.
