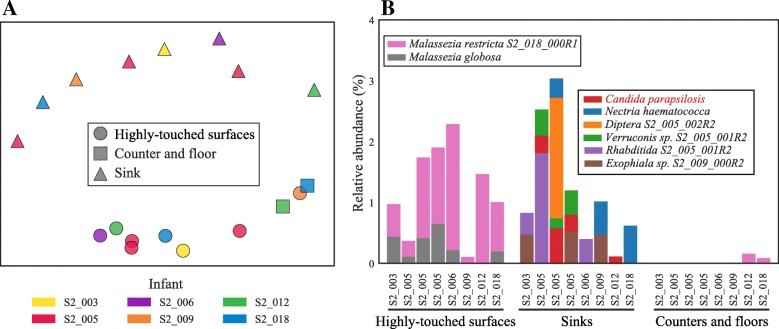
Fig. 3.
Eukaryotic microbiome of the neonatal intensive care unit (NICU). a Multidimensional scaling (MDS) of the Bray-Curtis dissimilarity between all NICU samples. Samples cluster by environment type rather than the room or occupant. The stress of the MDS was calculated to be 0.23. b Compositional profile of eukaryotic organisms detected in the NICU. Each colored box represents the percentage of reads mapping to an organism’s genome, and the stacked boxes for each sample show the fraction of reads in that dataset accounted for by different eukaryotic genomes in each sample

