Abstract
We present a method of OCT angiography (OCTA) data filtering for noise suppression and improved visualization of the retinal vascular networks in en face projection images. In our approach, we use a set of filters applied in three orthogonal axes in the three-dimensional (3-D) data sets. Minimization of artifacts generated in B-scan–wise data processing is accomplished by filtering the cross-sections along the slow scanning axis. A-scans are de-noised by axial filtering. The core of the method is the application of directional filtering to the C-scans, i.e. one-pixel thick sections of the 3-D data set, perpendicular to the direction of the scanning OCT beam. The method uses a concept of structuring, directional kernels of shapes matching the geometry of the image features. We use rotating ellipses to find the most likely local orientation of the vessels and use the best matching ellipses for median filtering of the C-scans. We demonstrate our approach in the imaging of a normal human eye with laboratory-grade spectral-domain OCT setup. The “field performance” is demonstrated in imaging of diabetic retinopathy cases with a commercial OCT device. The absolute complex differences method is used for the generation of OCTA images from the data collected in the most noise-wise unfavorable OCTA scanning regime–two frame scanning.
1. Introduction
Optical coherence tomography angiography (OCTA) is a set of methods derived from the optical coherence tomography technique (OCT) to enable imaging of the vascular systems embedded in the living tissues. Since the first report of the OCTA imaging in the human eye [1], an abundance of OCTA methods was produced by research groups around the world [2–5]. They all relay on a simple observation that the flow of the blood can be used to identify the location of vessels within the static tissue. This concept is a special case of using signal variations as a contrast mechanism for imaging of features exhibiting specific dynamic processes, within stationary objects. However, in living tissues, motion occurs within the entire imaged volume at different temporal and spatial scales. The goal of motion contrast methods is therefore to identify the temporal and spatial characteristics of the motion of interest and adjust the experimental procedures and data processing methods to highlight the areas where the dynamic processes of interest occur. The OCT technique is well suited to detect the motion of blood in the circulatory systems of the eye due to appropriate imaging speeds and resolutions. However, it requires adjustment of the imaging protocols to ensure the detection of fast (tens of mm/s) and slow (fraction of mm/s) flows in the arteries, veins and capillaries of the eye fundus. It has also limitations connected to noise generated by the optical, mechanical and electronic components. In addition, various unwanted eye motions are easily detected with OCT, too. Thus, the simple concept of blood flow as a contrast mechanism in OCTA visualization of the circulatory systems of the eye requires solving several practical challenges.
Mathematical methods used for identification of the OCT signal variations caused by the blood flow typically relay on statistical analysis of the series of data sets acquired over time from the same location in the object. The most often used motion detection metrics are variance or correlation of the amplitude and/or phase of the complex OCT signal (methods calculating differences are special cases of the above mentioned approaches) [6–28]. To improve the outcome of those methods, i.e. to reduce noise in the OCTA images and fragmentation of the images of vessels, many data sets are often acquired over time from the same location in the object enabling application of various averaging techniques [26,29–35]. As a result, noise is reduced and vessels appear less fragmented in the OCTA images. However, the consequence of the acquisition of larger data sets is longer imaging time and increased number of image artifacts caused by the involuntary eye motions. Therefore, smaller data sets are typically used in connection with numerical filtration methods of OCTA images to circumvent motion artifacts or to enlarge the imaged areas of the object.
Numerical filtration is always applied to OCTA images. However, the details and effects of these procedures are rarely described in literature. Generation of en face OCTA projections from stacks of C-scans, by maximum intensity projection or calculation of the axial mean value, is by itself a filtration method of the 3-D OCTA data sets. Often, median filtering, Gaussian image smoothing or some other denoising method is also applied to 3-D OCTA data or angiograms (OCTA en face projections) with empirically adjusted filter window sizes. Another typically used procedure is scaling (in practice always enlarging) of the images. This involves interpolation algorithms which act as image filters. Aside from using these customary methods, publicly available in image processing software packages, researchers have been also developing methods accounting for features characteristic of the OCTA angiograms. Two approaches frequently appear in the literature: Gabor filtering [29] and Hessian filtering [36,37]. Recently, a method of shape-based classification of “vesselness” with anisotropic Gaussian filter was reported for contrast and connectivity improvement of vascular images in OCTA [38]. Many of those methods were adapted for OCT angiography from other medical imaging techniques [39–42].
In this paper we introduce a method of elliptical directional median filtering of the 3-D OCTA data sets. The goal is to use a set of image filters to reduce noise in the OCTA en face projections and improve the continuity of imaged vascular networks. The core filtering procedure uses a concept of structuring, directional kernels of shapes matching the geometry of the image features. Similar idea was presented in [43], where the authors used square and triangle kernels for digital image filtering. Application of median filter along the vessels was presented in magnetic resonance imaging in [40]. Here, we use rotating elliptical kernels to match the orientation of vessels in OCT angiograms and apply median filtering within the best locally matching ellipses. The effect is generation of OCT angiograms with improved vessels continuity and reduced noise.
2. Methods
2.1 OCT angiography setups and methods
To develop the elliptical directional filtering methods presented in this article we first used OCT data acquired with the Revo NX device (Optopol Technology Ltd., Zawiercie Poland [44]). This spectral-domain OCT setup operates at 830 nm center wavelength, with 5 µm axial and 18 µm transverse imaging resolutions. The imaging speed, measured as line rate of the camera used for the spectral interference signal detection, is 110 kHz. The OCT angiography method incorporated in the device: SOA (spectral domain OCT angiography), uses the absolute complex difference OCTA technique [26] to visualize the retinal vasculature. Details of the scan protocols used for imaging of a healthy subject and three diabetic retinopathy cases, performed in an ophthalmology clinic, are given in Table 1.
Table 1. OCT angiography scan protocol – Revo NX.
| A-scans | B-scan repeats | BM-scans | B-scans total | X range | Y range | A-scan repetition time | Imaging time | |
|---|---|---|---|---|---|---|---|---|
| 1. | 320 | 2 | 300 | 600 | 3 mm | 3 mm | 9 µs | 1.7 s |
| 2. | 512 | 2 | 512 | 1024 | 5 mm | 5 mm | 9 µs | 4.7 s |
Angiograms were automatically generated as maximum axial intensity projections of the 3-D OCTA data using segmentation of the anatomical retinal layers. Images of the “superficial vascular plexus” (en face projection of radial peripapillary capillary plexus, superficial vascular plexus, and intermediate capillary plexus) and the deep capillary plexus are presented.
To prove that the approach is universal and can be potentially used with any OCT device equipped with OCT angiography data acquisition and processing methods, we applied it to images obtained with a research-grade spectral-domain OCT setup described in details in our article by Rumiński et al. [26]. The imaging was performed in the macular area of a healthy eye. Here, pairs of B-scans were acquired from the same location in the eye fundus to enable direct implementation of the absolute complex difference OCTA method [26] according to the formula:
| (1) |
where IOCTA is intensity of the OCTA image points calculated from corresponding A-scans in the B-scan pairs. A are complex amplitudes obtained via Fourier transformation of the wavenumber-linearized and dispersion-compensated interference spectra. t stands for time and z, x are spatial coordinates in depth and along fast scanning axis. M is the number of B-scan repeats at subsequent positions in the object. Prior to calculations of the OCTA signal intensity, shifting of the A-scans and bulk motion correction was performed [26]. Details of the scan protocol are given in Table 2.
Table 2. OCT angiography scan protocol – research grade OCT system.
| A-scans | B-scan repeats | BM-scans | B-scans total | X range | Y range | A-scan repetition time | Imaging time |
|---|---|---|---|---|---|---|---|
| 300 | 2 | 300 | 600 | 2 mm | 2 mm | 15 µs | 3.15 s |
In parallel with the OCTA images, structural cross-sections were generated as mean images of the B-scan pairs. They were used for the correction of the axial B-scans displacements by correlation. The corrections were applied to the OCTA cross-sections. Finally, the position of the outer plexiform layer (OPL) was identified in the structural B-scans by peak detection and a surface approximating the shape of OPL was fitted using Zernike polynomials, as described elsewhere [31], see Fig. 1(a). This surface was used to empirically select the depth boundaries for generation of the OCTA en face projections, i.e. OCTA angiograms.
Fig. 1.
Three-dimensional data sets. a. Structural data set used for segmentation of the outer plexiform layer. The fitted surface was used for selection of depth positions of en face projections as indicated by the yellow and blue lines. b. OCTA data set indicating the orientation of three planes of interest used in our data processing. Green outlines – B-scans, XZ planes parallel to the fast scanning axis; blue – YZ planes, parallel to the slow scan axis; pink – C-scans, XY planes, perpendicular to the scanning beam. c. OCTA en face projections of the retinal vessels and the inner capillary plexus were generated as maximum intensity projection between the yellow lines. An example angiogram is schematically shown with yellow outline. The angiogram of the outer capillary plexus was generated between the blue lines.
2.2 Elliptical directional median filtering
In the design of our image filtering method we used the basic knowledge of OCT imaging specifics and the architecture (anatomy) of the retinal vascular system. Our assumptions were as follows:
- retinal vasculature is a web of meandering, locally highly directional tubes, oriented nearly perpendicularly to the imaging beam, thus vessels should appear as meandering, locally highly directional lines in OCTA en face projections,
- noise and artifacts generated in B-scan–wise data processing are not correlated among OCTA cross-sections, while images of vessels are correlated among neighboring B-scans,
- depth resolution can be sacrificed within reasonable limits with no loss of information in the resultant en face projections; as a rule of thumb the axial resolution loss should not exceed the thickness of the thinnest useful en face projection – the thickness of ~20 µm is often used to generate images of the retinal capillary plexuses.
In OCT imaging, specific terminology exists to describe the 3-D data sets. As in ultrasonography, a single image line obtained along the imaging beam, i.e. in depth, is known as an A-scan. It is represented as a 1-D matrix of pixels in the acquired data set. Traditionally, A-scans set the orientation of the Z-axis of the orthogonal coordinates system. A collection of A-scans acquired along a certain scanning line, for example along the fast scanning axis, forms a B-scan – a cross-sectional image. It is typically represented as a 2-D matrix of data pixels. The fasts scanning axis also typically sets the orientation of the X-axis. A set of B-scans acquired at subsequent locations in the object, typically along the slow scanning axis (Y-axis), forms a volumetric data set represented as a 3-D matrix. In OCTA, collections consisting of a few B-scans are typically acquired from the same location in the object to enable implementation of flow detection algorithms. Such groups of multiple B-scans are termed BM-scans. Cross-sectional images can be extracted from the 3-D data along any arbitrary slicing surface. If the surface is a plane perpendicular to the Z-axis (or depth-axis), then the resulting XY cross-section of single pixel thickness is typically called a C-scan. Stacks of C-scans selected from some arbitrary depth are used to generate en face projections. For clarity, the orientation of B-scans and C-scans in our data sets are depicted in Fig. 1(b).
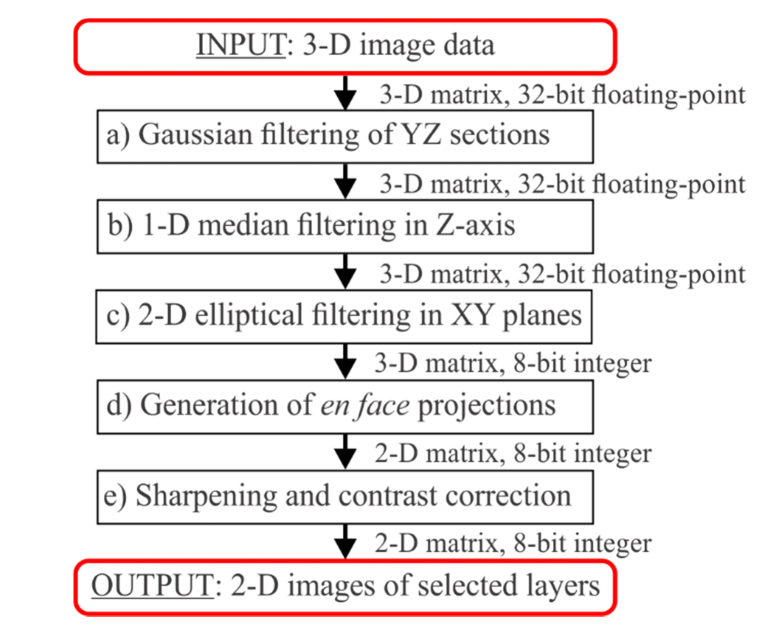
The data filtering pipeline is depicted in Fig. 2. The first two steps, Gaussian filtering of YZ sections and median filtering in Z-axis (a and b), are performed to remove the random noise, i.e. uncorrelated changes of the pixel values occurring among neighboring pixels. In practice, these initial steps remove the outliers of low and high intensity. The key filtering procedure is the third step (c), the 2-D elliptical filtering in XY planes (C-scans). Its role is to reduce the noise among the correlated pixel values. Correlated pixel values are associated with the imaged features, i.e. the meaningful signal. Variations of this signal originate from the speckle noise, statistical character of the blood flow, and the random noise. The statistical character of the blood flow may have a considerable influence on the visualization of the capillary vessels. The intuitive explanation is as follows. Only one blood cell can move at any given time through a selected imaged point due to the size of the vascular lumen comparable with the sizes of the blood cells. If the blood cell doesn’t move sufficiently between the acquisition time intervals, no OCTA signal will be detected at that point of the vessel. If in a different part of the same vessel a blood cell has moved sufficiently, OCTA signal will be detected at that point. Thus, depending on the variations of the blood cells motion, variations of the meaningful OCTA signal may be observed within the images of the vessels.
Fig. 2.
Data filtering pipeline.
-
a)
Gaussian filtering of YZ sections
Filtering along the slow scan axis, i.e. in the YZ planes (blue rectangle in Fig. 1(b)) of the 3-D data sets, is performed as an initial step to reduce the random noise i.e. uncorrelated OCTA signal variations. Such filtering is not commonly used in OCTA data processing. The rationale for its implementation is to use the readily available data from the third dimension of the OCT scan to reduce the occurrence of the outliers of low and high intensity. Here, we have used a basic 2-D Gaussian kernel with empirically selected window size of 3 pixels by 3 pixels and the width given by the standard deviation of a Gaussian function: σ = 1 pixel. However, the window size may depend on specific scanning protocols, pixel size along the depth-axis, axial and transverse imaging resolutions. Therefore, it should be adjusted depending on specific OCT apparatus and/or imaging protocol.
-
b)
1-D median filtering in depth-axis for axial noise removal
The 1-D median filter is applied to de-noise the A-scans by removing the outliers along the Z-axis. The method replaces every voxel in the 3-D data set with the median of the closest neighborhood in its A-scan. Here, we have implemented the window length of 9 pixels. However, the median window length may depend on the specific data acquisition system of the OCT setup, i.e. on the pixel size along the depth-axis and axial imaging resolution.
The combined effect of the Gaussian filtering of YZ sections and 1-D median filtering in depth-axis on the C-scans is demonstrated in Table 3, cell 1b.
-
c)
2-D directional elliptical filtering for knowledge-based shape correction
In the construction of the structuring filter, we use the knowledge that the orientation of the majority of retinal vessels is nearly perpendicular to the scanning beam of light. Thus, we apply the directional filtering in subsequent C-scans (XY planes indicated with pink rectangle in Fig. 1(b)). Using the knowledge that images of vessels form elongated shapes in the XY- sections, we define an elliptical filter-kernel. The images of vessels can have all possible orientations in the XY planes, therefore we allow the kernel to rotate in a search for the most likely local orientation of the vessels in every point of the XY plane, and in all subsequent C-scans in the 3-D data set. The filtering is then done by calculation of the median within the kernels with the smallest value of an error function.
Let Cz (x, y) represent a C-scan at depth z in the volumetric OCTA data set. The orientation of our orthogonal reference system is indicated in Fig. 1. Here, we use discrete values of the x, y, z coordinates pointing to the voxels v(x, y, z).
We create a collection of elliptical kernels {E0, E1, …, EN-1}:(2) n – an index numbering the ellipses in the collection,
N – number of ellipses,
a, c – the semi-major and semi-minor axes of the ellipse,
βn – a rotation angle of the nth ellipse, relative to the x-axis,
α – initial rotation angle.
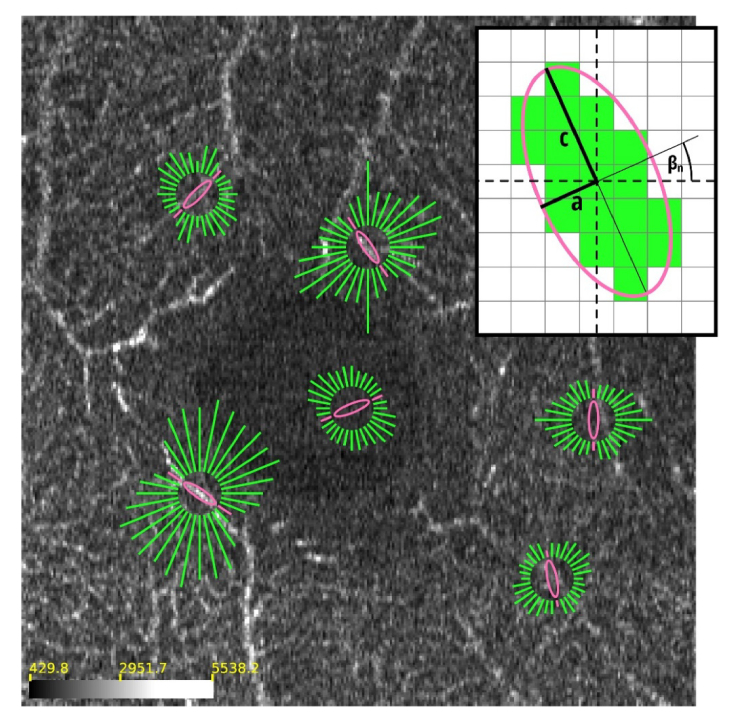
The ellipses are discretized as illustrated in the inset of Fig. 2. All pixels fully encircled by the ellipse are given a value of 1. Pixels intersected by the ellipse are given a value of 1 if at least 50% of the pixel area falls inside the ellipse. All other pixels are given a value of 0. The number N of ellipses in the collection depends on the pixelization of the discretized kernel. The angles of rotation are selected in such a way that all the discretized ellipses contain a different collection of pixels, i.e. have different discretized shapes. In other words, the discretization of the rotation angle depends on the lengths (in pixels) of the ellipse axes a and c.
The collection of N ellipses is applied to every x, y point of the C-scan, in all subsequent C-scans in the 3-D data set. The ellipses are centered at the x, y points. To find the ellipse with the best match to the orientation of the local features in the OCTA images, we define a measure of similarity as an error function, :(3) µn, σn – mean and standard deviation of the OCTA signal intensity within the nth discretized ellipse,
σz – standard deviation of the OCTA signal calculated from all pixels in the C-scan at depth z.
The proposed metric uses local statistics to find the most likely match and uses global standard deviation value as a normalization term. When an ellipse lies along the vessel, the σn (x, y) value is low and consequently the Err function has also a low value at the x, y point of the C-scan. For an ellipse that crosses the vessel, the value of σn (x, y) is high and the value of the metric is closer to 1. The best matching ellipse,, at a given voxel v (x, y, z), is selected as the one with the smallest Err function value:(4) where nzBEST(x, y) is the index of the best match in the collection of discretized ellipses {E0, E1, …, EN-1}. The procedure of the best ellipse selection is illustrated in Fig. 2.
The final step of the elliptical median filtering is calculation of the median value of the OCTA signal within the best matching ellipse at all voxels, v (x, y, z), in subsequent C-scans, Cz (x, y)(5) where the curl brackets indicate a collection of voxels within the best matching ellipse at point x, y. After this step, the histogram of intensity in the three-dimensional data set is scaled to 0-255 range and the images are converted to 8-bit integer numerical-representation.
-
d)
Generation of en face projection images
The next step of the data processing is generation of en face projection images. The surface approximating the shape of the outer plexiform layer was used to select depth ranges in the filtered 3-D OCTA data set. We generated angiograms at two depths as maximum intensity projections (MIP) of the OCTA data. The first visualizes the retinal vasculature and the inner capillary plexus. The second displays the outer capillary plexus. The outer plexiform layer segmentation lines and their depth positions used for generation of the en face projections are illustrated in Fig. 1(a, c).
-
e)
Sharpening of the en face projections and contrast enhancement
In order to improve the definition of the vessels in the final en face projections, we enhanced high spatial frequencies (large image gradients) using a standard unsharp mask filter. First, the method uses image blurring by Gaussian smoothing. The blurred image is then subtracted from the original one to find the edges of the imaged features. The sharpened image is created by addition of the edge containing image, multiplied by empirically selected positive weight, to the original image. The thickness of the edges used for image sharpening is adjusted by tuning the width (standard deviation) of the Gaussian function. Then, a standard and commonly used contrast enhancement is implemented.
Table 3. Values of the filtering parameters.
| Commercial instrument: Coperincus Revo NX | Laboratory grade OCT setup |
|---|---|
| a) Gaussian filtering of YZ sections | |
| • 2D window size: ΔY x ΔZ = 3 x 3 pixels → ΔY x ΔZ = 30 µm x 7.8 µm • Gaussian kernel with σ = 1 pixel |
• 2D window size: ΔY x ΔZ = 3 x 3 pixels → ΔY x ΔZ = 20 µm x 2 µm • Gaussian kernel with σ = 1 pixel |
| b) 1-D median filtering in Z-axis | |
| 1D window size: ΔZ = 9 pixels → ΔZ = (23 µm) |
1D window size: ΔZ = 9 pixels → ΔZ = (6.3 µm) |
| c) 2-D filtering of C-scans | |
|
a = 0.5 pixels → a = 4.7 µm c = 3.25 pixels → c = 30 µm N = 8 |
a = 0.5 pixels → a = 3.3 µm c = 4 pixels → c = 26.8 µm N = 8 |
2.3 Practical implementation of the elliptical directional median filtering
We have implemented the elliptical directional median filtering using custom programming in C + + environment. The processing was performed automatically. In Table 3 we have listed values of filtering parameters used to generate the images presented in Figs. 4–6.
Fig. 4.
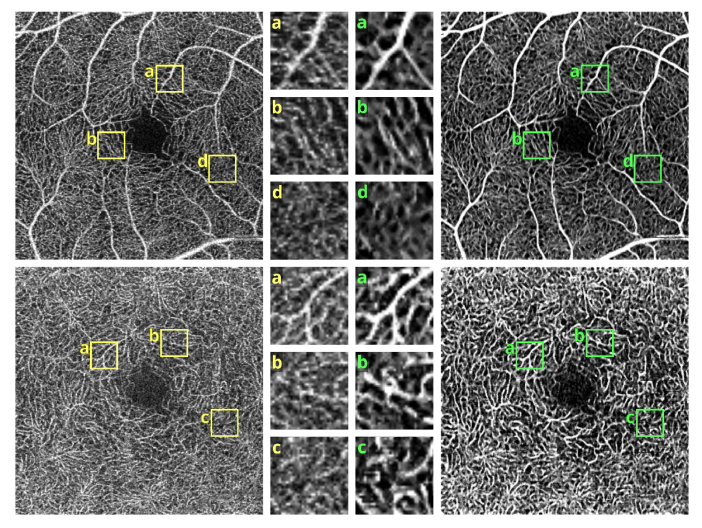
OCT angiograms of a normal eye obtained with Revo NX, scan protocol 1. Top row - the superficial vascular plexus. Bottom row – deep capillary plexus. Left – unfiltered data. Right – after application of the elliptical directional filtering processing pipeline. Insets in the middle – enlarged regions of interest comparing the effects of the filtering procedure. Image size: 3 x 3 mm, insets size: 0.32 x 0.32 mm.
Fig. 6.
OCT angiograms of diabetic retinopathy cases obtained with Revo NX. Left row – not filtered images. Right row – angiograms after application of the elliptical directional median filtering. Case 1: non-proliferative, early stage; scan protocol 1. Case 2: non-proliferative, enlarged foveal avascular zone, decreased vascular density visible. Case 3: proliferative, after panretinal laser photocoagulation, nonperfusion areas and tortuous vessels present. Pink circle and arrows – foveal avascular zone. Green arrows – non-perfusion areas. Blue arrows – microaneurysms. Case 1 and 2 – image size 3 x 3 mm (scan protocol 1 in Table 2). Case 3 – image size 5 x5 mm (scan protocol 2 in Table 2).
The ellipse parameters a and c were selected empirically. Several values were applied and the resultant images were presented to experts in the OCTA technique (MS, AS, IG) and an ophthalmologist (BS). The selection of the range of tested values was guided by the physical dimensions of the imaged vascular networks. The minor semi-axis a should be of an order of the smallest vascular lumen radius visualized in C-scans. The major semi-axis c can be estimated by taking into account the mean length of straight parts of the vessels and mean distance between the vascular junctions. Here, the selection was guided by visual inspection of the images. More advanced analysis of the images can be also performed to provide initial estimate of the tortuosity of the imaged vascular networks or to define the types, areas and distances between the vascular junctions. Note however that such analyses are typically preceded by the filtering of the images which is actually the goal of the image processing following these preparatory steps. A dilemma then arises how to perform the initial or recursive filtering.
Depending on the implemented scan protocols, the physical dimensions of the vascular networks translate into pixelization of their images. This pixelization determines the number N of rotated ellipses, i.e. the increment of the rotation angle. In practice, the guidance for the number N are the shapes of the discretized ellipses. On one hand, the collection should not contain identical kernel shapes since they will not influence the results but will increase the computational cost. On the other hand, the smallest difference of the kernel shapes should not be larger than one pixel. The latter criterion should be however tested in practice to determine if the single-pixel difference has a non-negligible impact on the filtering outcome. For the purpose of this paper, we have empirically selected the number N = 8 by visual comparison of the resultant images.
2.4 Filter-performance evaluation metric
To evaluate the performance of the elliptical directional filter depending on the kernel parameters, we propose to use a vascular continuity metric (VCont). We define VCont as a function which counts the number of vascular fragments. The vascular fragments are defined as clusters of connected pixels exceeding a selected intensity threshold value. With the increasing continuity of vessels, the number of vascular fragments will decrease. To measure whether the continuity of vessels has improved after application of the filtering procedure, the number of vascular fragments in the input image (A) is divided by the number of vascular fragments in the filtered image (B):
| (6) |
VCont (A,B) > 1 indicates improvement of vascular continuity in image B relatively to image A.
To calculate the metric, we have thresholded the reference image (not filtered) to leave only an arbitrarily selected portion (30%) of pixels with the largest intensity values. The number of vascular fragments was automatically counted providing N(A). The thresholded reference image was then used to set the intensity threshold in the filtered image B in such a way that the thicknesses of the vessels were preserved. The number of vascular fragments was then counted in the tresholded image B providing N(B). The value VCont (A, B) was obtained by dividing N(A) by N(B).
3. Results and discussion
Demonstration of the elliptical directional filtering method in a normal eye
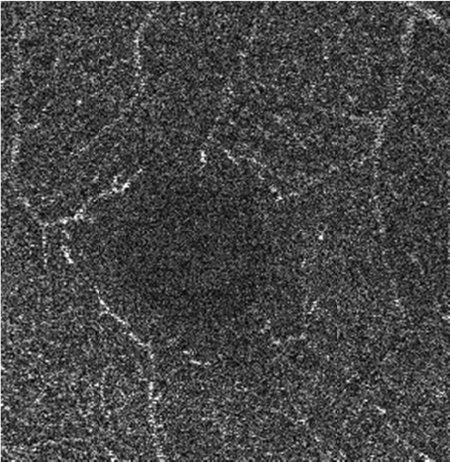
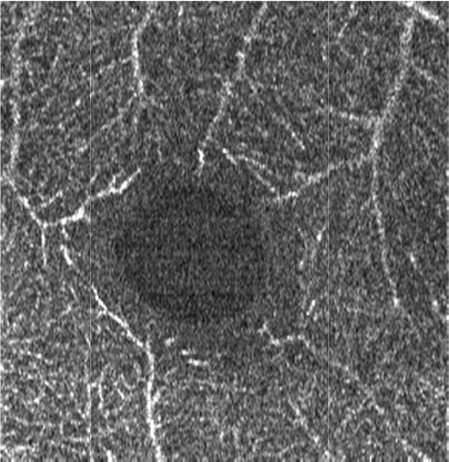
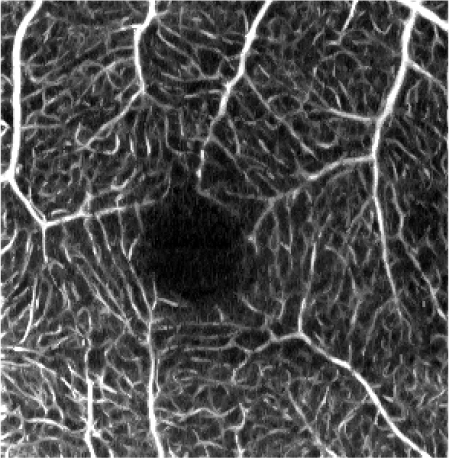
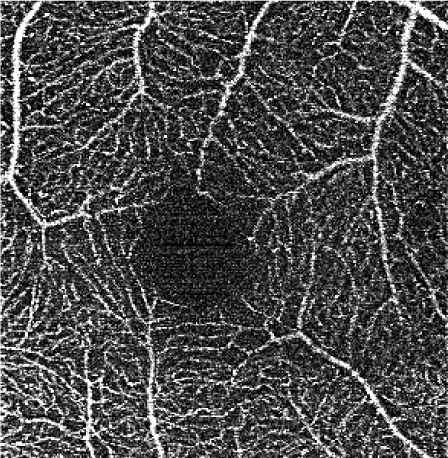
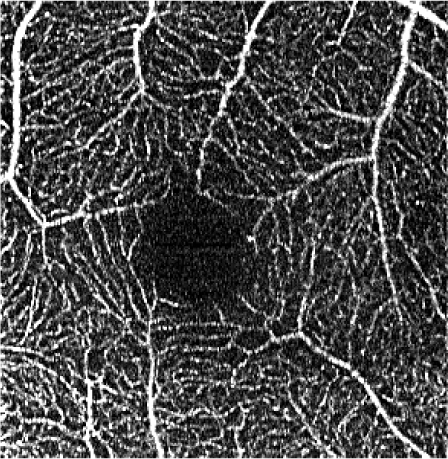
The effects of subsequent steps of the elliptical directional filtering method are summarized in Table 4. The summary shows the first of the two generated vascular layers, i.e. the angiograms of the retinal vasculature and the inner capillary plexus. The first row in the table illustrates the effects of filtering in an example single C-scan from the 3-D OCTA data set. Application of the first two preparatory steps, the YZ Gaussian filter and 1-D median filter, improves the visibility of vessels (image 1.b in Table 4). The “granular” noise is however still present within the vessels and in the image areas devoid of vasculature, e.g. in the foveal avascular zone forming a characteristic dark circle in the center of the angiograms. This can be attributed to minimal transverse filtering of the C-scans – the Gaussian filter affects only groups of 3 pixels in the Y direction (slow scanning direction). The effect of improved visibility of vessels can be attributed to the axial 1-D median filtering. It effectively combines information from stacks of neighboring C-scans but also degrades the axial resolution of the data set. Here, we have used a 9-pixel long window, corresponding to ~6 µm depth-range, which is comparable with the axial imaging resolution of our research-grade OCT imaging system. The key step of the processing pipeline is the elliptical directional filtering of the C-scans. It reduces the granular noise and smooths-out the images of vessels as demonstrated in angiogram 1.c. in Table 4.
Table 4. Demonstration of the image filtering steps in the angiograms of the superficial retinal vascular plexus of a normal eye. Images obtained with the research grade OCT setup.
| a. Unfiltered data |
b. YZ filter: 3x3 pixels (20x2 µm) Gaussian kernel, σ = 1 pixel & 1-D median filter: 9 pixels (6 µm) kernel length |
c. XY directional elliptical median filter: a = 0.5, c = 4 pixels, α = 0 deg (a = 3.35 µm, c = 26.8 µm), N = 8 |
|
|---|---|---|---|
| 1. Single C-scan |
|
|

|
| 2. MIP* of the vascular layer |

|

|
|
| 3. Sharpening and contrast correction |
|
|

|
MIP – maximum intensity projection
Rows 2 and 3 of Table 4 show the angiograms of the retinal vasculature and the inner capillary plexus. OCTA en face projection generated from the unfiltered data set results in a noisy angiogram. The noisy appearance is enhanced after application of the sharpening and contrast enhancement steps of the processing pipeline. The initial YZ Gaussian and 1-D median filters only marginally reduce noisy appearance of the images. The effects of the elliptical directional filtering can be appreciated in Figs. 2(c) and 3(c) of Table 4. The granular noise is reduced resulting in a more uniform OCTA signal intensity distribution within the vessels. The vascular networks are more clearly visualized.
Fig. 3.
Demonstration of the best-ellipse search procedure in selected locations of an example C-scan (XY slice through the 3-D data set with the thickness of 1 pixel). The inset illustrates the discretization of the ellipses used as the filter kernels. Error functions (Err) are used as a metric to find the most likely match from the collection of ellipses oriented along the directions of the green lines. The lengths of the green lines are proportional to the error function values. The lower the value of the metric, the shorter the green line and the more likely the orientation of the ellipse follows the local orientation of vessels. The pink ellipses are the best choices according to our procedure. They are shown together with pink lines indicating their error functions. The best-ellipse search is performed automatically at each pixel of each C-scan prior to generation of en face projections. The scale bar indicates OCTA signal intensity in the floating point, 32-bit data representation. The image size is 2 x 2 mm. The associated media file (Visualization 1 (80.7MB, mp4) ) demonstrated the best-ellipse search procedure concept in subsequent C-scans.
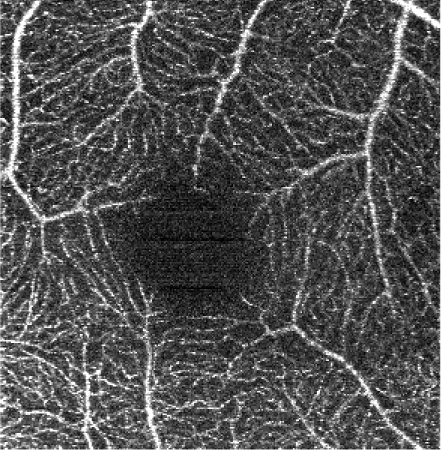
The influence of various elliptical kernel parameters values on the output OCT angiograms is demonstrated in rows 2-4 of Table 5. For small values of c and a (e.g. 2.5 and 0.5 pixels), the results of the filtering are similar to the effects of application of a symmetrical median filter (c = a = 2 pixels). Increasing values of the c and a parameter improves the noise reduction. All values of the vascular continuity metric (VCont) are larger than 1, i.e. filtering reduces the fragmentation of vessels. In each row, VCont values increase with the growing parameter a. That is, increasing the width of the elliptical kernel with no change of its length, tends to increase the vascular continuity as compared to the unfiltered reference image. Here we tested values of a = 3.4 μm, 5.4 μm and 10 μm, comparable with the vascular radii of the retinal capillaries. On the other hand, in each column VCont values have a descending tendency, with the exception of the first column in which a local maximum exists for c = 26.8 μm and a = 3.4 μm. Intuitively, with increasing length of the kernel, filtering decreases the fragmentation of vessels. However, if parameter c becomes too large in combination with parameter a, then the images of vessels are excessively blurred and the visibility of the smallest vessels may decrease. In consequence, fragmentation of the vessels in the thresholded image increases causing a decrease of VCont values. The local maximum in the first column may suggest a good balance between the parameters c and a, resulting in a reasonable degree of filtering. In this case it also coincides with the parameters values experimentally chosen by the experts for the optimum filtering.
Table 5. Influence of the elliptical kernel parameter values on the OCTA en face projections. Parameters and evaluation-metrics values are given below the images. Images obtained with the research grade OCT setup.
| Reference image | Symmetrical median filtering | |
|---|---|---|
 No filtering |
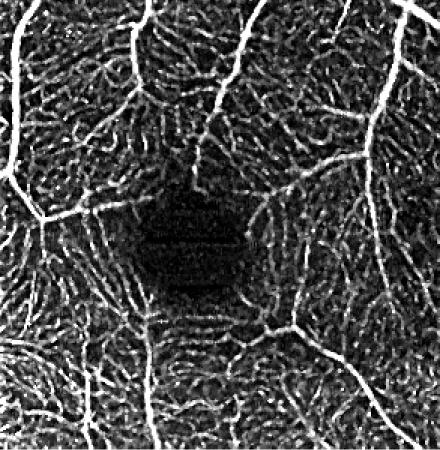 c = a = 2 pixels |
 c = a = 4 pixels |
| Elliptical median filtering | ||
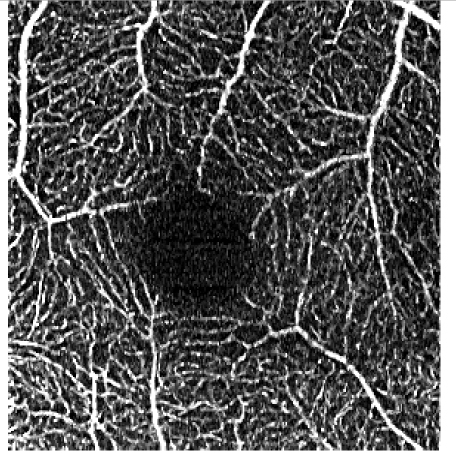 c = 2.5 pixels, a = 0.5 pixels c = 16.8 μm, a = 3.3 μm VCont = 1.52 |
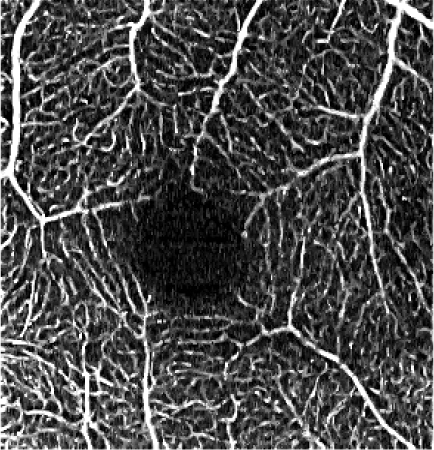 c = 2.5 pixels, a = 0.8 pixels c = 16.8 μm, a = 5.4 μm VCont = 1.78 |
 c = 2.5 pixels, a = 1.5 pixels c = 16.8 μm, a = 10 μm VCont = 2.14 |
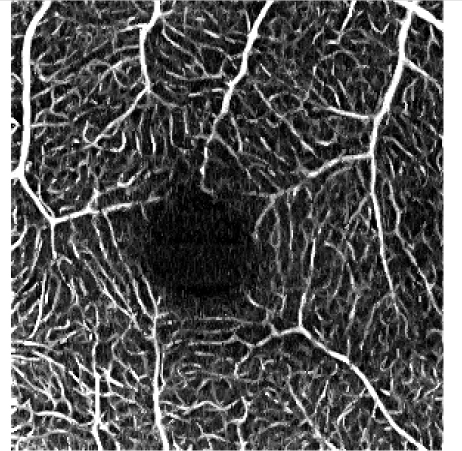 c = 4 pixels, a = 0.5 pixels c = 26.8 μm, a = 3.3 μm VCont = 1.62 |
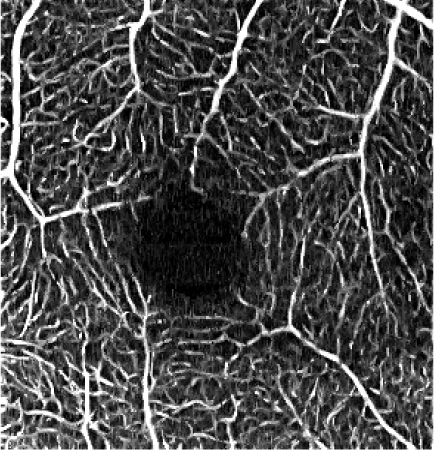 c = 4 pixels, a = 0.8 pixels c = 26.8 μm, a = 5.4 μm VCont = 1.72 |
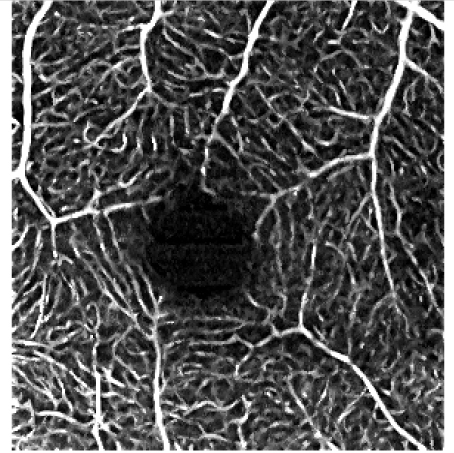 c = 4 pixels, a = 1.5 pixels c = 26.8 μm, a = 10 μm VCont = 2.07 |
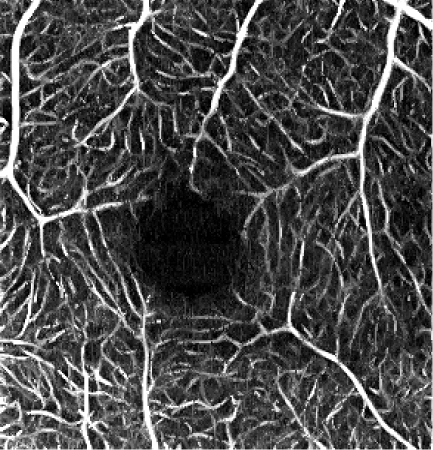 c = 6 pixels, a = 0.5 pixels c = 40.2 μm, a = 3.3 μm VCont = 1.39 |
 c = 6 pixels, a = 0.8 pixels c = 40.2 μm, a = 5.4 μm VCont = 1.53 |
 c = 6 pixels, a = 1.5 pixels c = 40.2 μm, a = 10 μm VCont = 1.66 |
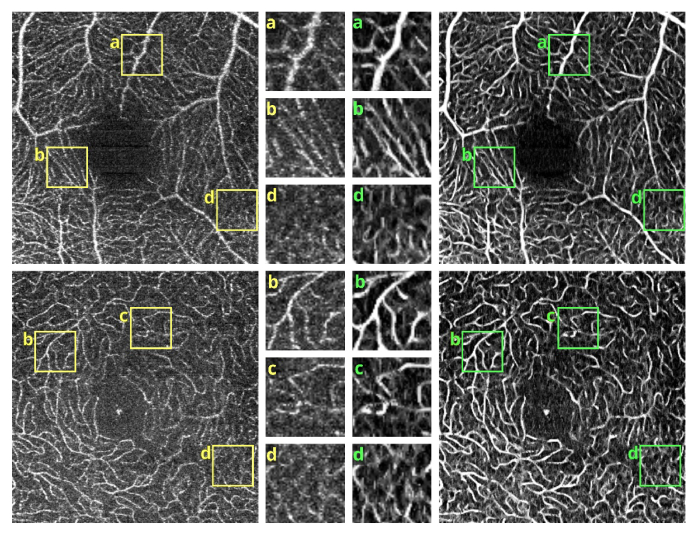
Figures 4 and 5 show detailed comparison of the OCT angiograms generated from the unfiltered and filtered OCTA data, obtained with Revo NX and with the research-grade setup. Retinal vessels and inner capillary plexus are shown in top rows. The deep capillary plexus is presented in bottom rows of the two figures. In unfiltered images, even well-defined vessels, e.g. insets (a) in Fig. 4 and 5, have noisy appearance. The elliptical directional filtering smooths-out the angiograms leaving the geometrical features of these vessels unaltered. Capillaries tend to appear fragmented in the unfiltered images. The fragmentation may appear as small, random breaks in otherwise well-defined vascular paths, e.g. insets (b) in Fig. 4 and Fig. 5, or they may appear as disconnected parts of the vasculature, e.g. insets (c) in Fig. 4 and 5. In the first case, our filtering method fills-in the gaps leaving all other characteristic features unchanged. In the second case the filtering finds the statistically most likely local orientations of vessels and generates the most probable shape correction, improving the continuity of vascular paths. The last demonstrated example are noisy regions with no apparent vascular networks in unfiltered angiograms, e.g. insets (d) in Fig. 4 and 5. Also here, the filtering results in generation of most probable fragments of vascular paths by statistical analysis of the OCTA intensity-distribution trends in the local neighborhood. Finally, it is worth noticing that in the foveal avascular zone (dark circular area in the center of the angiograms) no images of vessels are generated, which demonstrates that the elliptical directional filtering correctly differentiates between noisy vascular networks and noisy avascular areas in the OCTA data obtained in the imaging of normal eye.
Fig. 5.
OCT angiograms of a normal eye obtained with a research-grade OCT system. Top row - the superficial vascular plexus. Bottom row – deep capillary plexus. Left – unfiltered data. Right – after application of the elliptical directional filtering processing pipeline. The bright spot in the center is a central foveal reflection. Insets in the middle – enlarged regions of interest comparing the effects of the filtering procedure. Image size: 2 x 2 mm, insets size: 0.32 x 0.32 mm.
Imaging of diabetic retinopathy cases
The influence of the elliptical directional filtering on the OCTA imaging of retinal pathology is illustrated in Fig. 6. We show three diabetic retinopathy cases with increasing severity of vascular changes, imaged with Revo NX.
Case 1 is a 68 years old Caucasian female with non-proliferative diabetic retinopathy, early stage of the disease. We imaged the right eye, with best corrected visual acuity (BCVA) 0.9 (decimal scale). In this case filtering provides improved depiction of blood vessels and reveals the irregularity of the foveal avascular zone (FAZ). Visualizing the retinal capillary network around FAZ can be a useful tool in the very early diagnosis of diabetic retinopathy. For precise assessment of the vascular density and the FAZ area, the highest image quality with a good contrast is essential.
Case 2 is a 65 years old Caucasian male with non-proliferative diabetic retinopathy with enlarged foveal avascular zone. Images were taken in the right eye, BCVA 0.6. Reduced noise and improved continuity of vessels enables better assessment of the foveal avascular zone enlargement (pink arrow), a sign of increasing ischemia. Also, filtering helps in evaluation of the retinal capillaries’ density – here decreased, as indicated with green arrows. The image quality became sufficient to reveal the presence of a few microaneurysms (blue arrows) in the nasal macula.
Case 3 is a 33 years old Caucasian male with proliferative diabetic retinopathy, with extensive capillary non-perfusion areas. Treatment with panretinal laser photocoagulation (PRP) was applied to the peripheral retina due to abnormal blood vessels. Images of the left eye with BCVA of 0.1 are shown. Here, the suppressed noise improves visualization of the non-perfusion regions (green arrows). The early detection of non-perfused areas in diabetic retinopathy is crucial because they are hallmark features of ischemic retinal disease. Improved continuity of the visualized vascular paths emphasizes the perfused but tortuous capillaries. This can be utilised for staging of the diabetic retinopathy and guiding the therapy.
4. Summary and conclusions
OCT angiography provides a set of challenges in the eye imaging. One of them is noise affecting the visualization of vessels, especially of small calibers – the capillaries. These random OCTA signal variations have an origin in the imaging technique but also in statistical character of motion of the blood cells through the narrow lumens of capillary vessels. We have provided an overview how the noise affects visualization of vessels in OCTA imaging of the eye fundus. For the demonstration we have selected the two-frame imaging regime. It minimizes the size of data sets, their acquisition times and enables maximization of the imaged areas, which are advantages desirable in clinical imaging. However, it is also one of the most noise-wise unfavorable OCTA scanning regimes and provides a challenge in image processing, which should reduce the noise without altering features relevant for the diagnostics. With these objectives in mind, we have developed a method of directional median filtering with elliptical structuring elements.
The median (or similar statistical operations, e.g. mean) typically provides the most effective filtering if a large number of points of the filtered image feature can be included to provide a good statistical sample of the signal. Intuitively, the smaller is the sample the less effective is the filtering. If the imaged features are elongated, then application of symmetrical kernels (e.g. square or circular) forces kernel sizes proportional to the smallest dimension of that feature. Otherwise, the information about vessels may be lost in the noise. Application of elongated kernels enables to include a larger number of meaningful data pixels and to avoid inclusion of meaningless noise in the filtering procedure. The advantage of using filters with kernel shapes matching the expected image features over symmetrical kernels is therefore in the inclusion of larger number of most likely useful data pixels.
We have demonstrated that our method reduces the noise and fragmentation of OCTA images by finding the most likely local orientations of vascular paths. In the areas where vasculature is present, the OCTA signal intensity typically shows local directionality which persists in the closest neighborhood. The rotation of ellipses enables finding those local trends in spatial distribution of the OCTA signal. In the straight sections of vessels, the elliptical kernels typically include only signal from the inside of the vessel in the median filtering. The influence of noise from the outside of the vessel is minimized. In the vascular junctions, the ellipses are aligned along the longest straight paths across the vessel branching. Since a part of the kernel may include the signal from the outside of the vessels, the filtering of the vascular junctions may be affected by the surrounding noise more than are straight parts of the vessels. If no trends exist, i.e. in the avascular regions of the image, the orientation of the ellipses changes randomly from voxel to voxel and returns a median of local noise distribution. As a result, the signal variations within the vessels are smoothed-out, vessels appear de-fragmented and the noise is tuned down.
To evaluate the influence of the elliptical kernel parameters on the resultant OCTA images, we have introduced a vascular continuity metric (VCont). With the use of this metric we have demonstrated that long and narrow kernels should be considered for median filtering of the OCT angiograms. However, care needs to be taken to avoid excessive lengths of the kernels which may result in “over-filtering” of the images and loss of the visibility of the small vessels. There can be of course further discussion whether the proposed metric is “good”. For example, if its values reflect the quality of the images in a way which would be consistent with the judgement of an experienced human observer, or if it would enable finding the optimum filtering parameters automatically. The VCont metric measures only one possible feature of the filtered images – the continuity of vessels. While it correctly informs about increasing connectivity of vessels, it does not recognize when “over-filtering” occurs which may, for example, excessively blur the images of vessels, introduce erroneous connection between vessels or cause loss of visibility of small vessels. For this reason, VCont alone is not sufficient for the above-mentioned purposes. Additional metrics should be developed for application in combination with VCont to recognize the effects of over-filtering in the OCTA images. In such multi-parametric space extremum may exist pointing at the optimal filtering parameters. However, this topic is out of the scope of our paper and may be a subject of further study.
In the elliptical median filtering method, we have implemented only global contrast enhancement and aimed at preservation of the signal intensities gradation among the vessels. Vessels with strong OCTA signal in the unfiltered data have high pixel values in the filtered images. Vessels with weak OCTA signal prior to filtering have low pixel values after the filtering. Important information about changes in the blood flow may be included in the OCTA signal intensity. Therefore, we want to avoid excessive saturation of vessels in the images which may lead to loss of potentially useful information. Similarly, adjusting the contrast locally may change the relative differences in OCTA signal intensity among the imaged vessels and lead to the disruption of useful information. Moreover, image areas with weak signals are more likely suspects of erroneous information and therefore should be easy to identify and treated with greater caution in the interpretation of the results.
Erroneous information which may be introduced to OCTA images by any filtering procedure, including our elliptical median filtering method, is generation of false positive and/or false negative vessels, i.e. generation of images of vessels in the areas where no vessels are present in the imaged eye, or incorrect erasing of images of vessels. Such flawed identification of vessels is a potential limitation of our method which requires further investigation.
A typical issue in data filtering is degradation of the image resolution. In our method, the worst resolution loss is along the depth direction due to median filtering with a window length (6 µm) comparable to axial imaging resolution (5 µm). This however does not affect the visualization of retinal vascular networks in the en face projections. The resolution loss in the transverse direction (XY planes) depends on the selected parameters of the elliptical kernels. In the presented results, the minor axis of the ellipses was one pixel. The major axis was 8-pixels long but ellipses are aligned along the vessels. The loss of transverse image resolution can be minimized by appropriate selection of the ellipse parameters.
Numerically, elliptical filtering is straightforward to implement, although application of the elliptical filter should be performed in well motion-corrected data sets to provide the best results. I.e. images of the vascular networks should not contain discontinuities, for example caused by misalignment of the B-scans. If such eye motion induced artefacts exist in the data set, they will not be filtered out and will still appear in the filtered images as characteristic lines crossing the entire extent of the en face projections. The algorithm is easy to parallelize on central processing unit (CPU) and is well suited for execution on graphics processing unit (GPU). We performed our data processing on CPU with a code written in C + + and parallelized it with OpenMP programming interface. The implementation takes less than 10s to filter a 300x320x864 voxel data-matrix on a standard personal computer (PC) with i5-6600K CPU.
We believe that the simplicity of the method, easy implementation combined with decent results obtained in noisy data sets, makes the elliptical directional median filtering a useful tool in information-preserving quality improvement of the OCT angiograms.
Acknowledgements
Presented work is based on methods developed by authors for Optopol Technology Ltd. as a subject of a commercial grant.
We dedicate this work to our mentor Prof. Andrzej Kowalczyk, a creator of the OCT school at Nicolaus Copernicus University in Torun, Poland who retires this year from his academic duties.
Funding
Commercial grant from Optopol Technology Ltd. to AM2M Ltd. L.P (No. AM2M/05/07/2017).
Disclosures
AR: AM2M Ltd. L.P. (E), Optopol Technology Ltd. (F); IG: AM2M Ltd. L.P. (I,P); JK: AM2M Ltd. L.P. (E), Optopol Technology Ltd. (F); TG: AM2M Ltd. L.P. (E), Optopol Technology Ltd. (F); MC: AM2M Ltd. L.P. (E), Optopol Technology Ltd. (F); EP: no commercial relationships; BLS: Oculomedica Eye Center (I), Optopol Technology Ltd. (C); AS: AM2M Ltd. L.P. (I,P), Optopol Technology Ltd. (F); MS: AM2M Ltd. L.P. (I,P). The authors declare that there are no conflicts of interest related to this article.
References
- 1.Makita S., Hong Y., Yamanari M., Yatagai T., Yasuno Y., “Optical coherence angiography,” Opt. Express 14(17), 7821–7840 (2006). 10.1364/OE.14.007821 [DOI] [PubMed] [Google Scholar]
- 2.Zhang A., Zhang Q., Chen C.-L., Wang R. K., “Methods and algorithms for optical coherence tomography-based angiography: a review and comparison,” J. Biomed. Opt. 20(10), 100901 (2015). 10.1117/1.JBO.20.10.100901 [DOI] [PMC free article] [PubMed] [Google Scholar]
- 3.Gao S. S., Jia Y., Zhang M., Su J. P., Liu G., Hwang T. S., Bailey S. T., Huang D., “Optical Coherence Tomography Angiography,” Invest. Ophthalmol. Vis. Sci. 57(9), OCT27 (2016). 10.1167/iovs.15-19043 [DOI] [PMC free article] [PubMed] [Google Scholar]
- 4.Chen C.-L., Wang R. K., “Optical coherence tomography based angiography [Invited],” Biomed. Opt. Express 8(2), 1056–1082 (2017). 10.1364/BOE.8.001056 [DOI] [PMC free article] [PubMed] [Google Scholar]
- 5.Spaide R. F., Fujimoto J. G., Waheed N. K., Sadda S. R., Staurenghi G., “Optical coherence tomography angiography,” Prog. Retin. Eye Res. 64, 1–55 (2018). 10.1016/j.preteyeres.2017.11.003 [DOI] [PMC free article] [PubMed] [Google Scholar]
- 6.Lee E. C., de Boer J. F., Mujat M., Lim H., Yun S. H., “In vivo optical frequency domain imaging of human retina and choroid,” Opt. Express 14(10), 4403–4411 (2006). 10.1364/OE.14.004403 [DOI] [PubMed] [Google Scholar]
- 7.Bachmann A. H., Villiger M. L., Blatter C., Lasser T., Leitgeb R. A., “Resonant Doppler flow imaging and optical vivisection of retinal blood vessels,” Opt. Express 15(2), 408–422 (2007). 10.1364/OE.15.000408 [DOI] [PubMed] [Google Scholar]
- 8.Fingler J., Schwartz D., Yang C., Fraser S. E., “Mobility and transverse flow visualization using phase variance contrast with spectral domain optical coherence tomography,” Opt. Express 15(20), 12636–12653 (2007). 10.1364/OE.15.012636 [DOI] [PubMed] [Google Scholar]
- 9.Wang R. K., Jacques S. L., Ma Z., Hurst S., Hanson S. R., Gruber A., “Three dimensional optical angiography,” Opt. Express 15(7), 4083–4097 (2007). 10.1364/OE.15.004083 [DOI] [PubMed] [Google Scholar]
- 10.An L., Wang R. K. K., “In vivo volumetric imaging of vascular perfusion within human retina and choroids with optical micro-angiography,” Opt. Express 16(15), 11438–11452 (2008). 10.1364/OE.16.011438 [DOI] [PubMed] [Google Scholar]
- 11.Mariampillai A., Standish B. A., Moriyama E. H., Khurana M., Munce N. R., Leung M. K. K., Jiang J., Cable A., Wilson B. C., Vitkin I. A., Yang V. X. D., “Speckle variance detection of microvasculature using swept-source optical coherence tomography,” Opt. Lett. 33(13), 1530–1532 (2008). 10.1364/OL.33.001530 [DOI] [PubMed] [Google Scholar]
- 12.Fingler J., Zawadzki R. J., Werner J. S., Schwartz D., Fraser S. E., “Volumetric microvascular imaging of human retina using optical coherence tomography with a novel motion contrast technique,” Opt. Express 17(24), 22190–22200 (2009). 10.1364/OE.17.022190 [DOI] [PMC free article] [PubMed] [Google Scholar]
- 13.Grulkowski I., Gorczynska I., Szkulmowski M., Szlag D., Szkulmowska A., Leitgeb R. A., Kowalczyk A., Wojtkowski M., “Scanning protocols dedicated to smart velocity ranging in spectral OCT,” Opt. Express 17(26), 23736–23754 (2009). 10.1364/OE.17.023736 [DOI] [PubMed] [Google Scholar]
- 14.Mariampillai A., Leung M. K. K., Jarvi M., Standish B. A., Lee K., Wilson B. C., Vitkin A., Yang V. X. D., “Optimized speckle variance OCT imaging of microvasculature,” Opt. Lett. 35(8), 1257–1259 (2010). 10.1364/OL.35.001257 [DOI] [PubMed] [Google Scholar]
- 15.Srinivasan V. J., Jiang J. Y., Yaseen M. A., Radhakrishnan H., Wu W., Barry S., Cable A. E., Boas D. A., “Rapid volumetric angiography of cortical microvasculature with optical coherence tomography,” Opt. Lett. 35(1), 43–45 (2010). 10.1364/OL.35.000043 [DOI] [PMC free article] [PubMed] [Google Scholar]
- 16.Jonathan E., Enfield J., Leahy M. J., “Correlation mapping method for generating microcirculation morphology from optical coherence tomography (OCT) intensity images,” J. Biophotonics 4(9), 583–587 (2011). [DOI] [PubMed] [Google Scholar]
- 17.Blatter C., Klein T., Grajciar B., Schmoll T., Wieser W., Andre R., Huber R., Leitgeb R. A., “Ultrahigh-speed non-invasive widefield angiography,” J. Biomed. Opt. 17(7), 0705051 (2012). 10.1117/1.JBO.17.7.070505 [DOI] [PubMed] [Google Scholar]
- 18.Braaf B., Vermeer K. A., Vienola K. V., de Boer J. F., “Angiography of the retina and the choroid with phase-resolved OCT using interval-optimized backstitched B-scans,” Opt. Express 20(18), 20516–20534 (2012). 10.1364/OE.20.020516 [DOI] [PubMed] [Google Scholar]
- 19.Jaillon F., Makita S., Yasuno Y., “Variable velocity range imaging of the choroid with dual-beam optical coherence angiography,” Opt. Express 20(1), 385–396 (2012). 10.1364/OE.20.000385 [DOI] [PubMed] [Google Scholar]
- 20.Jia Y., Tan O., Tokayer J., Potsaid B., Wang Y., Liu J. J., Kraus M. F., Subhash H., Fujimoto J. G., Hornegger J., Huang D., “Split-spectrum amplitude-decorrelation angiography with optical coherence tomography,” Opt. Express 20(4), 4710–4725 (2012). 10.1364/OE.20.004710 [DOI] [PMC free article] [PubMed] [Google Scholar]
- 21.Kurokawa K., Sasaki K., Makita S., Hong Y.-J., Yasuno Y., “Three-dimensional retinal and choroidal capillary imaging by power Doppler optical coherence angiography with adaptive optics,” Opt. Express 20(20), 22796–22812 (2012). 10.1364/OE.20.022796 [DOI] [PubMed] [Google Scholar]
- 22.Schwartz D. M., Fingler J., Kim D. Y., Zawadzki R. J., Morse L. S., Park S. S., Fraser S. E., Werner J. S., “Phase-variance optical coherence tomography: a technique for noninvasive angiography,” Ophthalmology 121(1), 180–187 (2014). 10.1016/j.ophtha.2013.09.002 [DOI] [PMC free article] [PubMed] [Google Scholar]
- 23.Uribe-Patarroyo N., Villiger M., Bouma B. E., “Quantitative technique for robust and noise-tolerant speed measurements based on speckle decorrelation in optical coherence tomography,” Opt. Express 22(20), 24411–24429 (2014). 10.1364/OE.22.024411 [DOI] [PMC free article] [PubMed] [Google Scholar]
- 24.Xu J., Wong K., Jian Y., Sarunic M. V., “Real-time acquisition and display of flow contrast using speckle variance optical coherence tomography in a graphics processing unit,” J. Biomed. Opt. 19(2), 026001 (2014). 10.1117/1.JBO.19.2.026001 [DOI] [PubMed] [Google Scholar]
- 25.Lozzi A., Agrawal A., Boretsky A., Welle C. G., Hammer D. X., “Image quality metrics for optical coherence angiography,” Biomed. Opt. Express 6(7), 2435–2447 (2015). 10.1364/BOE.6.002435 [DOI] [PMC free article] [PubMed] [Google Scholar]
- 26.Ruminski D., Sikorski B. L., Bukowska D., Szkulmowski M., Krawiec K., Malukiewicz G., Bieganowski L., Wojtkowski M., “OCT angiography by absolute intensity difference applied to normal and diseased human retinas,” Biomed. Opt. Express 6(8), 2738–2754 (2015). 10.1364/BOE.6.002738 [DOI] [PMC free article] [PubMed] [Google Scholar]
- 27.Makita S., Kurokawa K., Hong Y.-J., Miura M., Yasuno Y., “Noise-immune complex correlation for optical coherence angiography based on standard and Jones matrix optical coherence tomography,” Biomed. Opt. Express 7(4), 1525–1548 (2016). 10.1364/BOE.7.001525 [DOI] [PMC free article] [PubMed] [Google Scholar]
- 28.Ploner S. B., Moult E. M., Choi W., Waheed N. K., Lee B., Novais E. A., Cole E. D., Potsaid B., Husvogt L., Schottenhamml J., Maier A., Rosenfeld P. J., Duker J. S., Hornegger J., Fujimoto J. G., “Toward quantitative OCT angiography: visualizing blood flow speeds in ocular pathology using variable interscan time analysis (VISTA),” Retina 36(Suppl 1), S118–S126 (2016). 10.1097/IAE.0000000000001328 [DOI] [PMC free article] [PubMed] [Google Scholar]
- 29.Hendargo H. C., Estrada R., Chiu S. J., Tomasi C., Farsiu S., Izatt J. A., “Automated non-rigid registration and mosaicing for robust imaging of distinct retinal capillary beds using speckle variance optical coherence tomography,” Biomed. Opt. Express 4(6), 803–821 (2013). 10.1364/BOE.4.000803 [DOI] [PMC free article] [PubMed] [Google Scholar]
- 30.Kraus M. F., Liu J. J., Schottenhamml J., Chen C.-L., Budai A., Branchini L., Ko T., Ishikawa H., Wollstein G., Schuman J., Duker J. S., Fujimoto J. G., Hornegger J., “Quantitative 3D-OCT motion correction with tilt and illumination correction, robust similarity measure and regularization,” Biomed. Opt. Express 5(8), 2591–2613 (2014). 10.1364/BOE.5.002591 [DOI] [PMC free article] [PubMed] [Google Scholar]
- 31.Gorczynska I., Migacz J. V., Zawadzki R. J., Capps A. G., Werner J. S., “Comparison of amplitude-decorrelation, speckle-variance and phase-variance OCT angiography methods for imaging the human retina and choroid,” Biomed. Opt. Express 7(3), 911–942 (2016). 10.1364/BOE.7.000911 [DOI] [PMC free article] [PubMed] [Google Scholar]
- 32.Zang P., Liu G., Zhang M., Dongye C., Wang J., Pechauer A. D., Hwang T. S., Wilson D. J., Huang D., Li D., Jia Y., “Automated motion correction using parallel-strip registration for wide-field en face OCT angiogram,” Biomed. Opt. Express 7(7), 2823–2836 (2016). 10.1364/BOE.7.002823 [DOI] [PMC free article] [PubMed] [Google Scholar]
- 33.Li P., Cheng Y., Li P., Zhou L., Ding Z., Ni Y., Pan C., “Hybrid averaging offers high-flow contrast by cost apportionment among imaging time, axial, and lateral resolution in optical coherence tomography angiography,” Opt. Lett. 41(17), 3944–3947 (2016). 10.1364/OL.41.003944 [DOI] [PubMed] [Google Scholar]
- 34.Li P., Cheng Y., Zhou L., Pan C., Ding Z., Li P., “Single-shot angular compounded optical coherence tomography angiography by splitting full-space B-scan modulation spectrum for flow contrast enhancement,” Opt. Lett. 41(5), 1058–1061 (2016). 10.1364/OL.41.001058 [DOI] [PubMed] [Google Scholar]
- 35.Heisler M., Lee S., Mammo Z., Jian Y., Ju M., Merkur A., Navajas E., Balaratnasingam C., Beg M. F., Sarunic M. V., “Strip-based registration of serially acquired optical coherence tomography angiography,” J. Biomed. Opt. 22(3), 036007 (2017). 10.1117/1.JBO.22.3.036007 [DOI] [PubMed] [Google Scholar]
- 36.Chu Z., Lin J., Gao C., Xin C., Zhang Q., Chen C.-L., Roisman L., Gregori G., Rosenfeld P. J., Wang R. K., “Quantitative assessment of the retinal microvasculature using optical coherence tomography angiography,” J. Biomed. Opt. 21(6), 66008 (2016). 10.1117/1.JBO.21.6.066008 [DOI] [PMC free article] [PubMed] [Google Scholar]
- 37.Kurokawa K., Liu Z., Miller D. T., “Adaptive optics optical coherence tomography angiography for morphometric analysis of choriocapillaris [Invited],” Biomed. Opt. Express 8(3), 1803–1822 (2017). 10.1364/BOE.8.001803 [DOI] [PMC free article] [PubMed] [Google Scholar]
- 38.Li P., Huang Z., Yang S., Liu X., Ren Q., Li P., “Adaptive classifier allows enhanced flow contrast in OCT angiography using a histogram-based motion threshold and 3D Hessian analysis-based shape filtering,” Opt. Lett. 42(23), 4816–4819 (2017). 10.1364/OL.42.004816 [DOI] [PubMed] [Google Scholar]
- 39.Du Y. P., Parker D. L., Davis W. L., “Vessel enhancement filtering in three-dimensional MR angiography,” J. Magn. Reson. Imaging 5(3), 353–359 (1995). 10.1002/jmri.1880050321 [DOI] [PubMed] [Google Scholar]
- 40.Orkisz M. M., Bresson C., Magnin I. E., Champin O., Douek P. C., “Improved vessel visualization in MR angiography by nonlinear anisotropic filtering,” Magn. Reson. Med. 37(6), 914–919 (1997). 10.1002/mrm.1910370617 [DOI] [PubMed] [Google Scholar]
- 41.Frangi A. F., Niessen W. J., Vincken K. L., Viergever M. A., “Medical Image Computing and Computer-Assisted Intervention — MICCAI’98,” inMedical Image Computing and Computer-Assisted Intervention, Wells W. M., Colchester A., Delp S., eds. (Springer Berlin Heidelberg, Berlin, Heidelberg, 1998), pp. 130–137. [Google Scholar]
- 42.Sato Y., Nakajima S., Shiraga N., Atsumi H., Yoshida S., Koller T., Gerig G., Kikinis R., “Three-dimensional multi-scale line filter for segmentation and visualization of curvilinear structures in medical images,” Med. Image Anal. 2(2), 143–168 (1998). 10.1016/S1361-8415(98)80009-1 [DOI] [PubMed] [Google Scholar]
- 43.Garnica C., Boochs F., Twardochlib M., “A new approach to edge-preserving smoothing for edge extraction and image segmentation,” International Archives of Photogrammetry and Remote Sensing 33(B3/1; PART 3), 320–325 (2000). [Google Scholar]
- 44.Optopol. Technology, “Revo NX,” http://optopol.com/products/revo-nx.


