Abstract
The lens equivalent refractive index (RI) is commonly used in calculations of crystalline lens power. However, accurate determination of the equivalent RI in vivo is challenging due to the need of multiple measurements with different ocular biometry devices. A custom extended-depth Spectral Domain-OCT system was utilized to provide measurements of corneal and lens surface curvatures and all intraocular distances required for determination of the lens equivalent RI. Ocular biometry and refraction were input into a computational model eye from which the equivalent RI was calculated. Results derived from human subjects of a wide age range show a decrease in RI with age and demonstrate the capability of in vivo measurements of the equivalent RI with extended-depth OCT.
1. Introduction
The eye undergoes continuous growth from birth to adulthood yet refraction remains relatively stable [1]. Since refraction is governed by the optics and geometry of the cornea, lens, and eye length, changes in the cornea and lens must compensate for those resulting from a change in the eye length. Considering the cornea stabilizes 2-3 years after birth [2], refractive changes due to the axial eye growth should be balanced mainly by changes in the lens. Interest in the contribution of the lens to refractive development has led to in vitro [3–5] and in vivo [6–11] experiments to measure human crystalline lens power and its age-dependence.
One method to estimate crystalline lens power uses thick lens formulae, which require the thickness, shape, and the refractive index of a lens. The thickness and shape of the crystalline lens may be measured in vivo or in vitro, but an artificial value for the refractive index must be used in the calculation since the lens has a gradient refractive index. The power is generally calculated using a lens equivalent refractive index, representing the homogeneous refractive index of a hypothetical lens with the same shape as the actual crystalline lens and power equivalent to the actual lens with its gradient refractive index. The equivalent refractive index can be inputted with lens thickness and shape into thick lens formulae to calculate lens power [9,10]. Consequently, accurate equivalent refractive indices are needed for accurate determination of lens power.
However, values for the lens equivalent refractive index vary significantly in the literature from 1.406 [12] to 1.444 [11] at age 20 and from 1.406 [12] to 1.426 [4] at age 80. Studies also disagree on whether the lens equivalent refractive index changes with age, either showing a decrease [3,9,11,13–16] or no change with age [4,12]. This uncertainty on the value and age-dependence of the equivalent refractive index causes a large uncertainty in lens power and its changes with age. A change of only 0.002 in the lens equivalent refractive index can lead to a 0.5 D shift in lens power (assuming the Dubbelman eye model for a 35 year old relaxed lens [14,17]).
There are challenges in acquiring accurate measurements of the equivalent index. For instance, precise measurements of the lens curvature are needed in both in vitro [3,4,12,15,16] and in vivo [9,11,13,14,17–26] experiments. Additionally, in in vitro experiments, extracted lenses can also undergo changes from their in vivo state, particularly swelling over time [27], which can affect the shape and thickness of the lens as well as its equivalent index. For in vivo studies, biometry of ocular surfaces is input into a computational model eye from which the equivalent refractive index is solved, so the difficulty lies in obtaining accurate values of these biometric parameters. Studies up to date have either estimated ocular distances and curvatures [18,24] or have combined data from multiple instruments and imaging techniques, including Scheimpflug [11,14,17,19], phakometry [9,13,20,22,23], and ultrasound biomicroscopy [9,11,13,22,23]. The inclusion of estimated ocular distances and curvatures in the computational eye model reduces the accuracy of the predicted equivalent refractive index, while the use of multiple instruments increases measurement uncertainty given differences in instrument precision and potential differences in patient alignment and centration between instruments.
In this paper, we demonstrate in vivo determination of the lens equivalent refractive index using a single biometry device combined with measurements of ocular refraction.We utilize a custom-built extended-depth Optical Coherence Tomography (OCT) system which provides in a single acquisition 2-D images extending from the cornea to the retina. From these images, intraocular distances and cornea and lens surface curvatures can be obtained.
2. Methods
2.1 Study design
The study was performed in accordance with the tenets of the Declaration of Helsinki at the University of Miami Miller School of Medicine after approval by the University Institutional Review Board. Consent was obtained for all participants. 55 eyes of 33 subjects (age: 42 ± 16 y/o, range 21 to 71 y/o) with no history of ocular disease were imaged. Spherical equivalent (SEQ) ranged from −9.38 to + 0.75 D with an average of −2.46 ± 2.15 D.
2.2 Extended-depth OCT imaging
A custom-built extended-depth OCT system previously described [28] with 8 μm axial resolution (in air), axial range of 10.5 mm (in air), and central wavelength of 840 nm was used in whole-eye imaging. The extended-depth system is combined with an accommodation module which can provide fixed or step monocular stimuli through the use of two Badal optometers located in separate channels but optically aligned to prevent convergence when switching between channels [28]. Stimuli in both channels consisted of a cross with spatial frequency 6.25 cycles per degree and size 5 x 5 mm. Luminance was approximately the same in the two channels: 4.70 candela/m2 in the channel set to proximity and 5.35 candela/m2 in the channel set to distance.
At the start of the imaging session, subjects were asked to position themselves in front of the OCT system on a chin rest while stabilized by a contour head frame. Subjects were instructed to blink freely between measurements. The stimulus was set to subjects’ far point by moving the stimulus in the accommodation module towards the subject until the stimulus was in focus. To ensure alignment of the OCT system along the optical axis of the eye, the angle of the beam delivery system was rotated while visualizing real-time images of subjects’ eyes until the iris plane was seen to be horizontal in the images. Subjects were asked to fixate on the stimulus and subsequently a sequence of ten 2-D extended-depth images were acquired while subjects were in a relaxed state. Images were acquired with 400 A-lines over 8 mm along the horizontal meridian at 12,500 A-lines/s, corresponding to 8.7 frames per second. Subjects were imaged without any corrective lenses, including glasses or contact lenses.
2.3 Determination of lens equivalent refractive index
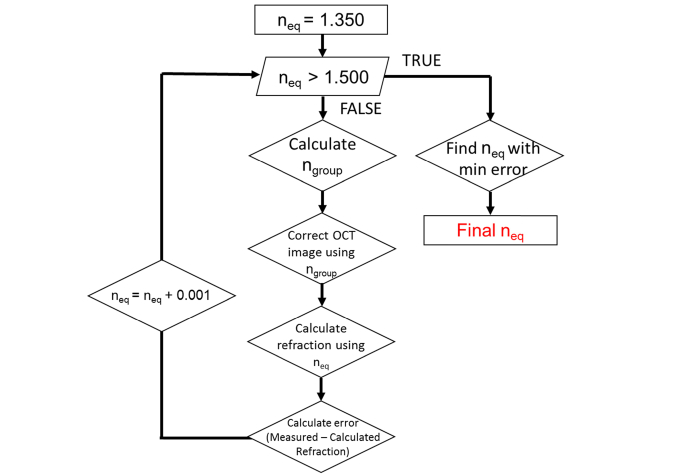
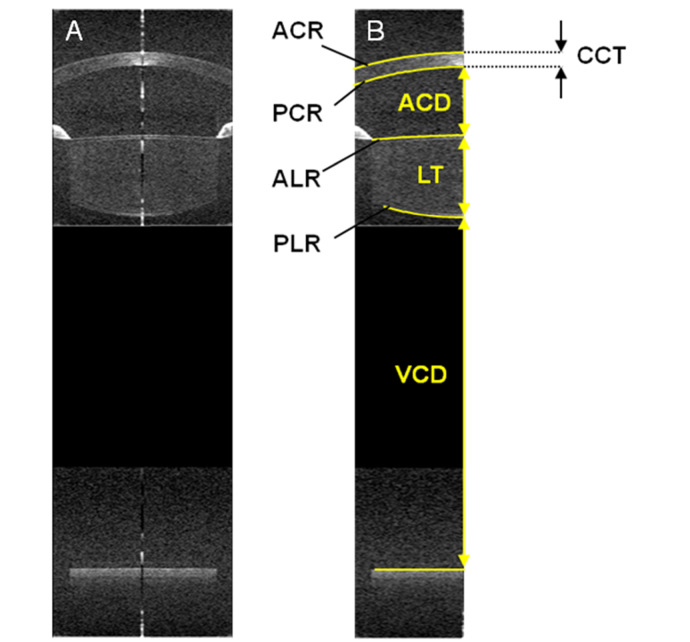
Subjects’ lens equivalent refractive indices were determined based on the algorithm reported in Fig. 1. Input parameters of the algorithm included optical distances measured along the A-line passing through the apex of the cornea and curvatures of the corneal and lens surfaces extracted from the uncorrected OCT images. Curvatures were obtained by performing a conic fit over the central 5 mm of the surfaces segmented using an automated segmentation algorithm [29] (Fig. 2). In subjects with pupil diameters smaller than 5 mm, lens surfaces were fit over the remaining visible central portion of the lens.
Fig. 1.
Flowchart showing procedure to calculate lens equivalent refractive index. For distortion correction, we used the group refractive indices (1.387 for the cornea and 1.341 for the aqueous and vitreous humor). For calculation of refractive state, we used the phase indices (1.376 for the cornea and 1.336 for the aqueous and vitreous humor).
Fig. 2.
(A) Example extended-depth OCT image acquired on a 23 y/o subject. (B) Computational eye model obtained from the OCT image. Anterior corneal, posterior corneal, anterior lens, posterior lens, and retinal surfaces segmented from extended-depth images are reported. The location and shape of the surfaces were defined by the radii of curvature of the anterior cornea (ACR), posterior cornea (PCR), anterior lens (ALR), and posterior lens (PLR) as well as intraocular distances, such as central corneal thickness (CCT), anterior chamber depth (ACD), lens thickness (LT), and vitreous chamber depth (VCD). VCD is measured from the posterior lens surface to the retinal pigment epithelium.
Equivalent refractive index values were tested in steps of 0.001 over the range from 1.350 to 1.500, which was selected to exceed the range spanned by values reported in literature [3,4,9,11–26]. The group refractive index of the lens was calculated from the equivalent index using the same approach as in Uhlhorn et al [30], since the group index was required to correct for OCT image distortions. We used lens dispersion data from Atchison and Smith [31] and scaled for wavelength by assuming a constant ratio between the group refractive and equivalent indices. The sodium D-line at 589 nm was used as a reference for the equivalent refractive index. The group refractive index was calculated at 840 nm, the center wavelength of the OCT light source.
Intraocular distances between boundaries were corrected for optical path length by dividing the optical distances measured along the A-line passing through the apex of the cornea with the group refractive indices of the corresponding ocular media at 840 nm (nCORNEA = 1.387 [30], nAQUEOUS = 1.341 [31], nLENS = calculated value from first step of the algorithm, and nVITREOUS = 1.341 [31]). Radii of curvature for the anterior and posterior lens and corneal surfaces were corrected for distortion due to refraction of the OCT beam at the ocular surfaces and through the ocular media.
These calculations generated a model for the subject’s eye from which the spherical equivalent refractive state was estimated by performing backwards paraxial ray trace. The refractive indices of the ocular media at the sodium D-line (1.376 for the cornea, 1.336 for the aqueous and vitreous humor, and the current equivalent refractive index value for the lens) were used for this backward ray-trace. Finally, the error between the estimated and measured spherical equivalent refraction was calculated. After stepping through all equivalent refractive index values, the value producing the minimum error between subjects’ measured and estimated refraction was selected.
This procedure was repeated for each of the 10 extended-depth images taken for a single subject eye along the horizontal meridian. The lens equivalent refractive indices were averaged after automatic removal of extreme outliers among the indices derived from the 10 images. Outliers primarily occurred when there were large changes in corneal or lens curvature between frames due to a drop in image quality, preventing accurate segmentation and subsequent quantification of curvature. To remove outliers, images with curvature measurements lying outside of ± 0.5, 0.5, 2, and 2 mm from the mean for the anterior corneal, posterior corneal, anterior lens, and posterior lens curvature measurements, respectively, were first discarded to remove extreme values. The standard deviation and mean of the curvatures from the remaining images were calculated, and images with curvature measurements lying outside two standard deviations from this mean value were additionally removed. Thus, this removal process eliminated refractive index values produced by errors in measurement rather than variability due to measurement precision. No more than four out of the ten recorded images were removed for any single subject eye, and only a mean difference of −0.0001 ± 0.0035 (95% CI) was found in the lens equivalent refractive index before and after outlier removal. Finally, in cases where equivalent refractive indices were measured for both eyes in a single subject, index values were averaged.
3. Results
3.1 Inter- and Intra-session repeatability of biometry
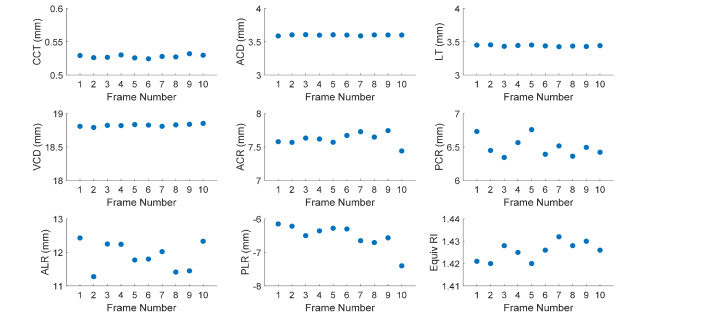
Example biometry and estimated equivalent refractive indices over ten extended-depth images for a sample subject are shown in Fig. 3. Intra-session repeatability of biometry was defined as the standard deviation of measurements over the ten frames. Mean and range of intra-session repeatability over all subjects are shown in Table 1. Measurements were stable with repeatability below 30 µm for all biometry measurements and below 0.75 mm for all curvature measurements. Inter-session repeatability was determined from repeated measurements performed on a single subject eye over 5 different days. The standard deviation of measurements over the 5 days is shown in Table 2. Again, measurements were stable with repeatability below 30 µm for all biometry measurements and below 0.5 mm for all curvature measurements.
Fig. 3.
Example of biometry used to define a model eye for calculation of equivalent refractive indices in a 22 y/o subject. Calculation of equivalent refractive indices was repeated over ten extended-depth images resulting in ten values, which were averaged together to determine a final value. Abbreviations- CCT: Central Corneal Thickness, ACD: Anterior Chamber Depth, LT: Lens Thickness, VCD: Vitreous Chamber Depth, ACR: Anterior Corneal Radius of Curvature, PCR: Posterior Corneal Radius of Curvature, ALR: Anterior Lens Radius of Curvature, PLR: Posterior Lens Radius of Curvature
Table 1. Intra-Session Repeatability of Biometry (33 subjects, 10 frames each).
| Biometry [mean, range] (µm) | Radius of Curvature [mean, range] (mm) | ||
|---|---|---|---|
| CCT | 4, 1-18 | ACR | 0.104, 0.040-0.257 |
| ACD | 13, 5- 27 | PCR | 0.110, 0.033-0.240 |
| LT | 19, 8-41 | ALR | 0.657, 0.233-1.220 |
| VCD | 13, 5-40 | PLR | 0.399, 0.067-1.173 |
Intra-session variability is the standard deviation of measurements over the ten frames averaged over all subjects.
Table 2. Inter-Session Repeatability of Biometry (1 subject, 5 visits).
| Biometry [mean] (µm) | Radius of Curvature [mean] (mm) | ||
|---|---|---|---|
| CCT | 2 | ACR | 0.167 |
| ACD | 12 | PCR | 0.051 |
| LT | 24 | ALR | 0.473 |
| VCD | 5 | PLR | 0.167 |
Inter-session variability is the standard deviation of measurements over five visits for a single subject eye.
3.2 Age dependence of biometry of the anterior segment
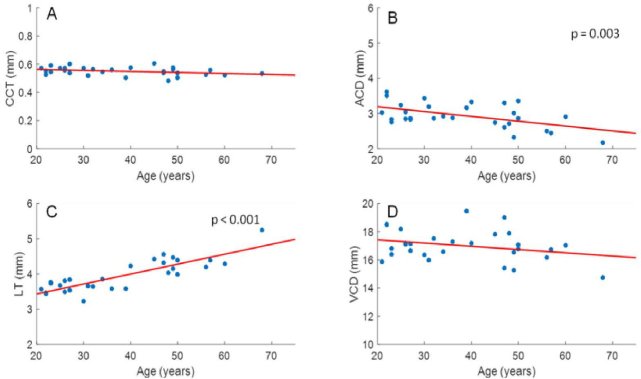
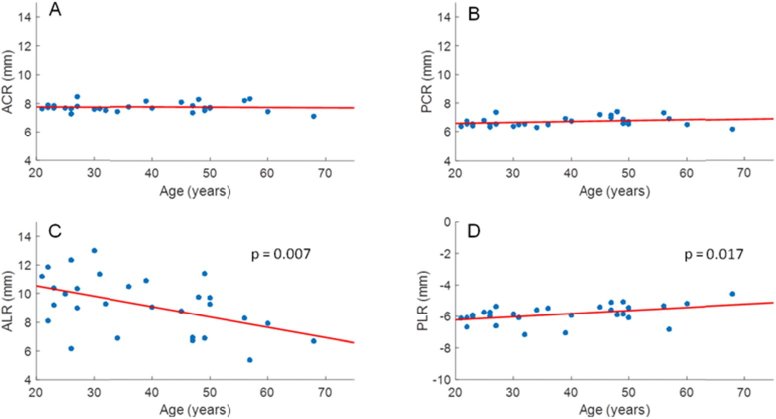
Subject biometry, power, and refractive index results are detailed in Data File 1 (3.8KB, csv) . Data for 7 eyes from 7 subjects were removed due to low image quality or small pupil size which prevented reliable quantification of lens curvature. As expected, lens thickness increased (LT = 0.029 mm/yr * Age + 2.867 mm; p < 0.001) and anterior chamber depth (ACD = −0.014 mm/yr *Age + 3.467 mm; p = 0.003) decreased significantly with age, whereas vitreous chamber depth (p = 0.134) and central corneal thickness (p = 0.065) were constant (Fig. 4). As shown in Fig. 5, anterior and posterior corneal radii of curvatures did not change with age (p = 0.691, and 0.174, respectively), whereas the radii of curvatures of the anterior and posterior lens decreased in magnitude with age (ALR = −0.072 mm/yr * Age + 11.965 mm, p = 0.007; PLR = 0.020 mm/yr * Age - 6.615 mm, p = 0.017).
Fig. 4.
CCT (A), ACD (B), LT (C), and VCD (D) were plotted versus age for all subjects. LT (LT = 0.029 mm/yr * Age + 2.867 mm; p < 0.001) and ACD (ACD = −0.014 mm/yr *Age + 3.4667 mm ; p = 0.003) showed a significant increase and decrease, respectively, with age, whereas VCD (p = 0.134) and CCT (p = 0.065) did not show a relation with age.
Fig. 5.
ACR (A), PCR (B), ALR (C), and PLR (D) were plotted versus age for all subjects. ALR and PLR showed a significant decrease in magnitude with age (ALR = −0.072 mm/yr * Age + 11.965 mm, p = 0.007; PLR = 0.020 mm/yr * Age - 6.615 mm; p = 0.017), whereas ACR (p = 0.691) and PCR (p = 0.174) did not show a relation with age.
3.3 Calculation of lens equivalent refractive index
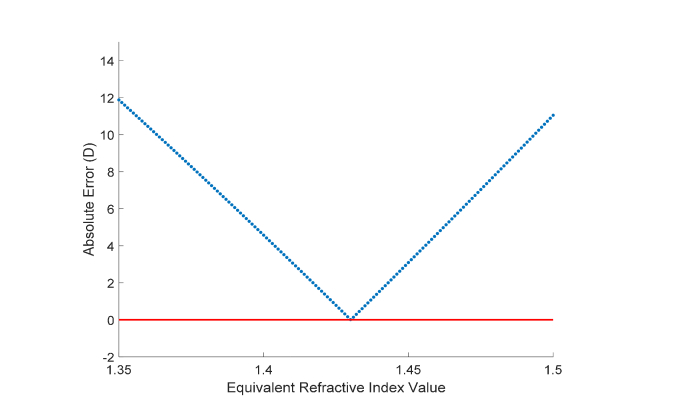
Example of calculation of the lens equivalent refractive index from a single subject eye are shown in Fig. 6. Error between estimated and measured refractions varied in a largely linear fashion in the range of refractive indices from 1.350 to 1.500 which were used. Variability of the lens equivalent refractive indices calculated across the ten images was minimal with an average standard deviation across subjects of 0.009.
Fig. 6.
Absolute value of error between estimated and measured refraction as a function of equivalent refractive indices. As detailed in the methods, the optimal equivalent refractive index value was determined to be the value that produces the minimum absolute error. Results shown are based on the biometry values for the left eye of a 31 y/o subject, where a lens equivalent refractive index of 1.430 was determined for the subject.
3.4 Age dependence of the lens equivalent refractive index
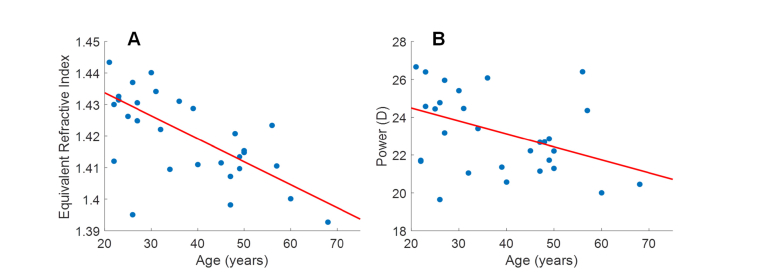
As shown in Fig. 7(A), the lens equivalent refractive index decreased significantly with age (neq = −0.0007 yr−1 * Age + 1.4483; p < 0.001). The 95% Confidence Interval for the slope was −0.0010 to −0.0005 yr−1. Refractive indices were then used to calculate lens power using the thick lens formula, revealing a decreasing relationship in lens power with age (Lens power = −0.07 D/yr * Age + 25.86 D; p = 0.017).
Fig. 7.
Plots of lens equivalent refractive index (A) and lens power (B) as a function of age. The lens equivalent refractive index was found to decrease with age (Equiv RI = −0.0007 yr−1 * Age + 1.4483; p <0.001; 95% CI of slope: −0.0010 to −0.0005 yr−1). Lens power was also found to decrease with age (Lens power = −0.07 D/yr * Age + 25.86 D; p = 0.017). An outlier (26 y/o with 1.395 equivalent refractive index and 19.64 D power) was removed before linear fitting and significance testing in both refractive index and power plots.
4. Discussion
In vivo measurement of the lens equivalent refractive index was demonstrated using 2-D extended-depth images from a custom extended-depth OCT. The OCT system provides 2-D extended-depth images, allowing verification of proper alignment of the system and acquisition of ocular distances and surface curvatures within a single session and single device. Based on calculations derived from these measurements, the lens equivalent refractive index was found to decrease significantly with age.
This decrease in lens equivalent refractive index with age is largely consistent with literature. With the exception of Glasser et al [4] and Birkenfeld et al [12], studies all show a decrease of the equivalent refractive index with age [3,9,11,13–16]. The magnitude of decrease was determined to be 0.007 yr−1, similar to the value found by Richdale et al [13] but greater than values found in most prior studies [3,9,11,13–16]. Holding lens thickness and curvatures constant with age, this rate of change in the equivalent refractive index would bring about a decrease in lens power of 0.19 D/yr. In turn, changes in lens power caused by changes in the lens gradient refractive index would be largely counteracted by changes in lens shape. Given the age-related changes in lens thickness, curvature, and equivalent refractive index seen in the present study, a decrease in lens power of 0.07 D per year was determined similar to the 0.081 D per year predicted by Irribaren [1].
Certainly, variability in biometry contributes to uncertainty in refractive index calculations. Ocular measurements, especially curvature, are highly dependent on accurate segmentation of ocular boundaries which can be influenced by small pupil sizes and lack of contrast in the periphery of OCT images. However, as shown in Tables 1 and 2, variability in distance measurements is at most ~30 µm (corresponding to lens thickness), whereas variability is greater for curvature measurements with at most ~0.2 mm for the anterior and posterior corneal surfaces and ~0.75 mm for the anterior and posterior lens surfaces. In the case of the anterior and posterior lens curvatures, variability may be due to physiological fluctuations in lens response at relaxation or lack of segmentation points to calculate curvature due to an obstructed view of the lens in eyes with a narrow pupil. However, even using the variability from Tables 1 and 2, error in refractive index estimates would only reach < 0.001 for thickness measurements, 0.001 for anterior and posterior corneal radii of curvatures, and ~0.008 for anterior and posterior lens radii of curvatures. The robustness of these results suggests that high resolution of optical techniques may be needed to determine optical properties of the lens with a precision better than two decimals.
It should be noted that this approach to determine the equivalent refractive index of the lens has several limitations. The estimation of subjects' refractive errors relies on paraxial formulas, which assume the absence of higher order aberrations. Also, the approach performs distortion correction of the posterior lens surface assuming a homogenous lens with an equivalent refractive index. Distortion correction proceeds by back-solving from the path of rays in the image plane as given by Snell's Law. Since the lens in actuality has a gradient refractive index, distortion correction based on a homogenous media may not recover the true path of rays through the media. Although differences in ray path may lead to inaccuracies in correction, error analyses on ex vivo lenses have shown no significant difference in the radius of curvature in the central paraxial optical zone whether the uniform refractive index or a gradient refractive index is used for correction [32]. Similarly, the approach assumes lens dispersion remains constant with age. The lens dispersion curve is used when converting the lens group refractive index to equivalent refractive index and scaling the equivalent refractive index from 840 to 580 nm. Since the dispersion of most ocular media is dominated by the dispersion of water [33], structural changes in the lens could potentially result in changes to lens dispersion. However, significant changes are not likely given that the water content of the lens changes less than 5% over adulthood [34]. Any age-related difference in lens dispersion would further be mitigated by the small thickness of the lens (typically ~3-4 mm in adults) in comparison to the distances of other ocular media. Finally, the approach assumes constant refractive indices for the cornea, aqueous humor, and vitreous humor across age and individuals. While age-related and inter-individual differences in the refractive indices of ocular media besides the lens are not well understood, these changes are likely small. Even if refractive indices for the cornea, aqueous humor, or vitreous humor were to differ by 0.010, errors in calculated equivalent indices would only come out to 0.001, 0.006, and 0.009, respectively.
Interestingly, the approach also demonstrated that estimated refraction changes linearly with different lens equivalent refractive index values when probing values close to physiological relevance (Fig. 5). Such an observation is not readily apparent given the nonlinearity of operations associated with paraxial raytracing in model eyes, including performing distortion correction of ocular surfaces. Indeed, over a broader range of refractive index values, the relationship between refractive index and estimated refraction is nonlinear, but for practical purposes, where determination of the human lens equivalent refractive index is concerned, calculating the optimal refractive index only requires interpolation after estimating refraction for a pair of proposed refractive index values. In this paper, considering the low computational cost of repeated calculations and lack of a priori knowledge of the relationship between lens equivalent refractive index values and estimated refraction, we continued using an approach where the optimal lens equivalent refractive index was determined after trying all values within 1.350 and 1.500 in 0.001 increments.
Other limitations in the present study include the use of 2-D cross-sectional images for biometry. The image plane was carefully aligned to ensure acquisition at the horizontal plane bisecting the corneal apex for accurate representation of the dimensions of the eye. Slight deviations from the plane containing the apex would result in minimal changes in measurements as previous error analyses have shown [35]. Indeed, measurements derived from the 2-D images demonstrated good reliability as evidenced by the low intra- and inter-session variabilities shown in Tables 1 and 2. The use of 2-D images from a horizontal plane may also result in curvature measurements determined from a different axis than that at which objective refraction was acquired. Refraction of subjects may differ on the horizontal plane, or likewise, curvature may differ along the axis at which refraction was obtained. These differences would be especially pronounced in astigmatic subjects, which would introduce errors in the backwards ray trace and subsequently errors in equivalent index calculation. However, differences due to measurements along different axes are not expected to be significant on a subject population with low astigmatism and no history of ocular disease.
Finally, subjects were imaged without cycloplegia and were assumed to be in an unaccommodated state during imaging. In cases of residual accommodation, higher measured values in the magnitude of lens surface curvatures would be obtained, leading to lower values of the lens equivalent refractive index. Residual accommodation may explain the somewhat low equivalent refractive indices found in a few of the younger subjects, particularly the 26 year old with an index of 1.395 (and coincidentally a low anterior lens radius of 6.144 mm not unlike in an accommodated lens). Such a bias would cause a smaller decrease in the lens equivalent refractive index with age assuming residual accommodation would be more prevalent in younger rather than older subjects closer to presbyopia. Ideally, refraction should be acquired during OCT imaging to confirm the refractive state of subjects.
In this study, the lens equivalent refractive index was successfully determined from extended-depth images obtained through in vivo imaging with a custom extended-depth OCT system. A decrease in lens equivalent refractive index with age was found confirming past literature. In comparison with other in vivo techniques, use of extended-depth OCT significantly facilitates measurement of the lens properties by providing all biometric measurements required to calculate lens shape and its equivalent refractive index from one image with a single device.
Funding
National Eye Institute Grants 1F30EY027162, 1R01EY021834, P30EY14801 (Center Grant); the Florida Lions Eye Bank and the Beauty of Sight Foundation; the Henri and Flore Lesieur Foundation (JMP); Drs. Raksha Urs and Aaron Furtado; Karl R. Olsen, MD and Martha E. Hildebrandt, PhD; an unrestricted grant from Research to Prevent Blindness; and the Australian Federal Government Cooperative Research Centre Scheme through the Vision Cooperative Research Centre.
Disclosures
The University of Miami and authors MR, FM, and JMP stand to benefit from intellectual property in the OCT technology used in this study.
References
- 1.Iribarren R., “Crystalline lens and refractive development,” Prog. Retin. Eye Res. 47, 86–106 (2015). 10.1016/j.preteyeres.2015.02.002 [DOI] [PubMed] [Google Scholar]
- 2.Inagaki Y., “The rapid change of corneal curvature in the neonatal period and infancy,” Arch. Ophthalmol. 104(7), 1026–1027 (1986). 10.1001/archopht.1986.01050190084044 [DOI] [PubMed] [Google Scholar]
- 3.Borja D., Manns F., Ho A., Ziebarth N., Rosen A. M., Jain R., Amelinckx A., Arrieta E., Augusteyn R. C., Parel J. M., “Optical power of the isolated human crystalline lens,” Invest. Ophthalmol. Vis. Sci. 49(6), 2541–2548 (2008). 10.1167/iovs.07-1385 [DOI] [PMC free article] [PubMed] [Google Scholar]
- 4.Glasser A., Campbell M. C., “Biometric, optical and physical changes in the isolated human crystalline lens with age in relation to presbyopia,” Vision Res. 39(11), 1991–2015 (1999). 10.1016/S0042-6989(98)00283-1 [DOI] [PubMed] [Google Scholar]
- 5.Moffat B. A., Atchison D. A., Pope J. M., “Age-related changes in refractive index distribution and power of the human lens as measured by magnetic resonance micro-imaging in vitro,” Vision Res. 42(13), 1683–1693 (2002). 10.1016/S0042-6989(02)00078-0 [DOI] [PubMed] [Google Scholar]
- 6.Hernandez V. M., Cabot F., Ruggeri M., de Freitas C., Ho A., Yoo S., Parel J. M., Manns F., “Calculation of crystalline lens power using a modification of the Bennett method,” Biomed. Opt. Express 6(11), 4501–4515 (2015). 10.1364/BOE.6.004501 [DOI] [PMC free article] [PubMed] [Google Scholar]
- 7.Iribarren R., Morgan I. G., Hashemi H., Khabazkhoob M., Emamian M. H., Shariati M., Fotouhi A., “Lens power in a population-based cross-sectional sample of adults aged 40 to 64 years in the Shahroud Eye Study,” Invest. Ophthalmol. Vis. Sci. 55(2), 1031–1039 (2014). 10.1167/iovs.13-13575 [DOI] [PubMed] [Google Scholar]
- 8.Jongenelen S., Rozema J. J., Tassignon M. J., EVICR.net and Project Gullstrand Study Group , “Distribution of the Crystalline Lens Power In Vivo as a Function of Age,” Invest. Ophthalmol. Vis. Sci. 56(12), 7029–7035 (2015). 10.1167/iovs.15-18047 [DOI] [PubMed] [Google Scholar]
- 9.Garner L. F., Ooi C. S., Smith G., “Refractive index of the crystalline lens in young and aged eyes,” Clin. Exp. Optom. 81(4), 145–150 (1998). 10.1111/j.1444-0938.1998.tb06772.x [DOI] [PubMed] [Google Scholar]
- 10.Mutti D. O., Zadnik K., Adams A. J., “A video technique for phakometry of the human crystalline lens,” Invest. Ophthalmol. Vis. Sci. 33(5), 1771–1782 (1992). [PubMed] [Google Scholar]
- 11.Atchison D. A., Markwell E. L., Kasthurirangan S., Pope J. M., Smith G., Swann P. G., “Age-related changes in optical and biometric characteristics of emmetropic eyes,” J. Vis. 8(4), 29 (2008). 10.1167/8.4.29 [DOI] [PubMed] [Google Scholar]
- 12.Birkenfeld J., de Castro A., Marcos S., “Contribution of shape and gradient refractive index to the spherical aberration of isolated human lenses,” Invest. Ophthalmol. Vis. Sci. 55(4), 2599–2607 (2014). 10.1167/iovs.14-14201 [DOI] [PubMed] [Google Scholar]
- 13.Richdale K., Sinnott L. T., Bullimore M. A., Wassenaar P. A., Schmalbrock P., Kao C. Y., Patz S., Mutti D. O., Glasser A., Zadnik K., “Quantification of age-related and per diopter accommodative changes of the lens and ciliary muscle in the emmetropic human eye,” Invest. Ophthalmol. Vis. Sci. 54(2), 1095–1105 (2013). 10.1167/iovs.12-10619 [DOI] [PMC free article] [PubMed] [Google Scholar]
- 14.Dubbelman M., Van der Heijde G. L., “The shape of the aging human lens: curvature, equivalent refractive index and the lens paradox,” Vision Res. 41(14), 1867–1877 (2001). 10.1016/S0042-6989(01)00057-8 [DOI] [PubMed] [Google Scholar]
- 15.Navarro R., Palos F., González L. M., “Adaptive model of the gradient index of the human lens. II. Optics of the accommodating aging lens,” J. Opt. Soc. Am. A 24(9), 2911–2920 (2007). 10.1364/JOSAA.24.002911 [DOI] [PubMed] [Google Scholar]
- 16.Charman W. N., Atchison D. A., “Age-dependence of the average and equivalent refractive indices of the crystalline lens,” Biomed. Opt. Express 5(1), 31–39 (2013). 10.1364/BOE.5.000031 [DOI] [PMC free article] [PubMed] [Google Scholar]
- 17.Dubbelman M., van der Heijde G. L., Weeber H. A., “The thickness of the aging human lens obtained from corrected Scheimpflug images,” Optom. Vis. Sci. 78(6), 411–416 (2001). 10.1097/00006324-200106000-00013 [DOI] [PubMed] [Google Scholar]
- 18.Dick G. L., “Optical method for estimating the equivalent refractive index of the crystalline lens in vivo,” Ophthalmic Physiol. Opt. 14(2), 177–183 (1994). 10.1111/j.1475-1313.1994.tb00106.x [DOI] [PubMed] [Google Scholar]
- 19.Dubbelman M., Van der Heijde G. L., Weeber H. A., “Change in shape of the aging human crystalline lens with accommodation,” Vision Res. 45(1), 117–132 (2005). 10.1016/j.visres.2004.07.032 [DOI] [PubMed] [Google Scholar]
- 20.Garner L. F., Smith G., “Changes in equivalent and gradient refractive index of the crystalline lens with accommodation,” Optom. Vis. Sci. 74(2), 114–119 (1997). 10.1097/00006324-199702000-00024 [DOI] [PubMed] [Google Scholar]
- 21.Hermans E. A., Dubbelman M., Van der Heijde R., Heethaar R. M., “Equivalent refractive index of the human lens upon accommodative response,” Optom. Vis. Sci. 85(12), 1179–1184 (2008). 10.1097/OPX.0b013e31818e8d57 [DOI] [PubMed] [Google Scholar]
- 22.Mutti D. O., Zadnik K., Adams A. J., “The equivalent refractive index of the crystalline lens in childhood,” Vision Res. 35(11), 1565–1573 (1995). 10.1016/0042-6989(94)00262-K [DOI] [PubMed] [Google Scholar]
- 23.Mutti D. O., Zadnik K., Fusaro R. E., Friedman N. E., Sholtz R. I., Adams A. J., “Optical and structural development of the crystalline lens in childhood,” Invest. Ophthalmol. Vis. Sci. 39(1), 120–133 (1998). [PubMed] [Google Scholar]
- 24.Rozema J. J., Atchison D. A., Kasthurirangan S., Pope J. M., Tassignon M. J., “Methods to estimate the size and shape of the unaccommodated crystalline lens in vivo,” Invest. Ophthalmol. Vis. Sci. 53(6), 2533–2540 (2012). 10.1167/iovs.11-8645 [DOI] [PubMed] [Google Scholar]
- 25.Wiemer N. G., Dubbelman M., Kostense P. J., Ringens P. J., Polak B. C., “The influence of diabetes mellitus type 1 and 2 on the thickness, shape, and equivalent refractive index of the human crystalline lens,” Ophthalmology 115(10), 1679–1686 (2008). 10.1016/j.ophtha.2008.03.019 [DOI] [PubMed] [Google Scholar]
- 26.Jones L. A., Mitchell G. L., Mutti D. O., Hayes J. R., Moeschberger M. L., Zadnik K., “Comparison of ocular component growth curves among refractive error groups in children,” Invest. Ophthalmol. Vis. Sci. 46(7), 2317–2327 (2005). 10.1167/iovs.04-0945 [DOI] [PubMed] [Google Scholar]
- 27.Augusteyn R. C., “Growth of the human eye lens,” Mol. Vis. 13, 252–257 (2007). [PMC free article] [PubMed] [Google Scholar]
- 28.Ruggeri M., de Freitas C., Williams S., Hernandez V. M., Cabot F., Yesilirmak N., Alawa K., Chang Y. C., Yoo S. H., Gregori G., Parel J. M., Manns F., “Quantification of the ciliary muscle and crystalline lens interaction during accommodation with synchronous OCT imaging,” Biomed. Opt. Express 7(4), 1351–1364 (2016). 10.1364/BOE.7.001351 [DOI] [PMC free article] [PubMed] [Google Scholar]
- 29.Ruggeri M., de Freitas C., Williams S., Hernandez V. M., Cabot F., Yesilirmak N., Alawa K., Chang Y.-C., Yoo S. H., Gregori G., Parel J.-M., Manns F., “Quantification of the ciliary muscle and crystalline lens interaction during accommodation with synchronous OCT imaging,” Biomed. Opt. Express 7(4), 1351–1364 (2016). 10.1364/BOE.7.001351 [DOI] [PMC free article] [PubMed] [Google Scholar]
- 30.S. R. Uhlhorn, F. Manns, H. Tahi, P. O. Rol, and J.-M. A. Parel, “Corneal group refractive index measurement using low-coherence interferometry,” in BiOS '98 International Biomedical Optics Symposium, (SPIE, 1998), 8. 10.1117/12.309424 [DOI] [Google Scholar]
- 31.Atchison D. A., Smith G., “Chromatic dispersions of the ocular media of human eyes,” J. Opt. Soc. Am. A 22(1), 29–37 (2005). 10.1364/JOSAA.22.000029 [DOI] [PubMed] [Google Scholar]
- 32.Borja D., Siedlecki D., de Castro A., Uhlhorn S., Ortiz S., Arrieta E., Parel J. M., Marcos S., Manns F., “Distortions of the posterior surface in optical coherence tomography images of the isolated crystalline lens: effect of the lens index gradient,” Biomed. Opt. Express 1(5), 1331–1340 (2010). 10.1364/BOE.1.001331 [DOI] [PMC free article] [PubMed] [Google Scholar]
- 33.Drexler W., Hitzenberger C. K., Baumgartner A., Findl O., Sattmann H., Fercher A. F., “Investigation of dispersion effects in ocular media by multiple wavelength partial coherence interferometry,” Exp. Eye Res. 66(1), 25–33 (1998). 10.1006/exer.1997.0401 [DOI] [PubMed] [Google Scholar]
- 34.Augusteyn R. C., “On the growth and internal structure of the human lens,” Exp. Eye Res. 90(6), 643–654 (2010). 10.1016/j.exer.2010.01.013 [DOI] [PMC free article] [PubMed] [Google Scholar]
- 35.Ruggeri M., Uhlhorn S. R., De Freitas C., Ho A., Manns F., Parel J. M., “Imaging and full-length biometry of the eye during accommodation using spectral domain OCT with an optical switch,” Biomed. Opt. Express 3(7), 1506–1520 (2012). 10.1364/BOE.3.001506 [DOI] [PMC free article] [PubMed] [Google Scholar]


