Abstract
Automatic delineation and segmentation of airway structures from endoscopic optical coherence tomography (OCT) images improve image analysis efficiency and thus has been of particular interest. Conventional two-dimensional automatic segmentation methods, such as the dynamic programming approach, ensures the edge-continuity in the xz-direction (intra-B-scan), but fails to preserve the surface-continuity when concerning the y-direction (inter-B-scan). To solve this, we present a novel automatic three-dimensional (3D) airway segmentation strategy. Our segmentation scheme includes an artifact-oriented pre-processing pipeline and a modified 3D optimal graph search algorithm incorporating adaptive tissue-curvature adjustment. The proposed algorithm is tested on endoscopic airway OCT image data sets acquired by different swept-source OCT platforms, and on different animal and human models. With our method, the results show continuous surface segmentation performance, which is both robust and accurate.
1. Introduction
Endoscopic optical coherence tomography is a high-resolution, label-free, and cross-sectional imaging modality that has already been used for disease screening of coronary arteries [1–3], gastrointestinal tract [4,5], and airway [6–8]. Among them, the endoscopic airway OCT imaging is aiming to detect sub-surface structures of the airway, where abnormalities caused by thermal, toxic, or chemical stimulus will result in deformation, cysts, and even necrosis [9–12] of the airway tissue. In vivo endoscopic OCT imaging of large animals and human airways has been reported in literatures [13–15]. In these studies, since the diameter of the airway is relatively large, special techniques are employed to extend the imaging range of conventional endoscopic OCT systems. For example, removing the mirror image by active phase modulation could double the imaging range [14–16], or using a vertical-cavity surface-emitting laser (VCSEL) with very long coherence length could also boost the imaging range [17,18]. As a result, the long imaging range implies that the tissue surface will have large slopes, especially when the imaging probe was not stayed in the center of the airway. Moreover, it also requires more A-line pixels than other OCT systems to represent the longer image range.
Accurate segmentation of different structures from endoscopic airway OCT images can help to quantify injury-related parameters of the airway, such as cross-sectional area [19,20], wall thickness [21], and mucosal accumulations [22] and so on. However, currently the segmentation of the airway structures still mainly depends on manual labeling. Typically, the mucosa and submucosa layers were segmented by tracing the luminal surface and the submucosa-cartilage interface through either using a drawing tablet, or using a mouse to label landmark points followed by curve fitting. Since a complete airway OCT data set may have thousands of images, this manual labeling procedure is usually time-consuming. It also suffers from inter-observer variation because manual operations are subjective.
Various approaches have been proposed to tackle this problem by using automatic computer algorithms, such as the clustering algorithm [23], morphological operations [24], and the shortest path methods [21] and so on. Recently, we proposed an automatic segmentation method based on the dynamic programming (DP) algorithm to delineate the airway wall and to measure the thickness of the mucosa and submucosa layers [25]. The DP algorithm was also successfully applied to endoscopic esophageal OCT, as presented in [26,27]. However, all these methods are two-dimensional (2D) approaches. When segmenting a 3D image data set, these approaches process each image slice separately, yielding a set of individual contours rather than a complete tissue surface. The 2D methods often result in discontinuous artifacts in the y-direction (inter-B-scan direction) since the algorithm does not consider inter-slice continuity. Moreover, due to the same reason, 2D methods will be easily affected by other artifacts in the images, such as overly-saturated pixels, speckle noise, and mirror images, etc.. In these cases, manual intervention and pre-conditioning of the image data is often required.
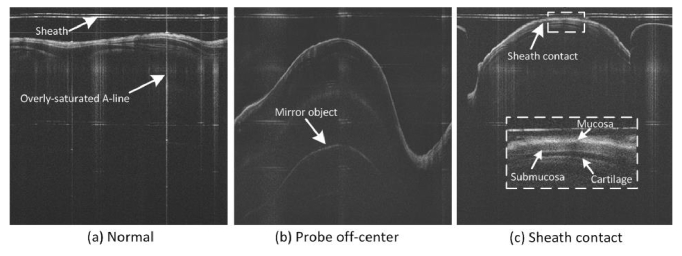
Three-dimensional segmentation methods that consider the inter-slice connection may be used to tackle these problems. In fact, 3D surface detection algorithms have already been proposed for the segmentation of retinal OCT images, such as the 3D-expansion DP method [28], and the 3D optimal graph search algorithm [29–31]. However, unlike retinal OCT, which is based on raster scanning of the laser beam, the images in endoscopic OCT are acquired by rotating and pulling back of a miniature fiber-optic probe, and thus have some distinct features. The first one is various imaging artifacts (Fig. 1(a) and 1(b)), including the plastic sheath used to protect the imaging probe and mirror images induced from active phase modulation, etc.. Second, as discussed above, the curvature of the tissue surface is usually much larger than retinal OCT or other endoscopic OCT, and it changes dramatically across the image (Fig. 1(b)). Third, when the plastic sheath contacts the tissue surface, it will become indistinguishable (Fig. 1(c)), further adding difficulties to separate the airway tissue. Last but not least, in order to achieve a long imaging range while preserving the pixel resolution, airway OCT images have to have more A-line pixels than conventional OCT images, leading to much higher computational demand. Apart from these features, airway OCT images also shares other universal OCT problems including speckle noise and overly-saturated A-lines due to back reflections. All these features together make it difficult to directly apply the well-developed 3D segmentation algorithms.
Fig. 1.
Typical endoscopic airway OCT images. Various artifacts were presented: (a) normal case with flat tissue surface (the imaging probe is in the center of the airway), noise and saturated A-lines are presented; (b) curvature of the airway wall changes dramatically when the probe is not in the center of the airway; (c) edge blurring is induced when the probe sheath is in touch of the airway tissue (inset shows the anatomy of the airway wall).
Addressing these challenges, we present a 3D processing scheme tailored for the segmentation of endoscopic airway OCT images. In the core of our method is the 3D optimal graph search (GS) algorithm originally presented in [32]. To accommodate the features in the airway OCT images, the algorithm is modified by incorporating the prior information derived from the slope of the tissue surface, and thus achieves a more robust performance. The proposed scheme also features an artifact-oriented pre-processing step, which removes the imaging artifacts such as the speckle noise and the plastic sheath, and at the same time obtains the surface slope of the airway lumen. This slope information is further used as a constraint for the subsequent graph search problem. The airway lumen, the mucosa/submucosa boundary, and the submucosa/cartilage boundary are detected by applying the slope-constrained 3D graph search algorithm. The proposed method was tested on airway OCT data sets of animals and human obtained from two different OCT systems. Qualitative and quantitative comparisons of the new method to the 2D DP approach, the conventional 3D GS approach and the manual-labeled method were carried out. The results show that our algorithm has a robust and accurate performance, with the continuity of the tissue surfaces well preserved.
2. Method
2.1 Algorithm overview
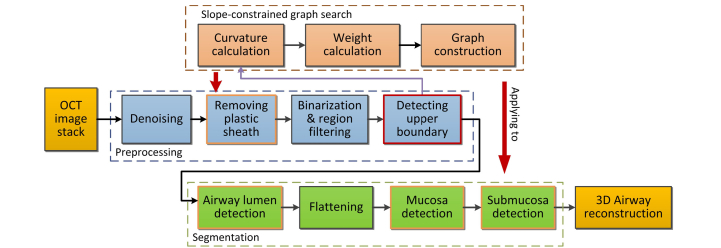
A flow chart outlining the main steps of the algorithm is shown in Fig. 2. The proposed segmentation method is composed of two major steps: 1) image preprocessing and 2) surface segmentation. In the pre-processing step, image noise and other artifacts are removed by performing denoising, sheath identification and removal, and binarization and region filtering. After detecting the upper boundary, the slope of the airway is obtained, and will be further used to constrain the subsequent 3D graph search problem. In the segmentation step, the airway lumen is first detected, and then used as a reference to flatten the structures under the airway surface. This flattening procedure will dramatically reduce the size of the graph search problems for segmenting the mucosa and submucosa layers, and thus will be able to largely cut down the total processing time. Finally, the segmentation results can then be 3D reconstructed for visualization and analysis.
Fig. 2.
Flowchart of the proposed 3D segmentation method
2.2 Image pre-processing
The purposes of this step are: 1) to suppress and remove noise and other artifacts on the airway OCT images and 2) to extract the slope information of the airway structure to improve subsequent surface segmentation. The pre-processing consists of the following steps:
-
1)
Denoising: the bilateral filter is applied to perform speckle noise suppression. Compared to the medium filter, the bilateral filter achieves a better performance in terms of noise suppression and edge preservation.
-
2)
Removing the sheath: the prominent plastic sheath causes strong disturbance in the detection of airway structure. In order to remove the sheath, the upper boundary and lower boundary of the plastic sheath in the OCT images are identified by applying conventional 3D graph search algorithm while limiting the search region. The sheath is then removed by cropping the image from the lower boundary of sheath.
-
3)
Binarization and region filtering: a custom threshold value is used to transform the image to binaried image, and then the regions containing the entire airway structure is detected from the binarized image by filtering the image using a minimum area value and a maximum number of connected regions. This will filter out artifacts such as the mirror image artifacts.
-
4)
Detecting the upper boundary: the detected binarized airway region was considered to contain reliable airway structures, thereby the upper boundary of this region is regarded as a rough estimate of the tissue surface. The single surface 3D graph search method is carried out to detect this boundary, and the slope at each point along the boundary is calculated and saved for subsequent surface segmentation. Notice that the detected boundary in this step is only utilized to obtain the surface slope.
The intermediate results during the above pre-processing steps are illustrated in Fig. 3. An effective pre-processing offers the slope information of the airway and deals with artifacts in the images, providing a solid basis for the accurate segmentation of the airway structure.
Fig. 3.
The pre-processing pipeline to suppress artifacts and obtain the surface slope: the final results of this step are the slope values (both the x and y directions) at each A-line position along the airway lumen surface and the sheath-removed images. For illustration, the slope values along the x-direction are color-coded in the last figure.
2.3 Slope-constrained graph search
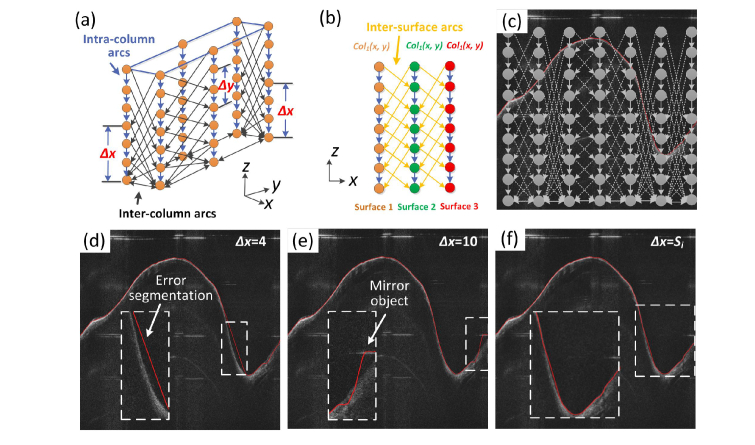
The 3D optimal graph search algorithm, first proposed by Li, et. al. [32], is an effective 3D segmentation method designed for volumetric image data. In the original algorithm, a volumetric image of size X × Y × Z is considered as a 3D matrix I(x, y, z). A graph G = (V, E) consists of a set of vertices V and edges E is constructed according to this matrix. As illustrated in Fig. 4(a) and 4(b), each node in V corresponds to each voxel in I(x, y, z) and the edge set E consists of intra-column arcs and inter-column arcs that connect the neighboring voxels. The surface in a graph can be defined by a function z = f (x, y), where x {1, 2, .., X}, y {1, 2, .., Y}, and z {1, 2, .., Z}. Associated with each (x, y) pair is a column of voxels, and there is only one voxel, the voxel (x, y, f (x, y)), intersects with the surface. Cost values representing the similarity of the voxels belonging to a surface are assigned to the edges, and then the process of finding the optimal surface is transformed to solving a minimum s-t cut problem, which can be efficiently solved by the max-flow/min-cut algorithm [33].
Fig. 4.
(a) and (b) shows the graph construction in the optimal 3D GS algorithm, illustrating the three different types of arcs connecting the vertices; (c) the principle of the proposed slope-constrained graph construction: the inter-column arcs varies with the slope of the tissue surface; (d) and (e): the original 3D GS algorithm failed to detect edges with large slope variation; (f) the edge is detected accurately with the adaptive slope constraint.
During the graph construction process, two smoothness constraints ∆x and ∆y are used to limit the height variation of two neighboring surface points along the x and y direction (Fig. 4(a)). In conventional optimal 3D GS algorithm, the smoothness constraints in the x and y directions are set to constants. However, such a setting cannot satisfy the situation where the slope of the structure is varying, such as in the airway OCT images. As shown in Fig. 4(d), setting a small smoothness constraint value leads to incorrect surface detection results in airway regions that are too steep. Conversely, by setting a large constraint value, the segmentation result will be more susceptible to noise and artifacts, as shown in Fig. 4(e).
Therefore, an adaptive smoothness constraint that varies with the slope of the airway is desirable for accurate segmentation. To enforce this, in this proposed method, the slope of the upper boundary obtained from the pre-processing step is used as locally varying smoothness constraints to construct the 3D graph. In this manner, steep regions correspond to large ∆x and ∆y, while flat regions correspond to small ∆x and ∆y, such that the resulted optimal surface could better conform to the actual tissue curvature. The slope of the airway wall can be described by the tangent value at each point on the curve identified from the binarized region in the pre-processing step. Using x-direction as an example, the slope in this direction is:
| (1) |
where x and z are the horizontal and vertical pixel coordinate values of points on the initial curve, respectively. X and Y are the total number of A-lines and B-scans respectively. Then, the smoothness constraint along the x-direction is written as,
| (2) |
where,
| (3) |
| (4) |
c is a constant to avoid Si being zero, and [·] is the rounding operation. Si allows for 99% of the expected changes along the z direction of two adjacent columns (assuming a Gaussian distribution). Also notice that the mucosa and the submucosa layers share similar topology (degree of bending), so the same smoothness constraint can be used for the segmentation of all these layers. Accordingly, the slope constraint in y direction, that is, ∆y between adjacent B-scans, can also be calculated following the above paradigm.
Another critical step in graph construction is to design the cost c(x, y, z) according to the variations of grayscales of different layers. The cost assigned to each node should be inversely proportional to the probability for that voxel belonging to a surface, such that the optimal surface consists of the set of voxels with minimum total cost. In our method, we use the Sobel filter to obtain the cost at each node. Finally, a weight value are assigned to each node in the graph, and it is defined as:
| (5) |
2.4 Multiple surface detection
In conventional 3D graph search, the time complexity and memory occupation are proportional to the number of voxels and arcs of the graph, and thus to the image size and total number of surfaces. For endoscopic airway OCT, the image data sets often consist of a lot of B-scans, and these B-scans usually have a large number of A-line pixels (usually >1000) to preserve resolution. Therefore, the computational demand for processing the airway OCT images is high. To solve this, when detecting multiple surfaces, we simply flatten the image according to the segmented airway lumen boundary. Then the region below the lumen surface was cropped out to limit the range for segmenting the mucosa and submucosa surfaces (Fig. 5). After flattening, the mucosa/submucosa surface and the submucosa/cartilage surface are segmented separately with the slope-constraint graph search method. This simple flattening method doesn’t require down-sampling of the original data set, therefore the resolution of the OCT images, and thus the segmentation accuracy, can be preserved.
Fig. 5.
Multi-surface segmentation in our method: (a) and (c) are the flattened regions for detecting the mucosa/submucosa and the submucosa/cartilage boundaries, (b) and (d) are the detection results. (e) is the final segmentation result.
3. Experiments
3.1 Endoscopic airway OCT systems and OCT image data sets
The data sets in our experiment were acquired by two endoscopic airway OCT imaging systems, the detailed of which could be found in Ref [15]. and [17]. Figure 6 shows the schematic diagrams of these two systems. Briefly, the OCT system shown in Fig. 6(a) uses a swept-source (SS) laser with 120 nm bandwidth centered at 1310 nm, and a phase modulator that shifts the interference signal for extended imaging range [15]. The depth resolution of this system is 10 μm in tissue, and the maximum imaging range is 25 mm. For the system shown in Fig. 6(b), a swept-source VCSEL laser is utilized as the light source, achieving a very long coherence length [17]. The measured 3 dB imaging range is 30 mm and the axial resolution is 10 μm in tissue. In this paper, a sheep airway data set and a pig airway data set acquired by the first system, and an adult human airway acquired by the second system were used to test the performance of our method. These data sets had previously obtained in pre-clinical and clinical in vivo studies involving multiple animals and subjects. The characteristics and details of the subjects and animals in these studies have been described in [15] and [17]. Table 1 summarizes the image parameters of the testing data sets.
Fig. 6.
The two different platforms for image acquisition: OCT systems with phase modulation for extended imaging range [15] (a) and with a VESEL light source [17] (b). MZI: Mach-Zehnder interferometer.
Table 1. Data sets used in the experiments.
3.2 Segmentation of the airway lumen (single surface)
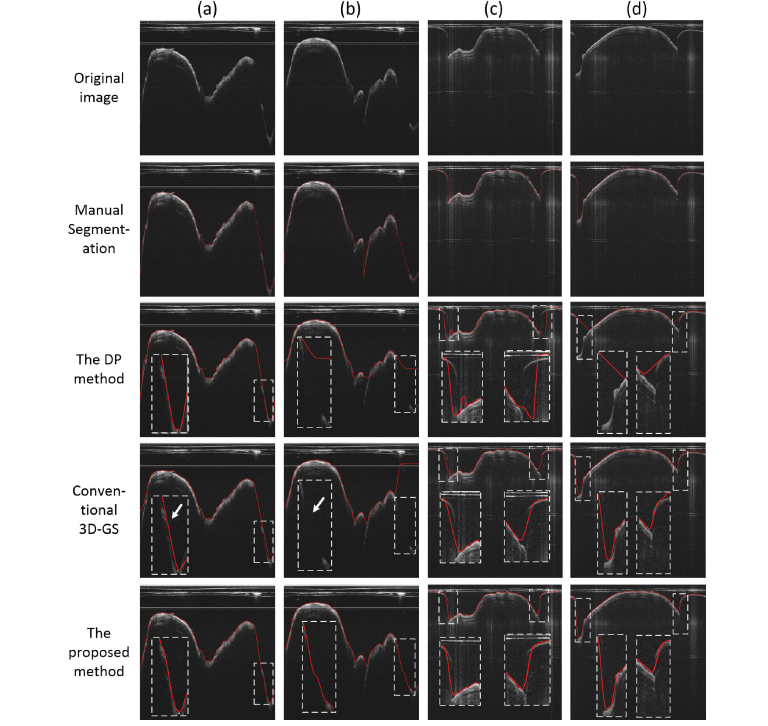
In a first step, the airway lumen was detected using the proposed method. For comparison, we implemented the dynamic programming method detailed in Ref [25]. Briefly, the DP method works by recursively finding the shortest-path (with minimal cost) across a node-weighted graph derived from the image. Because the final result of the DP method was a path, rather than a surface, the algorithm must be conducted on each slice separately. Our implementation of the DP method was written in MATLAB, and was the same as described in Ref [25]. The conventional 3D GS method was also carried out for comparison (with constant ∆x and ∆y, empirically determined). Figure 7 shows some representative segmentation results of the adult human and the sheep data sets. The insets in the figures are enlarged regions indicated by the white dashed lines. The DP method failed to detect the accurate lumen edge in various scenarios, including absence of partial structure (Fig. 7(b)), strong A-line reflection artifacts (Fig. 7(c)), and large surface curvature changes (Fig. 7(d)). Conventional 3D GS method also failed in steep tissue regions (Fig. 7(a) and 7(b), white arrows). By contrast, the proposed method performed much better in all these cases. Moreover, the proposed method could correctly identify the portion of the lumen edge when it was in contact with the sheath, as indicated by the blue arrows. This was due to the consideration of inter-slice information, and thus was more robust to local artifacts and noise.
Fig. 7.
The segmentation of the airway wall: (a) and (b) are representative results of the human airway data set. (c) and (d) are representative results of the sheep airway data set.
To further access the 3D segmentation results, the auto-segmentation results of the airway lumen were transformed into the circumferential images and were then imported to a commercial 3D visualization software (Amira, Thermo Fisher Scientific, MA, US) to perform 3D reconstruction. The results are shown in Fig. 8. As can be seen, compare to the DP method, the proposed method can better preserved the continuity of the surface along the pull-back direction. Incorrect detection results (white arrow) were found on the DP result because it is more vulnerable to local artifacts in the images.
Fig. 8.
Single surface 3D reconstruction: (a) the original image stack from the sheep data set, (b) 3D reconstruction of the airway lumen detected by the proposed segmentation method, (c) 3D reconstruction of the airway lumen detected by the dynamic programming method.
3.3 Segmentation of the airway structures (multiple surfaces)
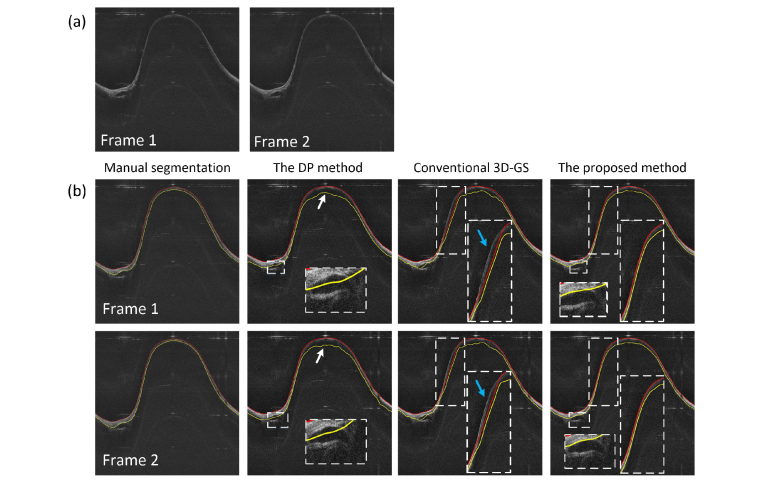
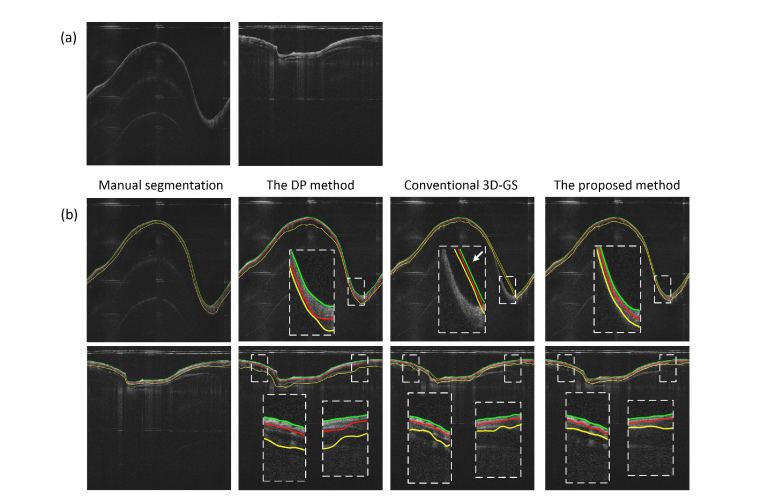
Multiple airway layers were further segmented for the sheep and the pig data sets. Figure 9 and Fig. 10 illustrate the single layer segmentation result and two layers segmentation result respectively. In Fig. 9, two consecutive images and their segmentation results are shown. As can be seen, for the DP method, large variations of the detected edge were found in the consecutive images (white arrows), while for the proposed method, the airway wall structure was accurately segmented. This was contributed by the robust 3D segmentation scheme that utilized the inter-slice information. Moreover, compared to conventional 3D GS method, the boundaries detected by the proposed method appeared closer to the airway surface in the steep regions, resembling the correct position of the airway-air interface (blue arrows). In Fig. 10, when segmenting the two layers of the airway, the proposed method also outperformed the DP and the 3D GS methods, with the mucosa/submucosa boundary (red line), and the steep edges (white arrows) identified more accurately.
Fig. 9.
The segmentation of the airway structure: (a) are two consecutive test images in the pig airway data set, (b) are the segmentation results for one layer (the airway structure) by using different methods.
Fig. 10.
The segmentation of the mucosa and submucosa layers: (a) are two test images in the pig and sheep airway data set, (b) are the segmentation results for the mucosa and submucosa layers by using different methods.
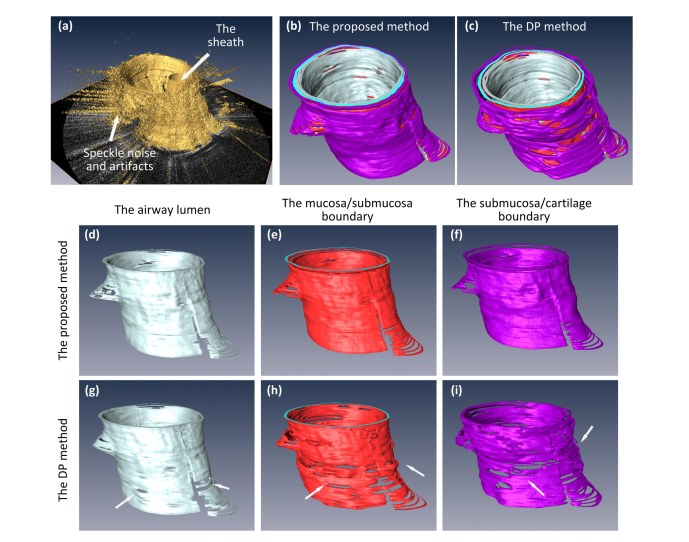
3D reconstruction of the entire airway structure was carried out with the Amira software, and the results are shown in Fig. 11. It can be seen that the segmentation result of the 2D DP method suffered from many strange protuberances and dents across the tissue surfaces, especially on the mucosa/submucosa, and the submucosa/cartilage boundary surfaces (white arrows). On the other hand, the proposed 3D segmentation method successfully dealt with artifacts and noise in the original images, and the 3D reconstruction results appeared much smoother, more continuous and resembled the correct anatomical structure of the airway.
Fig. 11.
Multiple surface 3D reconstruction: (a) the original image from the pig data set; (b) and (c) are the 3D reconstruction of the entire airway segmented by the proposed method and the DP method, respectively; (d) to (f) are the 3D visualization of the airway lumen surface, the mucosa/submucosa boundary, and the submucosa/cartilage boundary detected by the proposed method, respectively; (g) to (i) are the corresponding surfaces detected by the DP method.
3.4 Quantitative comparisons
In order to quantitatively evaluate the performance of the proposed segmentation method, numerical comparisons to manual delineation, the DP algorithm, and conventional 3D GS method were carried out. In this work, manual delineation was carried out in three steps: 1) a series of landmark points on the edge (no less than 50 points per edge) were labelled by using a mouse; 2) the points were spline-interpolated to obtain an initial smooth and continuous edge; and 3) the edge was further refined by either adding landmark points or removing false points to modify the spline-interpolated curve until the observer was satisfied. Different edges were labeled separately using the same procedure. In our experiments, 20 images were randomly selected from each data sets (60 images in total) and manual segmentation of the edges was performed by two experienced airway OCT image analyst. Their labeled edges were averaged to obtain the final result.
In order to quantitatively measure the accuracy of the proposed method, three validation metrics were used: the root mean square error (RMSE), the mean absolute deviation (MAD) and the Dice’s similarity coefficient (DSC). They are given by:
| (6) |
| (7) |
| (8) |
where M is the result of manual segmentation, G is the result of a comparing approach (the proposed method, or the DP method, or the 3D GS method), n is the total number of pixels, and Sa and Sm are the areas of auto- and manual-segmented layer regions.
Table 2 lists the obtained RMSD and MAD of the auto-segmentation methods in all three data sets. As can be seen, the proposed method outperformed the DP and conventional 3D GS methods in the segmentation of all types of edges across all data sets. The accuracy of the segmentation of the mucosa/submucosa edge was higher than that of the submucosa/cartilage boundary. This is caused by degradation of signal as light penetrates deeper. The DSC results of the sheep and pig data sets are listed in Table 3. The mean DSC of the proposed method was higher than that of the other methods, indicating more reliable layer segmentation results. Overall, comparing to the 2D DP and conventional 3D GS methods, the proposed 3D method had a more accurate and robust performance. However, the auto-segmentation accuracy on OCT images has a theoretical bound subject to the imaging physics; a further analysis for airway OCT images is desirable, as the one for retinal OCT presented in Ref [34].
Table 2. RMSE and MAD values of three comparing methods.
| Sample | Edge type | Unit | RMSE |
MAD |
||||
|---|---|---|---|---|---|---|---|---|
| Our method |
GS method | DP method | Our method |
GS method | DP method | |||
| Pig airway | The airway wall lumen | Pixels | 1.2675 | 1.2835 | 1.3153 | 1.1357 | 1.2981 | 1.5647 |
| μm | 15.2100 | 15.4020 | 15.7836 | 13.6284 | 15.5772 | 18.7764 | ||
| Mucosa/submucosa edge | Pixels | 1.8824 | 2.4369 | 2.9838 | 1.0075 | 1.6144 | 1.6483 | |
| μm | 22.5888 | 29.2428 | 35.8056 | 12.0900 | 19.3728 | 19.7796 | ||
| Submucosa/cartilage edge | Pixels | 2.7443 | 3.0648 | 3.6897 | 2.2934 | 2.5562 | 3.2025 | |
| μm | 32.9316 | 36.7766 | 44.2764 | 27.5208 | 30.6744 | 38.4300 | ||
| Sheep airway | The airway wall lumen | Pixels | 1.4148 | 1.5834 | 1.5621 | 1.2796 | 1.6877 | 1.7789 |
| μm | 16.9776 | 19.0008 | 18.7452 | 15.3552 | 20.2524 | 21.3468 | ||
| Mucosa/submucosa edge | Pixels | 2.3374 | 2.9638 | 2.9734 | 1.9288 | 2.1746 | 2.1566 | |
| μm | 28.0488 | 35.5656 | 35.6808 | 23.1456 | 26.0952 | 25.8792 | ||
| Submucosa/cartilage edge | Pixels | 3.0407 | 3.9271 | 3.9116 | 2.6938 | 3.6092 | 3.5848 | |
| μm | 36.4884 | 47.1252 | 46.9392 | 32.3256 | 43.3104 | 43.0176 | ||
| Human airway | The airway lumen | Pixels | 0.8561 | 0.9485 | 1.0824 | 0.8782 | 0.9631 | 1.0235 |
| μm | 10.2732 | 11.3820 | 12.9888 | 10.5384 | 11.5572 | 12.2820 | ||
Table 3. Dice’s coefficients of three comparing methods.
| Sample | Layer type | Mean DSC |
||
|---|---|---|---|---|
| Our method | GS method | DP method | ||
| Pig airway | Mucosa layer | 0.9441 | 0.9138 | 0.9023 |
| Submucosa layer | 0.9146 | 0.8986 | 0.8906 | |
| Sheep airway | Mucosa layer | 0.9108 | 0.8917 | 0.8997 |
| Submucosa layer | 0.8897 | 0.8435 | 0.8621 | |
3.5 Computational performance
The proposed algorithm was implemented in C + + , and was tested on a desktop computer with an Intel Core i7 processor and 24 GB of RAM. The average running time of the algorithm on the sheep and pig airway data sets were 377 s and 342 s for a single edge, 485 s and 448 s for two edges, and 630 s and 523 s for three edges, respectively. Because the DP method was implemented in MATLAB, it might not be fair to compare the computational performance of the two methods because codes executed on MATLAB are usually much slower than on C + + .
4. Discussion and conclusion
Automatic segmentation of the airway structures and layers could help boosting the image analysis efficiency in endoscopic airway OCT imaging. However, unlike conventional OCT systems, the processing of endoscopic OCT images is challenging mainly due to the probe-rotation-based scanning principle. In this work, we presented an automatic three-dimensional airway segmentation scheme based on the 3D optimal graph search algorithm. The major contributions of our proposed processing scheme are: 1) comparing to 2D segmentation methods such as the dynamic programming algorithm, our approach could preserve the 3D continuity of the airway tissue surfaces; 2) we proposed an modified version of the 3D optimal graph search algorithm that utilized the slope of the airway as a constraint to achieve better surface detection results; 3) by performing the artifact-oriented pre-processing, the algorithm also deals with various artifacts in the images, including reliable sheath removal and noise cancelling; and 4) special measures that dramatically cuts down the scale of the graph search problem are taken to reduce the computation cost, while the image resolution and surface detection accuracy are well preserved. In fact, all these features of the proposed algorithm are not limited to endoscopic airway OCT, it could also be used to improve the image segmentation of other endoscopic OCT systems, such as intravascular OCT [35] or endoscopic gastrointestinal tract OCT [36]. The limitation of the proposed algorithm is that the detected optimal surface found by our algorithm must be continuous in the volumetric data, and thus making it difficult to process airway OCT data with bronchial bifurcations. Lastly, further improvement of the proposed algorithm is possible by incorporating edge-enhanced weights in the 3D graph, such as using better edge representations trained from a convolutional neural network [37].
To summarize, we proposed an automatic 3D segmentation method to identify and detect multiple tissue layers in endoscopic airway OCT images. This three-dimensional segmentation scheme preserves the smooth and continuous airway tissue surface by performing a 3D optimal graph search constrained by locally adaptive tissue slope. The robustness of our method against multiple artifacts and noise in the OCT images was demonstrated in the segmentation of three animal and human data sets acquired by two different OCT systems. Quantitative comparisons on results obtained from the proposed method, the 2D-based DP method, the conventional 3D GS method and the gold-standard manual-labeled method further verified the accuracy and superior performance of the new approach.
Funding
China Postdoctoral Science Foundation (2017M610536); National Natural Science Foundation of China (31700857 and 61471188); Guangdong Provincial Natural Science Foundation (2017A030310516); Guangzhou Science and Technology Program (201804010375); National Institutes of Health (R01HL-125084, R01HL-127271, R01HL-105215, R01EY-021529, P41-EB015890)
Disclosures
Z. Chen has a financial interest in OCT Medical, Inc., which, however, did not provide support for this work.
References
- 1.Bouma B. E., Tearney G. J., Yabushita H., Shishkov M., Kauffman C. R., DeJoseph Gauthier D., MacNeill B. D., Houser S. L., Aretz H. T., Halpern E. F., Jang I. K., “Evaluation of intracoronary stenting by intravascular optical coherence tomography,” Heart 89(3), 317–320 (2003). 10.1136/heart.89.3.317 [DOI] [PMC free article] [PubMed] [Google Scholar]
- 2.Jang I. K., Bouma B. E., Kang D. H., Park S. J., Park S. W., Seung K. B., Choi K. B., Shishkov M., Schlendorf K., Pomerantsev E., Houser S. L., Aretz H. T., Tearney G. J., “Visualization of coronary atherosclerotic plaques in patients using optical coherence tomography: comparison with intravascular ultrasound,” J. Am. Coll. Cardiol. 39(4), 604–609 (2002). 10.1016/S0735-1097(01)01799-5 [DOI] [PubMed] [Google Scholar]
- 3.Yin J., Yang H. C., Li X., Zhang J., Zhou Q., Hu C., Shung K. K., Chen Z., “Integrated intravascular optical coherence tomography ultrasound imaging system,” J. Biomed. Opt. 15(1), 010512 (2010). 10.1117/1.3308642 [DOI] [PMC free article] [PubMed] [Google Scholar]
- 4.Vakoc B. J., Shishko M., Yun S. H., Oh W. Y., Suter M. J., Desjardins A. E., Evans J. A., Nishioka N. S., Tearney G. J., Bouma B. E., “Comprehensive esophageal microscopy by using optical frequency-domain imaging (with video),” Gastrointest. Endosc. 65(6), 898–905 (2007). 10.1016/j.gie.2006.08.009 [DOI] [PMC free article] [PubMed] [Google Scholar]
- 5.Suter M. J., Vakoc B. J., Yachimski P. S., Shishkov M., Lauwers G. Y., Mino-Kenudson M., Bouma B. E., Nishioka N. S., Tearney G. J., “Comprehensive microscopy of the esophagus in human patients with optical frequency domain imaging,” Gastrointest. Endosc. 68(4), 745–753 (2008). 10.1016/j.gie.2008.05.014 [DOI] [PMC free article] [PubMed] [Google Scholar]
- 6.Lam S., Standish B., Baldwin C., McWilliams A., leRiche J., Gazdar A., Vitkin A. I., Yang V., Ikeda N., MacAulay C., “In vivo optical coherence tomography imaging of preinvasive bronchial lesions,” Clin. Cancer Res. 14(7), 2006–2011 (2008). 10.1158/1078-0432.CCR-07-4418 [DOI] [PMC free article] [PubMed] [Google Scholar]
- 7.Williamson J. P., McLaughlin R. A., Noffsinger W. J., James A. L., Baker V. A., Curatolo A., Armstrong J. J., Regli A., Shepherd K. L., Marks G. B., Sampson D. D., Hillman D. R., Eastwood P. R., “Elastic properties of the central airways in obstructive lung diseases measured using anatomical optical coherence tomography,” Am. J. Respir. Crit. Care Med. 183(5), 612–619 (2011). 10.1164/rccm.201002-0178OC [DOI] [PubMed] [Google Scholar]
- 8.Wong B. J., Jackson R. P., Guo S., Ridgway J. M., Mahmood U., Su J., Shibuya T. Y., Crumley R. L., Gu M., Armstrong W. B., Chen Z., “In vivo optical coherence tomography of the human larynx: normative and benign pathology in 82 patients,” Laryngoscope 115(11), 1904–1911 (2005). 10.1097/01.MLG.0000181465.17744.BE [DOI] [PubMed] [Google Scholar]
- 9.Traber D. L., Linares H. A., Herndon D. N., Prien T., “The pathophysiology of inhalation injury--a review,” Burns 14(5), 357–364 (1988). 10.1016/0305-4179(88)90003-4 [DOI] [PubMed] [Google Scholar]
- 10.Cox R. A., Burke A. S., Soejima K., Murakami K., Katahira J., Traber L. D., Herndon D. N., Schmalstieg F. C., Traber D. L., Hawkins H. K., “Airway obstruction in sheep with burn and smoke inhalation injuries,” Am. J. Respir. Cell Mol. Biol. 29(3), 295–302 (2003). 10.1165/rcmb.4860 [DOI] [PubMed] [Google Scholar]
- 11.Ridgway J. M., Ahuja G., Guo S., Su J., Mahmood U., Chen Z., Wong B., “Imaging of the pediatric airway using optical coherence tomography,” Laryngoscope 117(12), 2206–2212 (2007). 10.1097/MLG.0b013e318145b306 [DOI] [PubMed] [Google Scholar]
- 12.Brenner M., Kreuter K., Ju J., Mahon S., Tseng L., Mukai D., Burney T., Guo S., Su J., Tran A., Batchinsky A., Cancio L. C., Narula N., Chen Z., “In vivo optical coherence tomography detection of differences in regional large airway smoke inhalation induced injury in a rabbit model,” J. Biomed. Opt. 13(3), 034001 (2008). 10.1117/1.2939400 [DOI] [PMC free article] [PubMed] [Google Scholar]
- 13.Yin J., Liu G., Zhang J., Yu L., Mahon S., Mukai D., Brenner M., Chen Z., “In vivo early detection of smoke-induced airway injury using three-dimensional swept-source optical coherence tomography,” J. Biomed. Opt. 14(6), 060503 (2009). 10.1117/1.3268775 [DOI] [PMC free article] [PubMed] [Google Scholar]
- 14.Jing J., Zhang J., Loy A. C., Wong B. J. F., Chen Z., “High-speed upper-airway imaging using full-range optical coherence tomography,” J. Biomed. Opt. 17(11), 110507 (2012). 10.1117/1.JBO.17.11.110507 [DOI] [PMC free article] [PubMed] [Google Scholar]
- 15.Chou L., Batchinsky A., Belenkiy S., Jing J., Ramalingam T., Brenner M., Chen Z., “In vivo detection of inhalation injury in large airway using three-dimensional long-range swept-source optical coherence tomography,” J. Biomed. Opt. 19(3), 036018 (2014). 10.1117/1.JBO.19.3.036018 [DOI] [PMC free article] [PubMed] [Google Scholar]
- 16.Zhang J., Nelson J. S., Chen Z., “Removal of a mirror image and enhancement of the signal-to-noise ratio in Fourier-domain optical coherence tomography using an electro-optic phase modulator,” Opt. Lett. 30(2), 147–149 (2005). 10.1364/OL.30.000147 [DOI] [PubMed] [Google Scholar]
- 17.Jing J. C., Chou L., Su E., Wong B. J., Chen Z., “Anatomically correct visualization of the human upper airway using a high-speed long range optical coherence tomography system with an integrated positioning sensor,” Sci. Rep. 6(1), 39443 (2016). 10.1038/srep39443 [DOI] [PMC free article] [PubMed] [Google Scholar]
- 18.Tsai T. H., Potsaid B., Tao Y. K., Jayaraman V., Jiang J., Heim P. J., Kraus M. F., Zhou C., Hornegger J., Mashimo H., Cable A. E., Fujimoto J. G., “Ultrahigh speed endoscopic optical coherence tomography using micromotor imaging catheter and VCSEL technology,” Biomed. Opt. Express 4(7), 1119–1132 (2013). 10.1364/BOE.4.001119 [DOI] [PMC free article] [PubMed] [Google Scholar]
- 19.McLaughlin R. A., Williamson J. P., Phillips M. J., Armstrong J. J., Becker S., Hillman D. R., Eastwood P. R., Sampson D. D., “Applying anatomical optical coherence tomography to quantitative 3D imaging of the lower airway,” Opt. Express 16(22), 17521–17529 (2008). 10.1364/OE.16.017521 [DOI] [PubMed] [Google Scholar]
- 20.Wijesundara K., Zdanski C., Kimbell J., Price H., Iftimia N., Oldenburg A. L., “Quantitative upper airway endoscopy with swept-source anatomical optical coherence tomography,” Biomed. Opt. Express 5(3), 788–799 (2014). 10.1364/BOE.5.000788 [DOI] [PMC free article] [PubMed] [Google Scholar]
- 21.Lee S.-W., Heidary A. E., Yoon D., Mukai D., Ramalingam T., Mahon S., Yin J., Jing J., Liu G., Chen Z., Brenner M., “Quantification of airway thickness changes in smoke-inhalation injury using in-vivo 3-D endoscopic frequency-domain optical coherence tomography,” Biomed. Opt. Express 2(2), 243–254 (2011). 10.1364/BOE.2.000243 [DOI] [PMC free article] [PubMed] [Google Scholar]
- 22.Adams D. C., Pahlevaninezhad H., Szabari M. V., Cho J. L., Hamilos D. L., Kesimer M., Boucher R. C., Luster A. D., Medoff B. D., Suter M. J., “Automated segmentation and quantification of airway mucus with endobronchial optical coherence tomography,” Biomed. Opt. Express 8(10), 4729–4741 (2017). 10.1364/BOE.8.004729 [DOI] [PMC free article] [PubMed] [Google Scholar]
- 23.Heydarian M., Choy S., Wheatley A., McCormack D., Coxson H. O., Lam S., Parraga G., “Automated segmentation of lung airway wall area measurements from bronchoscopic Optical Coherence Tomography imaging,” Proc. SPIE 7965(519), 79651M (2011). 10.1117/12.878194 [DOI] [Google Scholar]
- 24.Kirby M., Lee A. M. D., Candido T., Macaulay C., Lane P., Lam S., Coxson H. O., “Automated segmentation of porcine airway wall layers using optical coherence tomography: comparison with manual segmentation and histology,” Proc. SPIE 8927, 1–9 (2014). [Google Scholar]
- 25.Qi L., Huang S., Heidari A. E., Dai C., Zhu J., Zhang X., Chen Z., “Automatic airway wall segmentation and thickness measurement for long-range optical coherence tomography images,” Opt. Express 23(26), 33992–34006 (2015). 10.1364/OE.23.033992 [DOI] [PMC free article] [PubMed] [Google Scholar]
- 26.Zhang J., Yuan W., Liang W., Yu S., Liang Y., Xu Z., Wei Y., Li X., “Automatic and robust segmentation of endoscopic OCT images and optical staining,” Biomed. Opt. Express 8(5), 2697–2708 (2017). 10.1364/BOE.8.002697 [DOI] [PMC free article] [PubMed] [Google Scholar]
- 27.Gan M., Wang C., Yang T., Yang N., Zhang M., Yuan W., Li X., Wang L., “Robust layer segmentation of esophageal OCT images based on graph search using edge-enhanced weights,” Biomed. Opt. Express 9(9), 4481–4495 (2018). 10.1364/BOE.9.004481 [DOI] [PMC free article] [PubMed] [Google Scholar]
- 28.Huang S., Piao Z., Zhu J., Lu F., Chen Z., “In vivo microvascular network imaging of the human retina combined with an automatic three-dimensional segmentation method,” J. Biomed. Opt. 20(7), 076003 (2015). 10.1117/1.JBO.20.7.076003 [DOI] [PMC free article] [PubMed] [Google Scholar]
- 29.Garvin M. K., Abràmoff M. D., Wu X., Russell S. R., Burns T. L., Sonka M., “Automated 3-D intraretinal layer segmentation of macular spectral-domain optical coherence tomography images,” IEEE Trans. Med. Imaging 28(9), 1436–1447 (2009). 10.1109/TMI.2009.2016958 [DOI] [PMC free article] [PubMed] [Google Scholar]
- 30.Garvin M. K., Abràmoff M. D., Kardon R., Russell S. R., Wu X., Sonka M., “Intraretinal layer segmentation of macular optical coherence tomography images using optimal 3-D graph search,” IEEE Trans. Med. Imaging 27(10), 1495–1505 (2008). 10.1109/TMI.2008.923966 [DOI] [PMC free article] [PubMed] [Google Scholar]
- 31.Song Q., Bai J., Garvin M. K., Sonka M., Buatti J. M., Wu X., “Optimal multiple surface segmentation with shape and context priors,” IEEE Trans. Med. Imaging 32(2), 376–386 (2013). 10.1109/TMI.2012.2227120 [DOI] [PMC free article] [PubMed] [Google Scholar]
- 32.Li K., Wu X., Chen D. Z., Sonka M., “Optimal surface segmentation in volumetric images--a graph-theoretic approach,” IEEE Trans. Pattern Anal. Mach. Intell. 28(1), 119–134 (2006). 10.1109/TPAMI.2006.19 [DOI] [PMC free article] [PubMed] [Google Scholar]
- 33.Boykov Y., Kolmogorov V., “An experimental comparison of min-cut/max-flow algorithms for energy minimization in vision,” IEEE Trans. Pattern Anal. Mach. Intell. 26(9), 1124–1137 (2004). 10.1109/TPAMI.2004.60 [DOI] [PubMed] [Google Scholar]
- 34.Dubose T. B., Cunefare D., Cole E., Milanfar P., Izatt J. A., Farsiu S., “Statistical models of signal and noise and fundamental limits of segmentation accuracy in retinal optical coherence tomography,” IEEE Trans. Med. Imaging 37(9), 1978–1988 (2018). 10.1109/TMI.2017.2772963 [DOI] [PMC free article] [PubMed] [Google Scholar]
- 35.Li Y., Jing J., Heidari E., Zhu J., Qu Y., Chen Z., “Intravascular optical coherence tomography for characterization of atherosclerosis with a 1.7 micron swept-source laser,” Sci. Rep. 7(1), 14525 (2017). 10.1038/s41598-017-15326-4 [DOI] [PMC free article] [PubMed] [Google Scholar]
- 36.Li Y., Jing J., Yu J., Zhang B., Huo T., Yang Q., Chen Z., “Multimodality endoscopic optical coherence tomography and fluorescence imaging technology for visualization of layered architecture and subsurface microvasculature,” Opt. Lett. 43(9), 2074–2077 (2018). 10.1364/OL.43.002074 [DOI] [PMC free article] [PubMed] [Google Scholar]
- 37.Gan M., Wang C., Yang T., Yang N., Zhang M., Yuan W., Li X., Wang L., “Robust layer segmentation of esophageal OCT images based on graph search using edge-enhanced weights,” Biomed. Opt. Express 9(9), 4481–4495 (2018). 10.1364/BOE.9.004481 [DOI] [PMC free article] [PubMed] [Google Scholar]


