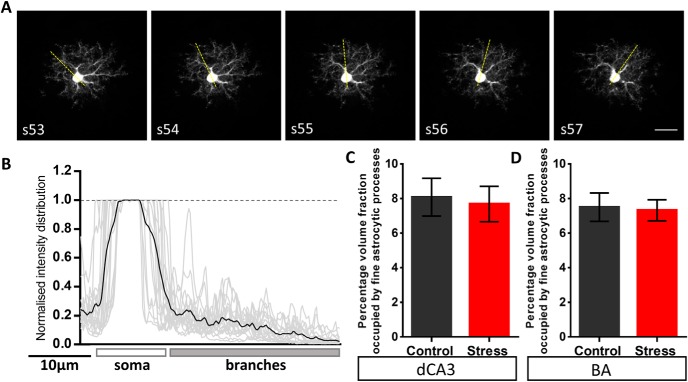
Figure 4.
Stress does not affect the volume fraction of fine astrocytic protrusions across the BA and the dCA3 area of the hippocampus. A, Representative background subtracted images of consecutive optical sections (optical section number denoted by the inset text) consisting of the astrocyte soma and its processes. The overlay of yellow dotted line represents the sampling line ROI which was used to perform intensity sampling along the length. The line ROI was rotated at an increment of 20° around the soma (with a random initial angle) throughout the optical sections containing the soma. B, A representative plot of intensity distribution across the length of the sampling ROI. The intensity profile is normalized to the emission signal intensity in the soma. The gray lines represent intensity profiles of individual optical sections containing the soma across multiple astrocytes and the black line represents the mean intensity. C, D, No significant difference was observed in the relative intensity of fine astrocytic processes of astrocytes in the BA or hippocampal dCA3 area (dCA3: control: n = 11 cells; stress: n = 12 cells, BA: control: n = 12 cells; stress: n = 15 cells). Scale bar: 20 µm.

