

Abstract
Over the past 3 decades, public health professionals have worked to stem the rising childhood obesity epidemic. Despite the field’s best efforts, no progress has been made in reducing child obesity. One reason for this failure may be that obesity prevention and treatment efforts have predominately been delivered during the 9-month school year. However, recent evidence suggests that the summer, not the school year, is when unhealthy changes in body composition (ie, accelerated increases in percent body fat) and fitness losses occur. This unhealthy change in body composition and fitness loss during the summer could be explained by the “Structured Days Hypothesis,” which posits that children engage in a greater number of unhealthy obesogenic behaviors on unstructured days when compared with structured days. Furthermore, the summer may be contributing to a widening “health gap” between children from low-income and middle- to upper-income families. During summer, fewer opportunities exist for children from low-income households to access healthy structured programs that do not require fees for participation. Moving forward, public health professionals should prioritize efforts to mitigate unhealthy changes in body composition and fitness loss during the summer by identifying ways to provide access to structured programming during this timeframe for children from low-income households.
Keywords: obesity, overweight, children, youth, intervention
‘Recently, summer has been identified as a period of excess weight gain and reduced physical fitness.’
Overweight and obesity during childhood has been linked to multiple noncommunicable diseases including high blood pressure, abnormal fasting glucose, insulin resistance, type 2 diabetes, sleep apnea, asthma, and joint problems.1-5 Over the last 3 decades, obesity rates in children and adolescents (2-19 years) have nearly doubled, and in 2014, one in 5 children were classified as obese.6 While increases in the prevalence of childhood obesity may have slowed in recent years,6 rates remain high and obesity negatively affects a large portion of children. Furthermore, there has been a decline in children’s performance on fitness tests at a rate of approximately 5% per decade since the 1970s.7 Decreased fitness has been related to negative immediate and long-term health outcomes for youth in terms of bone mineral density, overweight and obesity, metabolic syndrome, and blood pressure.8
Disparities in Overweight and Obesity by Income Level
Unfortunately, like many other negative health outcomes, the burden of overweight and obesity is borne disproportionately by children and adults from low-income families.9,10 Furthermore, children from low-income families are typically less fit than their middle- to upper-income peers.11 Low fitness and high levels of overweight and obesity in children from low-income families has led to increased risk of high blood pressure,9 rates of type 2 diabetes,12 and a plethora of other negative health outcomes,10 when compared with their middle- to upper-income peers. Thus, strategies to address overweight and obesity and poor fitness levels in this population are desperately needed.
Obesogenic Behaviors: The Behaviors Behind Obesity Epidemic
Increasing rates of overweight and obesity and decreasing fitness levels can be attributed to a complex web of social, environmental, and genetic determinates.13 However, an individual’s behaviors play a large role in body composition and fitness levels.13-15 Physical activity levels, sedentary/screen time, dietary intake, and sleep are the 4 primary obesogenic behaviors that have been linked to overweight and obesity and fitness levels, either independently or in combination with one another.16-19
Are We Simply Intervening on Interventions?
Over the last 30 years, there have been a multitude of efforts to address childhood obesity. The vast majority of these efforts have targeted the 4 obesogenic behaviors identified above.20,21 One of the most recent large-scale efforts was launched in 2010 by the Centers for Disease Control and Prevention. This 5-year initiative, titled “Winnable Battles,” identified 6 public health priority areas that according to the Centers for Disease Control and Prevention “represented a leading cause of illness, injury, disability, death or presented large societal costs.”22 The Centers for Disease Control and Prevention set targets to reach by 2015 and implemented several strategies intended to drive change and meet these goals. One of the identified “Winnable Battles” was childhood obesity. Despite this increased focus, obesity rates of children have not decreased over the last 7 years. In fact, in a recent summary of the initiative, Thomas Frieden, the former director of the Centers for Disease Control and Prevention, concluded that “there has been no progress reducing childhood obesity.”22
A recent review of current interventions funded by the National Heart, Lung, and Blood Institute targeting childhood obesity revealed that 70% of the current trials are being conducted in schools.21 Furthermore, the same review identified 22 interventions targeting childhood obesity published in PubMed/Medline between 2011 and 2016. Of these 22 studies, 11 took place in schools. It is not surprising that the majority of childhood obesity prevention efforts have targeted schools. Nearly all youth (~95% of youth aged 5-18 years in the United States) attend school, and schools have the infrastructure in terms of facilities and staff in place to reduce children’s engagement in obesogenic behaviors. However, after decades of school-based interventions that have failed to mitigate the obesity epidemic, it may be time to shift the field’s focus. Furthermore, there is growing evidence that schools are not the root of the childhood obesity epidemic. Growing evidence suggests that routine practice in schools may be an intervention in and of itself that has a positive impact on students’ obesogenic behaviors and, in turn, body composition and fitness. If this is the case past efforts may have shown limited improvements in decreasing participants’ obesogenic behaviors because routine practice in schools is already affecting students’ obesogenic behaviors positively. Thus, there is limited room for improvement. Furthermore, these studies have largely been ineffective at addressing childhood obesity because they fail to address the time periods outside of the school day that are negatively affecting body composition and fitness to a larger degree than the time that children spend in school.
Summer as a Critical Window for Intervention
Recently, summer has been identified as a period of excess weight gain and reduced physical fitness.23-28 In a recent article, von Hippel and Workman29 analyzed data from the Early Childhood Longitudinal Study, Kindergarten Class of 2010-2011, to examine weight gain during the summer compared to the school year. The Early Childhood Longitudinal Study collects data on a nationally representative complex random sample of 18 170 US children and followed children from the fall of their kindergarten year of school (2011) to the spring of second grade (2013). Children’s heights and weights were measured in schools each fall and spring. These data have revealed that virtually all increases in body mass index (BMI) occur during the summer and the prevalence of overweight and obesity actually decreased during the school year in the first and second grades (see Figure 1a).29 Similarly, Chen et al30 conducted a study that followed 1651 elementary school children from one school district in southeastern Texas from the fall of their kindergarten school year (2005) until the fall of their fifth-grade school year (2010). Children’s heights and weights were measured at the beginning (August/October) and end of each school year (March/May). Similar to the findings of von Hippel and Workman,29 increases in the prevalence of overweight and obesity were found primarily to occur during the summer (see Figure 1b). In fact, no matter the weight status of children when they entered the summer, similar increases in BMI z-score were observed. Furthermore, the school year acted as an overweight and obesity prevention program for children that were normal weight (ie, minimal increase in BMI z-score during the school year) and an overweight and obesity treatment program for children that were overweight or obese (ie, decreases in BMI z-score during the school year; see Figure 1c). With a number of other studies reporting similar findings,16,26,31-33 the evidence that summer is a window of vulnerability for children during which time the prevalence of overweight and obesity increases at a greater rate when compared with the school year is clear.
Figure 1.

(a) Changes in school year versus summer prevalence of overweight and obesity from kindergarten to second grade in a nationally representative cohort of children (Source: von Hippel and Workman29). (b) Changes in school year versus summer prevalence of overweight and obesity from first through fifth grades in a cohort of children attending one school district in Texas (Source: Chen et al30). (c) Changes in school year versus summer BMI z-score by weight status (Source: Moreno et al24).
Similar to research on unhealthy changes in body composition, summer is recognized as a time where children lose fitness. Evidence of summer fitness loss dates back at least 20 years. The Sports, Play, and Active Recreation for Kids (SPARK) intervention was a 2-year health-related physical education intervention that targeted fourth- and fifth-grade students’ physical activity during physical education lessons and outside of the school day.25 The study was conducted in 7 schools in the San Diego, California, area and included 955 students (468 girls). The study had 2 intervention arms and 1 control arm. In one of the intervention arms physical education was delivered by certified physical education teachers, while the other arm had physical education delivered by classroom teachers. Both intervention conditions received professional development training for their teachers and a health-related physical education curriculum to deliver. The control condition delivered physical education as usual. Students’ cardiovascular endurance was measured via a timed mile run. The study found that mile run times decreased for boys and girls in all 3 conditions from the beginning to the end of each school year (indicating improved fitness; see Figure 2a). However, during the summer fitness was lost as indicated by increased mile run times when children returned to school in the second year of the study. Similarly, in a more recent study, Fu et al28 found that children’s cardiovascular fitness decreased over the summer. This study was conducted in 3 low-income schools in Utah with 1232 first- to sixth-grade students (624 girls). The study found that, on average, students were able to complete 5.4 fewer laps on the 20-meter Progressive Aerobic Cardiovascular Endurance Run after they returned to school from summer vacation and declines in fitness were observed after summer across all grade levels except for first grade (see Figure 2b). There is growing evidence indicating that summer, not the school year, is contributing to fitness loss in children.31,33
Figure 2.
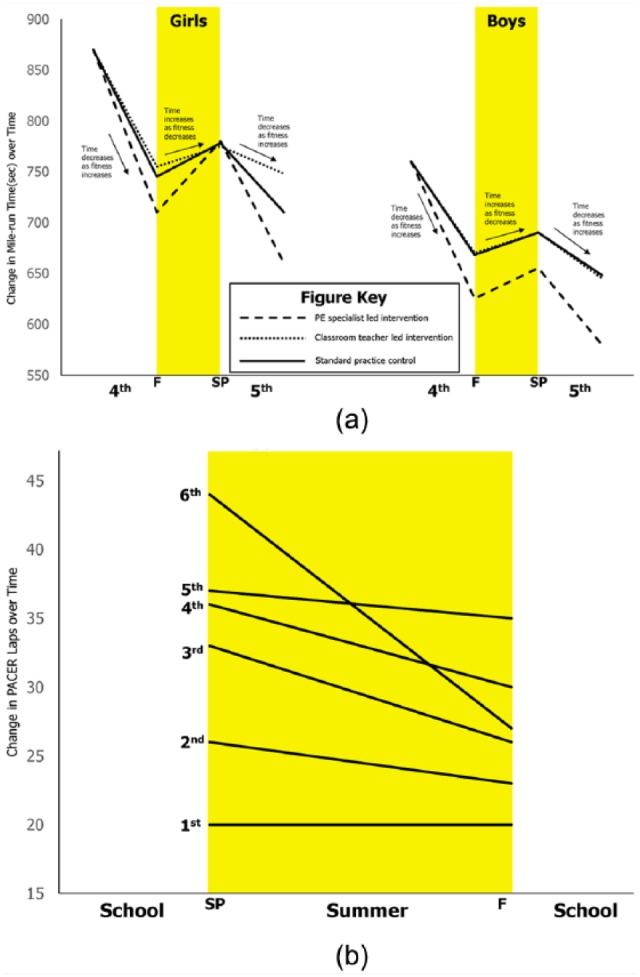
(a) Changes in fitness during the school year and summer from the SPARK study (Source: Sallis et al25). (b) Changes in fitness during the school year and summer in one school district in Utah (Source: Fu et al28).
Health Gap Hypothesis
The education literature has a long history of robust findings showing that the achievement gap in academic performance widens over summer vacation between children from low-income and middle- to upper-income households (see Figure 3a).34,35 A similar phenomenon may be occurring over the summer with accelerated weight gain and fitness loss (see Figure 3b). It is well established that children from low-income households are at a higher risk for overweight and obesity and its associated comorbidities.9,10 We hypothesize that children from low-income households spend a similar amount of time in front of a screen, engage in similar levels of physical activity, sleep for similar lengths of time, and have similar dietary intakes, during the school year, as their peers from middle- to upper-income families. This would result in a similar gain in the amount of weight between children from low- and high-income households during the school year. As shown in Figure 3b, we hypothesize that children from low-income households experience a greater amount of weight gain during the summer compared with their high-income peers. We believe this results in a widening of the “health gap” over the summer and that this widening is one of the primary reasons why rates of childhood overweight and obesity are significantly higher in children from low-income households when compared with children from middle- to upper-income households.9,10,36 We hypothesize that the “health gap” widens over time and is almost entirely attributable to differences in the amount of weight gain during the summer between children from high- and low-income households. Thus, summer represents a form of double jeopardy for children from low-income households where they are losing academic ability and gaining disproportionate amounts of unhealthy weight.37
Figure 3.
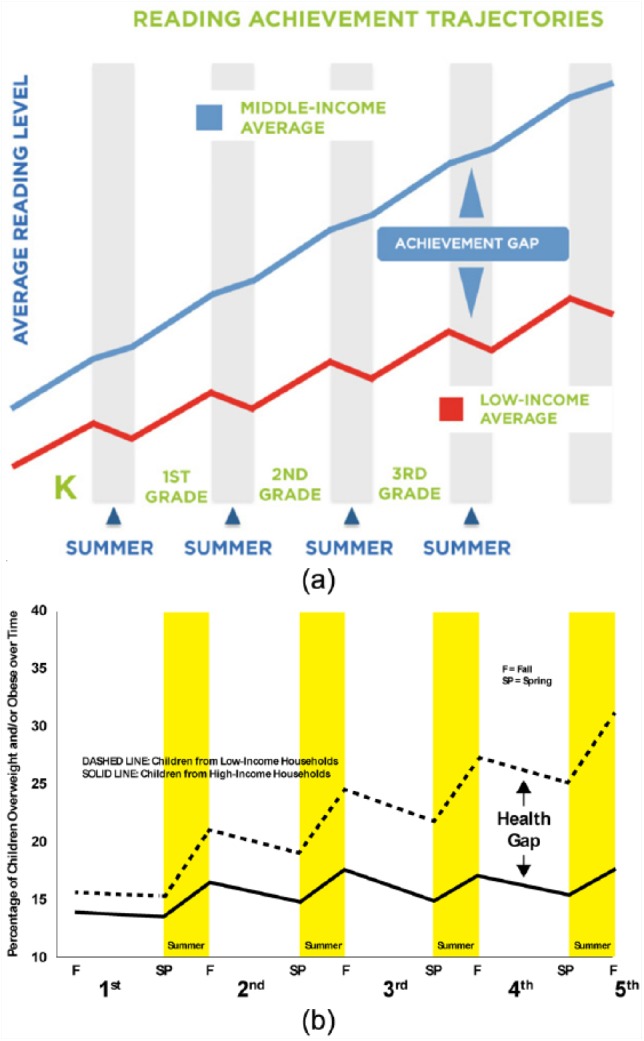
(a) Achievement gap (Source: California Department of Education. A Blueprint for Great Schools). (b) Health gap hypothesis for accelerated weight gain.
While evidence of the “health gap” widening over summer is sparse, given no studies have been designed to examine this phenomenon, there is one study with preliminary evidence supporting the Health Gap Hypothesis. This study examined 138 ninth-grade students that either attended (n = 70) or did not attend (n = 68) a summer school program. Of the students that did not attend the summer school program, the study found that students that came from families with the lowest income, had fathers with lower education levels, lived with one parent, and did not have a caregiver available during the day experienced greater increases in percent body fat than their peers over the 3 months of summer (see Figure 4).31 While these findings are very preliminary, they provide initial evidence supporting the Health Gap Hypothesis.
Figure 4.

Differences in percent body fat change between children that attend and do not attend 5-week summer program by income level and family status (Source: Park and Lee31).
What Is Driving This Health Gap: Structured Days Hypothesis
Despite 3 decades of research focused on childhood overweight and obesity, we still know little about children’s obesogenic behaviors (ie, physical activity, sedentary, sleep, and dietary behaviors) during summer vacation and, thus, why summer is a time of accelerated weight gain and fitness loss. However, the evidence cited above shows that time spent in school protects children from excessive weight gain. This protective effect may be explained by the Structured Days Hypothesis, which has been presented in detail elsewhere.38 The Structured Days Hypothesis posits that a structured day, defined as a preplanned, segmented, and adult-supervised compulsory environment, plays an overall protective role for children against obesogenic behaviors and, ultimately, prevents the occurrence of negative health outcomes, in this case, unhealthy changes in body composition and loss in fitness. Essentially, the Structured Days Hypothesis draws on concepts in the “filled-time perspective” literature, which posits that time filled with favorable activities cannot be filled with unfavorable activities.39 This perspective would lead to the hypothesis that children engage in a greater number of obesogenic behaviors that lead to increased weight gain on less structured days (eg, weekend and summer days) than on structured days (eg, school days). These behaviors include (1) increased time spent sedentary,40,41 (2) reduced engagement in physical activity,41-45 (3) displaced sleep patterns,46-48 and (4) unhealthy dietary patterns.49-55 A review of 190 studies reporting weekend versus weekday outcomes across these obesogenic behaviors support this hypothesis, with approximately 80% of the studies showing obesogenic behaviors were less favorable on weekend days (less structure) compared with weekdays (more structure).38
Structured Summer Programming: A Potential Solution
One solution to the issue of accelerated weight gain during the summer may be to provide access to summer programming for children.56 Summer programming can take many forms; these include singular focus programming, such as sport or specialty programs (eg, soccer, Lego Robotics, and adventure camps) and learning/academic tutoring programs, as well as programs with a broader focus. The most common type of summer program is referred to as a “traditional summer day camp.” These programs typically provide children with opportunities to be physically active, offer academic lessons and/or enrichment experiences, and serve meals and snacks. Traditional summer day camps operate daily from 8 am to 5 pm for 8 to 10 weeks of the summer. These are not overnight/sleep over camps or lifestyle modification weight loss camps. Organizations such as city and county parks and recreation departments, YMCAs, Boys & Girls Clubs, and schools are the largest providers of traditional summer day camps.
One possible avenue for providing children access to summer programming is switching school calendars to a year-round format. While year-round schools are designed to mitigate summer learning loss, they may also have an unintended positive impact on children’s weight status and fitness. It is important to note that year-round schools operate on a 180-day schedule, similar to traditional schools. However, year-round schools incorporate shorter, more frequent breaks throughout the entire year rather than one prolonged 2- to 3-month break over summer. For example, a typical year-round school could follow a 45/15 schedule where the school operates for 45 week days in a row (9 weeks) and then takes a 15-day break (3 weeks). By taking shorter, more frequent breaks the negative obesogenic behaviors that students engage in during unstructured days will not compound over time to the degree that they would over a longer massed break (ie, traditional summer). Thus, the excessive weight gain and fitness loss that children experience over the summer may be mitigated. However, there is no empirical evidence related to the effect of year-round schools on students’ unhealthy changes in body composition and fitness loss. Thus, studies examining the impact of year-round schools on students’ health are needed. Despite mixed evidence of the effectiveness of year-round schooling on academics,57-59 and the lack of evidence of the impact on weight and fitness, the popularity of year-round school calendars has grown, with 3700 public schools60 serving over 2 000 000 students operating on a year-round calendar,61 an 802% increase since 1985.60
Summer day camps are also a promising setting for addressing unhealthy changes in body composition and fitness loss over the summer because they are potentially a structured, healthy environment. A growing number of summer camps participate in the US Department of Agriculture Summer Food Service Program, which sets nutritional guidelines related to quantity and quality of food served in programs that serve children from low-income households.62 In return, summer day camps receive federal reimbursement for the foods they serve. Recent research suggests that meals and snacks served in summer day camps meet nutritional guidelines.63 Furthermore, attendance at summer day camps can help regulate sleep schedules, with camps starting between 7 and 9 am, and children that attend summer day camps accumulate between 60 and 90 minutes64-67 of moderate-to-vigorous physical activity while in attendance. Finally, summer day camps offer a variety of activities including enrichment, academics, and physical activity opportunities,64,68 which limits children’s screen time.
While evidence of the positive impact that structured summer programming can have on unhealthy changes in body composition and fitness loss of children from low-income families over the summer is limited, there are at least 2 examples in the literature. In one study, previously referenced in the “Health Gap” Hypothesis section, 138 ninth-grade students attending 5 weeks of summer school experienced no weight gain or fitness loss, while their peers from the same school, who did not attend the summer school, experienced statistically significantly greater weight gains and fitness loss over the 3 months of summer (see Figure 4).31 Furthermore, children that attended the summer school program did not experience differential changes in percent body fat by income, father’s education level, living status, or caregiver status. This provides initial evidence that simply attending a structured program in the summer, even if the focus of that program is academic and not health, may be enough to close the “health gap.” A second study tested a healthy weight intervention targeting physical activity and healthy eating in 171 K-8th grade students who were majority Hispanic enrolled and in Midwestern Migrant Education Summer Program. The summer program lasted 7 weeks. The program showed that 74.7% of children in the intervention arm successfully maintained or lost BMI percentile points. However, what is most interesting here is that 64.5% of children in the control arm (children attending the Migrant Education Summer Program but not exposed to the intervention) also maintained or lost BMI percentile points (see Figure 5). The maintenance or loss of BMI percentile points in the control program is dissimilar to national trends that show children of Hispanic descent typically gain ~6 BMI percentile points over the summer.24 This weight maintenance or loss for the majority of children in the control condition might be explained by the Structured Days Hypothesis. Again, this shows that simply attending structured programming, even if the focus of that programming is not mitigating unhealthy weight gain or fitness loss, can affect these outcomes in a positive way.
Figure 5.

Changes in BMI percentile in a 7-week migrant education program (Source: Kilanowski JF, Gordon NH. Making a difference in migrant summer school: testing a healthy weight intervention. Public Health Nurs. 2015;32(5):421-429).
Cost: A Critical Barrier to Access to Summer Programming
While summer day camps represent a healthy environment that may mitigate unhealthy changes in body composition over the summer, children from low-income families do not have access to these programs because of cost. The typical summer camp costs $288 per week to attend.69 For an 8- to 10-week program, this totals $2304 to $2880 for a child to attend every week of operation during a single summer. For a family that lives at or below the federal poverty level of $24 300 (low-income families), this cost is unrealistic and excessively burdensome. In the most recent America After 3 pm national survey,70 2 out of 3 parents from low-income households indicated that they wanted their children to participate in summer programs, but were unable to enroll them because of the cost. Furthermore, 9 in 10 parents, no matter their income level, supported public funding for summer programs.
In fact, according to the American Camp Association, 80% of children attending summer camps are from middle- to upper-income families.69 Although summer day camp organizations can and do offer scholarships that entirely fund a child to attend and/or use sliding scales for reduced enrollment fees based on income level, only 13% of summer day camps nationally provide a discount based on a sliding scale, with 28% indicating they also adjust fees based on parental financial situations (see Figure 6a and b).69 Scholarships and sliding scale pricing structures rely entirely on donations for support or the enrollment of middle- and high-income households to offset the cost. Furthermore, while scholarships and sliding scales do provide opportunities for some children from low-income households to attend, they only accommodate a limited number of children who qualify. In 2016, only 1 in 4 summer day camps indicated that they covered at least 50% of the costs associated with enrollment for less than 10% of the children attending.69 This leaves a large number of children from low-income households without access to summer programming because their family cannot afford the cost to attend. Thus, very few children from low-income households are able to access summer programming on their own or are able to access summer programming due to a limited number of scholarships.
Figure 6.

(a) Demographic break down of children attending summer day camps. (b) Income break down of families with children attending summer day camps (Source: American Camp Association69).
Closing the Health Gap
Given the disproportionate burden that overweight and obesity places on children from low-income families, strategies to relieve this burden are warranted. Strategies should expand beyond school, the traditional and largely ineffective avenue that has been extensively explored over the last 3 decades. Given the growing evidence that the majority of unhealthy changes in body composition and fitness loss occur during the summer and the emerging evidence that structured programming positively affects weight and fitness one potential strategy is to address the cost barriers that prohibit children from low-income families’ access to healthy structured programing during the summer. Scientific literature on demand-side financing71,72 offers a promising intervention framework for addressing unhealthy weight gain and fitness loss for children from low-income families. The application of demand-side financing has a long and successful history and has been applied to a number of public health topics and populations. The most common forms of demand-side financing programs include providing financial incentives to adults to improve one or more health behaviors (eg, smoking cessation, weight reduction, diabetes management), as well as the use of voucher programs or subsidies to reduce cost barriers associated with nutrition and prenatal care (Women, Infants, and Children [WIC]), housing, sanitation/public waterworks, childcare [eg, Head Start], and health seeking behaviors [eg, HIV/AIDS]).71-80 Thus, there is consistent evidence that the use of financial incentives or vouchers leads to improvements in health behaviors and outcomes.
There is preliminary evidence that vouchers are already helping address unhealthy changes in body composition in children from low-income families. Head Start is a free preschool program administered by the Department of Health and Human Services and run by local governments which provide vouchers for children from low-income families to attend. Head Start is founded on 4 components—education, health, parent involvement, and social services—and is designed to help children from low-income families climb out of the cycle of poverty. A recent study81 examined the impact of Head Start on children that attended when compared to children that did not attend. Changes in BMI z-score over 2 years of 43 748 children were examined. Children were divided into 3 groups: those that attended Head Start, those that did not attend and were insured by Medicaid, and those that did not attend and were not insured by Medicaid. The study found that children who were obese entering the first school year in all 3 groups experienced declines in BMI z-score over the 2 years (see Figure 7). However, children that attended Head Start experienced greater declines in BMI z-score than both children that did not attend Head Start and were insured by Medicaid and those that did not attend and were not insured by Medicaid. This study indicates that simply providing children access to a structured program, even if the focus of the program is not weight maintenance, can have positive impacts on children’s body composition.
Figure 7.
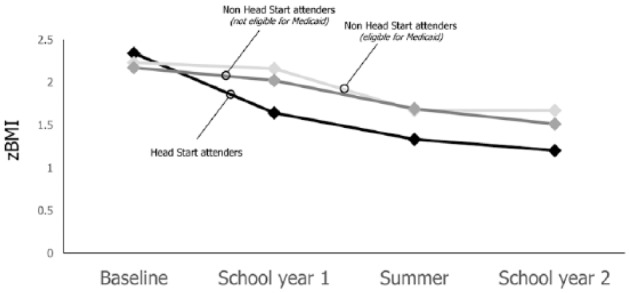
Changes in BMI z-scores in children that attended and did not attend Head Start (Source: Lumeng et al81).
While vouchers to attend structured programing over the summer may be a viable option for addressing accelerated unhealthy changes in body composition and fitness loss, research has also demonstrated that vouchers must conform to the needs of the targeted participants. Research has shown that vouchers to attend structured programming should cover the majority of, if not all, the cost of the program71,82 and the programs should be conveniently located for ease of access.83 Furthermore, programs must operate at times that meet the needs of the families and consistently operate throughout the year.84 If these criteria are not met, research has shown that families will not use vouchers and the potential benefits will not be achieved.83,84 These considerations may present particularly challenging barriers in communities in rural areas and in families with parents that work atypical (ie, third shift workers) or inconsistent hours.
Conclusion
The childhood obesity epidemic has grown unimpeded for over 3 decades, despite the public health field’s best efforts. Thus, an examination of the reasons for the obesity epidemic’s continued growth and the strategies targeting a reduction in obesity rates is warranted. Recent evidence suggests that the summer, not the school year where the majority of obesity prevention and treatment efforts have focused, is the time when unhealthy changes in body composition and fitness losses occur. The “Structured Days Hypothesis,” which posits that children engage in a greater number of unhealthy obesogenic behaviors on less structured days in comparison to structured days, offers a possible explanation for why this is occurring. Furthermore, summer may be contributing to a widening “health gap” between children from low-income and middle- to upper-income families. Thus, summer is a critical window for targeting unhealthy changes in body composition and fitness loss for children from low-income families. Preliminary evidence suggests that children benefit from attending structured programs even if the focus of those program is not improving weight maintenance or fitness. This is promising as many structured programs already exist in communities around the country but children from low-income families cannot access these programs because of cost. Thus, simply mitigating these cost barriers has the potential to affect children’s body composition and fitness.
Footnotes
Declaration of Conflicting Interests: The author(s) declared no potential conflicts of interest with respect to the research, authorship, and/or publication of this article.
Funding: The author(s) received no financial support for the research, authorship, and/or publication of this article.
Ethical Approval: Not applicable, because this article does not contain any studies with human or animal subjects.
Informed Consent: Not applicable, because this article does not contain any studies with human or animal subjects.
Trial Registration: Not applicable, because this article does not contain any clinical trials.
ORCID iD: R. Glenn Weaver  https://orcid.org/0000-0001-5889-974X
Michael W. Beets
https://orcid.org/0000-0001-6728-6742
References
- 1. Cote AT, Harris KC, Panagiotopoulos C, Sandor GG, Devlin AM. Childhood obesity and cardiovascular dysfunction. J Am Coll Cardiol. 2013;62:1309-1319. [DOI] [PubMed] [Google Scholar]
- 2. Bacha F, Gidding SS. Cardiac abnormalities in youth with obesity and type 2 diabetes. Curr Diab Rep. 2016;16:62. [DOI] [PubMed] [Google Scholar]
- 3. Mohanan S, Tapp H, McWilliams A, Dulin M. Obesity and asthma: pathophysiology and implications for diagnosis and management in primary care. Exp Biol Med (Maywood). 2014;239:1531-1540. [DOI] [PMC free article] [PubMed] [Google Scholar]
- 4. Narang I, Mathew JL. Childhood obesity and obstructive sleep apnea. J Nutr Metab. 2012;2012:134202. [DOI] [PMC free article] [PubMed] [Google Scholar]
- 5. Pollock NK. Childhood obesity, bone development, and cardiometabolic risk factors. Mol Cell Endocrinol. 2015;410:52-63. [DOI] [PMC free article] [PubMed] [Google Scholar]
- 6. Ogden CL, Carroll MD, Lawman HG, et al. Trends in obesity prevalence among children and adolescents in the United States, 1988-1994 through 2013-2014. JAMA. 2016;315:2292-2299. [DOI] [PMC free article] [PubMed] [Google Scholar]
- 7. Tomkinson GR, Olds TS. Secular Changes in Pediatric Aerobic Fitness Test Performance: The Global Picture. Basel, Switzerland: Karger; 2007. [DOI] [PubMed] [Google Scholar]
- 8. Janssen I, Leblanc AG. Systematic review of the health benefits of physical activity and fitness in school-aged children and youth. Int J Behav Nutr Phys Act. 2010;7:40. [DOI] [PMC free article] [PubMed] [Google Scholar]
- 9. Treviño RP, Fogt DL, Wyatt TJ, Leal-Vasquez L, Sosa E, Woods C. Diabetes risk, low fitness, and energy insufficiency levels among children from poor families. J Am Diet Assoc. 2008;108:1846-1853. [DOI] [PubMed] [Google Scholar]
- 10. Stevens J, Pratt C, Boyington J, et al. Multilevel interventions targeting obesity: research recommendations for vulnerable populations. Am J Prev Med. 2017;52:115-124. [DOI] [PMC free article] [PubMed] [Google Scholar]
- 11. Jin Y, Jones-Smith JC. Peer reviewed: associations between family income and children’s physical fitness and obesity in California, 2010-2012. Prev Chronic Dis. 2015;12:E17. doi: 10.5888/pcd12.140392. [DOI] [PMC free article] [PubMed] [Google Scholar]
- 12. Chaufan C, Davis M, Constantino S. The twin epidemics of poverty and diabetes: understanding diabetes disparities in a low-income Latino and immigrant neighborhood. J Community Health. 2011;36:1032-1043. [DOI] [PubMed] [Google Scholar]
- 13. Koplan JP, Liverman CT, Kraak VI; Committee on Prevention of Obesity in Children and Youth. Preventing childhood obesity: health in the balance: executive summary. J Am Diet Assoc. 2005;105:131-138. [DOI] [PubMed] [Google Scholar]
- 14. Bauer KW, Marcus MD, Larson N, Neumark-Sztainer D. Socioenvironmental, personal, and behavioral correlates of severe obesity among an ethnically/racially diverse sample of US adolescents. Child Obes. 2017;13:470-478. [DOI] [PMC free article] [PubMed] [Google Scholar]
- 15. Hall KD, Heymsfield SB, Kemnitz JW, Klein S, Schoeller DA, Speakman JR. Energy balance and its components: implications for body weight regulation. Am J Clin Nutr. 2012;95:989-994. [DOI] [PMC free article] [PubMed] [Google Scholar]
- 16. Economos CD, Hyatt RR, Must A, et al. Shape up Somerville two-year results: a community-based environmental change intervention sustains weight reduction in children. Prev Med. 2013;57:322-327. [DOI] [PubMed] [Google Scholar]
- 17. Williams JA, Zimmerman FJ, Bell JF. Norms and trends of sleep time among US children and adolescents. JAMA Pediatr. 2013;167:55-60. [DOI] [PMC free article] [PubMed] [Google Scholar]
- 18. Falbe J, Willett WC, Rosner B, Gortmaker SL, Sonneville KR, Field AE. Longitudinal relations of television, electronic games, and digital versatile discs with changes in diet in adolescents. Am J Clin Nutr. 2014;100:1173-1181. [DOI] [PMC free article] [PubMed] [Google Scholar]
- 19. Rich C, Griffiths LJ, Dezateux C. Seasonal variation in accelerometer-determined sedentary behaviour and physical activity in children: a review. Int J Behav Nutr Phys Act. 2012;9:49. [DOI] [PMC free article] [PubMed] [Google Scholar]
- 20. Pratt CA, Boyington J, Esposito L, et al. Childhood obesity prevention and treatment research (COPTR): interventions addressing multiple influences in childhood and adolescent obesity. Contemp Clin Trials. 2013;36:406-413. [DOI] [PMC free article] [PubMed] [Google Scholar]
- 21. Pratt CA, Loria CM, Arteaga SS, et al. A systematic review of obesity disparities research. Am J Prev Med. 2017;53:113-122. [DOI] [PubMed] [Google Scholar]
- 22. Frieden TR, Ethier K, Schuchat A. Improving the health of the United States with a “Winnable Battles” initiative. JAMA. 2017;317:903-904. [DOI] [PubMed] [Google Scholar]
- 23. Baranowski T, O’Connor T, Johnston C, et al. School year versus summer differences in child weight gain: a narrative review. Child Obes. 2014;10:18-24. [DOI] [PMC free article] [PubMed] [Google Scholar]
- 24. Moreno JP, Johnston CA, Woehler D. Changes in weight over the school year and summer vacation: results of a 5-year longitudinal study. J Sch Health. 2013;83:473-477. [DOI] [PubMed] [Google Scholar]
- 25. Sallis JF, McKenzie TL, Alcaraz JE, Kolody B, Faucette N, Hovell MF. The effects of a 2-year physical education program (SPARK) on physical activity and fitness in elementary school students. Sports, play and active recreation for kids. Am J Public Health. 1997;87:1328-1334. [DOI] [PMC free article] [PubMed] [Google Scholar]
- 26. von Hippel PT, Powell B, Downey DB, Rowland NJ. The effect of school on overweight in childhood: gain in body mass index during the school year and during summer vacation. Am J Public Health. 2007;97:696-702. [DOI] [PMC free article] [PubMed] [Google Scholar]
- 27. Gutin B, Yin Z, Johnson M, Barbeau P. Preliminary findings of the effect of a 3-year after-school physical activity intervention on fitness and body fat: the Medical College of Georgia Fitkid Project. Int J Pediatr Obes. 2008;3(suppl 1):3-9. [DOI] [PubMed] [Google Scholar]
- 28. Fu Y, Brusseau TA, Hannon JC, Burns RD. Effect of a 12-week summer break on school day physical activity and health-related fitness in low-income children from CSPAP schools. J Environ Public Health. 2017;2017:9760817. [DOI] [PMC free article] [PubMed] [Google Scholar]
- 29. von Hippel PT, Workman J. From kindergarten through second grade, US children’s obesity prevalence grows only during summer vacations. Obesity (Silver Spring). 2016;24:2296-2300. [DOI] [PubMed] [Google Scholar]
- 30. Chen TA, Baranowski T, Moreno JP, et al. Obesity status trajectory groups among elementary school children. BMC Public Health. 2016;16:526. [DOI] [PMC free article] [PubMed] [Google Scholar]
- 31. Park KS, Lee MG. Effects of summer school participation and psychosocial outcomes on changes in body composition and physical fitness during summer break. J Exerc Nutr Biochem. 2015;19:81-90. [DOI] [PMC free article] [PubMed] [Google Scholar]
- 32. McCue MC, Marlatt KL, Sirard J. Examination of changes in youth diet and physical activity over the summer vacation period. Internet J Allied Health Sciences Practice. 2013;11:8. [Google Scholar]
- 33. Rodriguez AX, Olvera N, Leung P, O’Connor DP, Smith DW. Association between the summer season and body fatness and aerobic fitness among Hispanic children. J Sch Health. 2014;84:233-238. [DOI] [PubMed] [Google Scholar]
- 34. Alexander KL, Entwisle DR, Olson LS. Lasting consequences of the summer learning gap. Am Soc Rev. 2007;72:167-180. [Google Scholar]
- 35. Downey DB, von Hippel PT, Broh BA. Are schools the great equalizer? Cognitive inequality during the summer months and the school year. Am Soc Rev. 2004;69:613-635. [Google Scholar]
- 36. Freedman DS; Centers for Disease Control and Prevention (CDC). Obesity—United States, 1988-2008. MMWR Suppl. 2011;60:73-77. [PubMed] [Google Scholar]
- 37. Franckle R, Adler R, Davison K. Accelerated weight gain among children during summer versus school year and related racial/ethnic disparities: a systematic review. Prev Chronic Dis. 2014;11:E101. [DOI] [PMC free article] [PubMed] [Google Scholar]
- 38. Brazendale K, Beets M, Weaver RG, et al. Understanding differences between summer vs. school obesogenic behaviors of children: the structured days hypothesis. Int J Behav Nutr Phys Act. 2017;14:100. [DOI] [PMC free article] [PubMed] [Google Scholar]
- 39. Caldwell LL, Smith EA. Leisure as a context for youth development and delinquency prevention. Aust N Z J Criminol. 2006;39:398-418. [Google Scholar]
- 40. Beck J, Chard CA, Hilzendegen C, Hill J, Stroebele-Benschop N. In-school versus out-of-school sedentary behavior patterns in US children. BMC Obes. 2016;3:34. [DOI] [PMC free article] [PubMed] [Google Scholar]
- 41. Atkin AJ, Sharp SJ, Harrison F, Brage S, van Sluijs E. Seasonal variation in children’s physical activity and sedentary time. Med Sci Sports Exerc. 2016;48:449-456. [DOI] [PMC free article] [PubMed] [Google Scholar]
- 42. Riddoch CJ, Mattocks C, Deere K, et al. Objective measurement of levels and patterns of physical activity. Arch Dis Child. 2007;92:963-969. [DOI] [PMC free article] [PubMed] [Google Scholar]
- 43. Comte M, Hobin E, Majumdar SR, Plotnikoff RC, Ball GD, McGavock J; MIPASS and Healthy Hearts Investigators Teams. Patterns of weekday and weekend physical activity in youth in 2 Canadian provinces. Appl Physiol Nutr Metab. 2013;38:115-119. [DOI] [PubMed] [Google Scholar]
- 44. Nyberg GA, Nordenfelt AM, Ekelund U, Marcus C. Physical activity patterns measured by accelerometry in 6-to 10-yr-old children. Med Sci Sports Exerc. 2009;41:1842-1848. [DOI] [PubMed] [Google Scholar]
- 45. Gilbey H, Gilbey M. The physical activity of Singapore primary school children as estimated by heart rate monitoring. Pediatr Exerc Sci. 1995;7:26-35. [Google Scholar]
- 46. Blader JC, Koplewicz HS, Abikoff H, Foley C. Sleep problems of elementary school children. A community survey. Arch Pediatr Adolesc Med. 1997;151:473-480. [DOI] [PubMed] [Google Scholar]
- 47. Snell EK, Adam EK, Duncan GJ. Sleep and the body mass index and overweight status of children and adolescents. Child Dev. 2007;78:309-323. [DOI] [PubMed] [Google Scholar]
- 48. Gulliford M, Price CE, Rona RJ, Chinn S. Sleep habits and height at ages 5 to 11. Arch Dis Child. 1990;65:119-122. [DOI] [PMC free article] [PubMed] [Google Scholar]
- 49. Matheson DM, Killen JD, Wang Y, Varady A, Robinson TN. Children’s food consumption during television viewing. Am J Clin Nutr. 2004;79:1088-1094. [DOI] [PubMed] [Google Scholar]
- 50. Baranowski T, Smith M, Hearn MD, et al. Patterns in children’s fruit and vegetable consumption by meal and day of the week. J Am Coll Nutr. 1997;16:216-223. [DOI] [PubMed] [Google Scholar]
- 51. Au LE, Rosen NJ, Fenton K, Hecht K, Ritchie LD. Eating school lunch is associated with higher diet quality among elementary school students. J Acad Nutr Diet. 2016;116:1817-1824. [DOI] [PubMed] [Google Scholar]
- 52. Hart CN, Raynor HA, Osterholt KM, Jelalian E, Wing RR. Eating and activity habits of overweight children on weekdays and weekends. Int J Pediatr Obes. 2011;6:467-472. [DOI] [PMC free article] [PubMed] [Google Scholar]
- 53. Cullen KW, Lara KM, de Moor C. Children’s dietary fat intake and fat practices vary by meal and day. J Am Diet Assoc. 2002;102:1773-1778. [DOI] [PubMed] [Google Scholar]
- 54. Hanson KL, Olson CM. School meals participation and weekday dietary quality were associated after controlling for weekend eating among US school children aged 6 to 17 years. J Nutr. 2013;143:714-721. [DOI] [PubMed] [Google Scholar]
- 55. Tanasescu M, Ferris AM, Himmelgreen DA, Rodriguez N, Pérez-Escamilla R. Biobehavioral factors are associated with obesity in Puerto Rican children. J Nutr. 2000;130:1734-1742. [DOI] [PubMed] [Google Scholar]
- 56. Bohnert A, Zarrett N, Beets MW, et al. Society of Behavioral Medicine (SBM) position statement: SBM supports curbing summertime weight gain among America’s youth. 2017;7:912-914. [DOI] [PMC free article] [PubMed] [Google Scholar]
- 57. Cooper H, Valentine JC, Charlton K, Melson A. The effects of modified school calendars on student achievement and on school and community attitudes. Rev Educ Res. 2003;73:1-52. [Google Scholar]
- 58. Cooper H, Nye B, Charlton K, Lindsay J, Greathouse S. The effects of summer vacation on achievement test scores: a narrative and meta-analytic review. Rev Educ Res. 1996;66:227-268. [Google Scholar]
- 59. Wu AD, Stone JE. Does year-round schooling affect the outcome and growth of California’s API scores? J Educ Res Policy Stud. 2010;10:79-97. [Google Scholar]
- 60. Skinner RR. Year-round schools: in brief. https://fas.org/sgp/crs/misc/R43588.pdf. Published June 9, 2014. Accessed February 25, 2017.
- 61. McGlynn A. Districts that school year-round. http://www.aasa.org/SchoolAdministratorArticle.aspx?id=10416. Accessed February 25, 2017.
- 62. US Department of Agriculture. Summer Food Service Program (SFSP): serving summer meals. https://www.fns.usda.gov/sfsp/serving-summer-meals. Accessed April 23, 2017.
- 63. Kenney EL, Lee RM, Brooks CJ, Cradock AL, Gortmaker SL. What do children eat in the summer? A direct observation of summer day camps that serve meals. J Acad Nutr Diet. 2017;117:1097-1103. [DOI] [PMC free article] [PubMed] [Google Scholar]
- 64. Weaver RG, Brazendale K, Chandler JL, et al. First year physical activity findings from turn up the HEAT (Healthy Eating and Activity Time) in summer day camps. PLoS One. 2017;12:e0173791. [DOI] [PMC free article] [PubMed] [Google Scholar]
- 65. Brazendale K, Beets MW, Weaver RG, et al. Children’s moderate-to-vigorous physical activity attending summer day camps. Am J Prev Med. 2017;53:78-84. [DOI] [PMC free article] [PubMed] [Google Scholar]
- 66. Barrett JL, Cradock AL, Gortmaker SL, Lee RM, Giles CM, Malsberger BA. Accelerometer assessment of children’s physical activity levels at summer camps. http://www.activelivingresearch.com/files/ALR2014_OralPresentationAbstracts.pdf. Accessed December 13, 2017.
- 67. Baker BL, McGregor A, Johnson LG, Taylor M. Summer day camp attendance facilitates some children meeting physical activity recommendations: differences by gender and weight status [published online April 12, 2017]. J Appl Biobehav Res. doi: 10.1111/jabr.12097. [DOI] [Google Scholar]
- 68. Weaver RG, Beets MW, Saunders RP, Beighle A. A coordinated comprehensive professional development training’s effect on summer day camp staff healthy eating and physical activity promoting behaviors. J Phys Act Health. 2014;11:1170-1178. [DOI] [PubMed] [Google Scholar]
- 69. Wilson C. 2016. Camp enrollment data: with strong enrollment comes new challenges. https://www.acacamps.org/sites/default/files/resource_library/2016Enrollment_summary_camper_enrollment.pdf. Accessed June 1, 2017.
- 70. Afterschool Alliance. America after 3 PM: a household survey on afterschool in America. https://www.acacamps.org/sites/default/files/resource_library/2016Enrollment_summary_camper_enrollment.pdf. Accessed December 13, 2017.
- 71. Bassani DG, Arora P, Wazny K, Gaffey MF, Lenters L, Bhutta ZA. Financial incentives and coverage of child health interventions: a systematic review and meta-analysis. BMC Public Health. 2013;13(suppl 3):S30. [DOI] [PMC free article] [PubMed] [Google Scholar]
- 72. Gopalan SS, Das A, Mutasa R. What makes health demand-side financing schemes work in low-and middle-income countries? A realist review. J Public Health Res. 2014;3:304. [DOI] [PMC free article] [PubMed] [Google Scholar]
- 73. Bajracharya A, Veasnakiry L, Rathavy T, Bellows B. Increasing uptake of long-acting reversible contraceptives in Cambodia through a voucher program: evidence from a difference-in-differences analysis. Glob Health Sci Pract. 2016; 4(suppl 2):S109-S121. [DOI] [PMC free article] [PubMed] [Google Scholar]
- 74. Bellows B, Bulaya C, Inambwae S, Lissner CL, Ali M, Bajracharya A. Family planning vouchers in low and middle income countries: a systematic review. Stud Fam Plann. 2016;47:357-370. [DOI] [PMC free article] [PubMed] [Google Scholar]
- 75. Eva G, Quinn A, Ngo TD. Vouchers for family planning and sexual and reproductive health services: a review of voucher programs involving Marie Stopes International among 11 Asian and African countries. Int J Gynaecol Obstet. 2015;130(suppl 3):E15E20. [DOI] [PubMed] [Google Scholar]
- 76. Gopalan SS, Mutasa R, Friedman J, Das A. Health sector demand-side financial incentives in low- and middle-income countries: a systematic review on demand- and supply-side effects. Soc Sci Med. 2014;100:72-83. [DOI] [PubMed] [Google Scholar]
- 77. Obare F, Warren C, Kanya L, Abuya T, Bellows B. Community-level effect of the reproductive health vouchers program on out-of-pocket spending on family planning and safe motherhood services in Kenya. BMC Health Serv Res. 2015;15:343. [DOI] [PMC free article] [PubMed] [Google Scholar]
- 78. Singleton CR, Baskin M, Levitan EB, Sen B, Affuso E, Affuso O. Farm-to-consumer retail outlet use, fruit and vegetable intake, and obesity status among WIC program participants in Alabama. Am J Health Behav. 2016;40:446-454. [DOI] [PMC free article] [PubMed] [Google Scholar]
- 79. Watt C, Abuya T, Warren CE, Obare F, Kanya L, Bellows B. Can reproductive health voucher programs improve quality of postnatal care? A quasi-experimental evaluation of Kenya’s safe motherhood voucher scheme. PLoS One. 2015;10:e0122828. [DOI] [PMC free article] [PubMed] [Google Scholar]
- 80. Zenk SN, Powell LM, Odoms-Young AM, et al. Impact of the revised Special Supplemental Nutrition Program for Women, Infants, and Children (WIC) food package policy on fruit and vegetable prices. J Acad Nutr Diet. 2014;114:288-296. [DOI] [PMC free article] [PubMed] [Google Scholar]
- 81. Lumeng JC, Kaciroti N, Sturza J, et al. Changes in body mass index associated with head start participation. Pediatrics. 2015;135:e449-e456. [DOI] [PMC free article] [PubMed] [Google Scholar]
- 82. Blau D. Child care subsidy programs. In: Moffit RA, ed. Means-Tested Transfer Programs in the United States. Chicago, IL: University of Chicago Press; 2003:443-516. [Google Scholar]
- 83. Dunton G, Ebin VJ, Efrat MW, Efrat R, Lane CJ, Plunkett S. The use of refundable tax credits to increase low-income children’s after-school physical activity level. J Phys Act Health. 2015;12:840-853. [DOI] [PMC free article] [PubMed] [Google Scholar]
- 84. Lowe ED, Weisner TS. ‘You have to push it—who’s gonna raise your kids?” Situating child care and child care subsidy use in the daily routines of lower income families. Child Youth Serv Rev. 2004;26:143-171. [Google Scholar]