Abstract
Objective
Contrast-enhanced cone-beam computed tomography (CBCT) imaging is commonly used for evaluating neurovascular stents and their relationship to the parent artery or vascular pathologies such as arteriovenous malformations (AVMs) and dural arteriovenous fistulas (dAVFs) in the context of surrounding anatomical structures. The purpose of this study was to understand the effects of varying concentrations of contrast medium used in CBCT imaging for optimal visualization of various endovascular devices and anatomical pathologies.
Methods
Thirty-five patients with various neurovascular pathologies were included in the study. Contrast-enhanced CBCT images (20 s DR, Siemens syngo DynaCT, Siemens AG, Forchheim, Germany) were acquired in all cases, with varying dilutions of contrast medium, from 1% to 30%. The injection rate was kept constant at 3 cc/sec with an X-ray delay of two sec, and a total volume of 66 cc of diluted contrast was administered. Results from visual and quantitative analysis were reported.
Results
Ten percent dilution of contrast medium resulted in the best image differentiation between flow-diverter devices and the parent artery. Concentrations as low as 2.5% contrast medium also resulted in identifying AVMs in the context of the surrounding brain parenchyma, whereas 20% to 30% dilution provided the best visualization of residual AVMs with prior Onyx embolization and dAVFs in the presence of bony structures.
Conclusions
Simultaneous visualization of brain parenchyma, bony structures, devices, and pathological anatomy using contrast-enhanced CBCT imaging is feasible with appropriate doses of iodinated contrast, and should be tailored to the individual case based on the goals of CBCT.
Keywords: Angiography, arteriovenous malformation, fistula, flow diverter, intervention
Introduction
Flat-panel, cone-beam computed tomography (CBCT) is widely used for imaging of neurovascular pathologies such as arteriovenous malformations (AVMs), and devices such as stents and flow diverters in the interventional suite.1–3 Typically, CBCT images are obtained by rotating the C-arm around the patient in a 200-degree arc, acquiring two-dimensional projection images at regular intervals throughout the circular trajectory and reconstructing a three-dimensional (3D) volume using a standard FDK algorithm. CBCT imaging provides an opportunity to acquire CT-like images in an interventional suite, thus providing the neurointerventional surgeon with valuable information during the procedure.4,5 Recent advancements in X-ray and C-arm technology have enabled greater imaging capabilities, with superior spatial resolution and better contrast enhancement to delineate anatomical structures of interest as well as intracranial devices.6,7,8
CBCT images can be acquired with or without contrast medium depending on the application. Noncontrast CBCT images of brain parenchyma are often acquired to analyze for untoward sequelae of neurointerventional procedures such as subdural hematoma,3 subarachnoid hemorrhage,2,9 or contrast extravasation into the brain.10
On the contrary, contrast-enhanced CBCT images play a key role in imaging devices in the interventional suite.11–16 It has been shown that contrast-enhanced CBCT acquired immediately after device deployment can assess stent apposition to the parent artery, allowing for potential corrective measures during the procedure.12 Further, studies have shown that contrast-enhanced CBCT can be used to detect and measure in-stent stenosis during follow-up imaging.14 However, the ability to simultaneously visualize both the device and its relationship to the parent artery depends both on contrast medium dilution and injection parameters used during CBCT acquisition.
In addition, contrast-enhanced CBCT images have become helpful in treatment planning of cerebral AVMs because of superior spatial resolution.17 Recently, the use of contrast-enhanced CBCT imaging has been described for intraoperative localization of cerebral AVMs using frameless stereotactic image guidance.18 Stereotactic radiosurgery is another option for treating AVMs that depends on accurate delineation of the target volume.19 Other centers have demonstrated that contrast-enhanced CBCT can be used for accurate treatment planning either solely or in conjunction with other imaging modalities such as computed tomography angiography or magnetic resonance angiography.20–22 Yet, the accuracy of AVM delineation in contrast-enhanced CBCT images depends on the grayscale value differentiation between the AVM and the surrounding brain parenchyma, which is a direct result of contrast medium dilution and injection parameters used during the acquisition.
Despite numerous advantages of contrast-enhanced CBCT imaging, acquiring optimal CBCT images is often challenging. It is important to determine the appropriate contrast medium dilution and the corresponding injection rate to facilitate simultaneous assessment of an AVM and surrounding brain tissue, or devices and their relationship to the parent arteries. Injection parameter recommendations in the literature seem to have been derived empirically, and little work has been devoted to quantify the effects of contrast medium concentration on the quality of CBCT for neurological applications.23,24 The purpose of this study was to study the effects of various concentrations of iodinated contrast medium that facilitates optimal visualization of structures of interest. We assessed the grayscale value differences between the pathological tissue, devices, and brain parenchyma at various concentrations of contrast medium, and present our preliminary clinical experience with these parameters in a variety of neurovascular diseases.
Materials and methods
Patient data
Contrast-enhanced CBCT images from 35 patients who presented with various neurovascular pathologies were retrospectively included in a database designed to look at this topic, and then retrospectively reviewed under an institutionally approved protocol. All images were deidentified under Health Insurance Portability and Accountability Act regulations for reviewing. As part of routine practice at our institution, contrast-enhanced CBCT images were obtained at varying concentrations depending on the pathology being examined. The patient population consisted of five aneurysm follow-up cases treated with a flow diverter (Pipeline Embolization Device (PED), Covidien, Minneapolis, MN), 22 patients with AVMs, five cases with dural arteriovenous fistulas (dAVFs), and three AVM cases previously treated with Onyx. Four of our AVMs and one of our dAVFs received supply from more than one vascular territory.
Imaging protocol
All examinations were performed in an angiographic suite equipped with a bi-plane C-arm system (Siemens Axiom Artis Zee bi-plane, Siemens AG, Forchheim, Germany). Full-head CBCT images were acquired using a 20 s DR acquisition program (syngo DynaCT Head 20 s protocol, Siemens Healthcare GmbH, Forchheim, Germany). The image acquisition protocol consisted of a 20-second rotation over 200-degree angular coverage, 0.4-degree angular increment; 1240 × 960 projection matrix; 496 projections; 30 frames per second; 1.2 µGy/frame system dose; 48 cm zoom, 70 Kv tube voltage, and automatic exposure control. These raw projection images were reconstructed on a 3D workstation equipped with an Intel Xeon Quad Core processor with an NVIDIA Quadro FX 5800 graphics card.
Injection protocol
After selective catheterization of the target vessel, iodinated contrast (iohexl, Omnipaque 300; GE Healthcare, Piscataway, NJ) mixed with saline in different proportions was administered at a rate of 3 cc/sec for a total volume of 66 cc using a power injector. The injection rate was fixed at 3 cc/sec for all patients based on recommendations from the scientific literature.9,25 CBCT acquisition was performed two seconds (X-ray delay) after the contrast injection started to ensure uniform opacification during the acquisition. Thus, dilute contrast medium was administered before and throughout the 20-second image acquisition, resulting in a total volume of 66 cc.
Various concentrations of contrast medium were administered in a variety of neurovascular pathologies, spanning a range of 1%–30%. Contrast medium concentration is defined as x% if x cc of contrast is mixed with 100-x cc of saline, such that both contrast and saline parts combined equal to 100 cc. For example, 5% concentration consists of 5 cc of contrast medium and 95 cc of saline. These varying concentrations were premixed in a bowl and then loaded into the injector. Rate rise was set to 0.5 seconds and the pressure was set to a maximum of 425 psi.
Variation of contrast medium concentration was driven by operator preference and clinical experience. Typically, a 20% diluted contrast medium is administered for obtaining CBCT images of neurovascular devices or pathologies at our institution. Since the goal was to minimize the contrast load to the patient, operators varied the concentration by decreasing the contrast dilution amounts in units of 5% variation. Hence, for imaging devices, we have collected datasets with contrast concentrations from 20%, 15%, 10%, and 5%. Having garnered initial experience on the effects of contrast variation on image appearance, operators preferred to increase the contrast concentration (20%, 25%, and 30%) for AVM with Onyx cases and further decrease the concentration (3%, 2.5%, 2%, and 1%) for AVM cases. The contrast concentration used for each case is summarized in Table 1.
Table 1.
Methods.
| Procedure type | % Contrast dilution | Number of datasets | Injection location |
|---|---|---|---|
| Flow diverter | 2%–3% | 3 | Cervical ICA |
| 5% | 2 | Cervical ICA | |
| 10% | 3 | Cervical ICA | |
| 15% | 1 | Cervical ICA | |
| AVM | 1%–3% | 5 | Cervical ICA |
| 5% | 2 | Cervical ICA | |
| 10% | 3 | Cervical ICA | |
| 15% | 1 | Cervical ICA | |
| Brainstem AVM | 2.5% | 2 | Cervical V2 |
| 5% | 2 | V2 | |
| 10%–15% | 3 | V2 | |
| AVM with Onyx | 10%–20% | 2 | V2 |
| 20% | 2 | Cervical ICA | |
| 30% | 1 | Cervical ICA | |
| dAVF | 2% | 1 | Proximal ECA |
| 5% | 1 | Proximal ECA | |
| 10%–15% | 3 | Proximal ECA | |
| 25% | 1 | IMAX from ECA |
AVM: arteriovenous malformation; dAVF: dural arteriovenous fistulas; ECA: external carotid artery; ICA: internal carotid artery; IMAX: internal maxillary artery.
Image analysis criteria
CBCT images reconstructed with various parameters were analyzed on a separate 3D workstation in multiplanar reformatted (MPR) views. All three MPR views, axial, coronal, and sagittal, were used to evaluate the brain parenchyma, stents, and neurovascular pathologies. CBCT images were reviewed by two experienced neurosurgeons following the procedure with appropriate window settings that allowed them to visualize the structures of interest. A unified window level (W) and window width (C) was determined using noncontrast images wherever available.
For visualizing flow-diverter devices, window parameters were adjusted by the operators in such a way that the individual device struts could be differentiated from each other (see Figure 1). These window values were applied to CBCT images computed from a small field-of-view reconstruction around the device using a Hounsfield unit (HU) sharp kernel.
Figure 1.
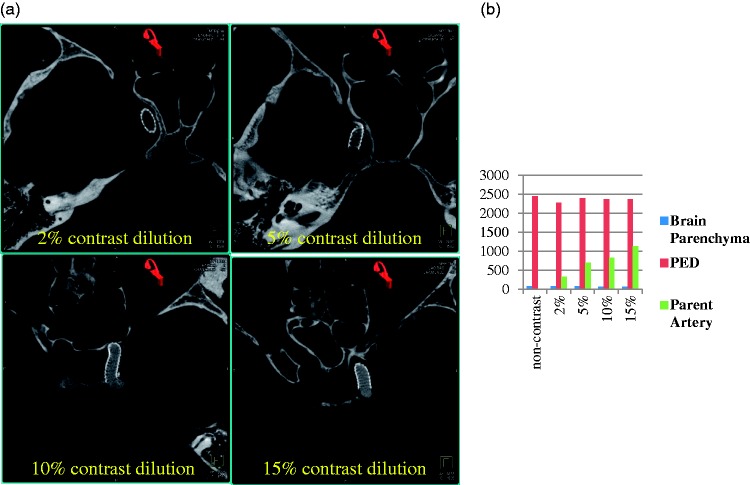
(a) Visualization of flow-diverter device using contrast-enhanced cone-beam computed tomography with varying contrast medium concentrations. (b) Plot of grayscale value characterization of flow-diverter device, parent artery, and the surrounding parenchyma. Both visual and quantitative analysis show that clear distinction of the parent artery and the flow-diverter device from the surrounding parenchyma can be achieved at 10% or higher dilutions.
Similarly, for visualizing AVM with brain parenchyma, full field-of-view CBCT images were reconstructed using HU normal kernel. Images were windowed by the operators to depict underlying brain structures such as gray and white matter, sulci, and ventricles so there is optimal differentiation between the AVM nidus and surrounding brain parenchyma. These window levels were recorded and a unified window level across the datasets with similar pathology was determined. CBCT images of AVM with Onyx were windowed to minimize streak artifacts from the embolizate. For visualizing dAVF located on dural venous sinuses, window parameters were adjusted to differentiate the dAVF from the adjacent calvarium.
Apart from the image window parameters, the operator’s comments on whether the images were deemed to be useful during the procedures were also noted for all datasets. A numeric score of 0 or 1 was assigned with 0 being suboptimal/not useful and 1 being satisfactory/useful. Having standardized the window parameters based on operator preference, region of interest (ROI) analysis was performed by placing ROIs in the calvarium, brain parenchyma, parent artery, flow-diverter device, AVM, and dAVF. Quantitative ROI analysis was performed by an imaging scientist to numerically correlate the operator’s comments to image appearance. An optimal ROI differentiation was noted as the setting at which the operators deemed images became useful for a given task.
Results
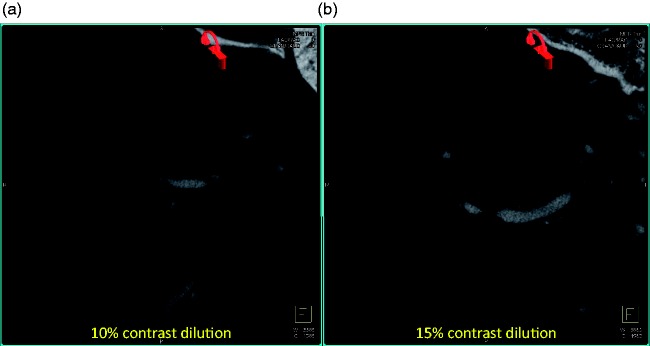
Satisfactory visualization of flow-diverter devices and their apposition to the parent artery was achieved in images acquired with 10% contrast concentration (see Figure 1). The optimal window values for visualizing PED were set to (W3880, C1580). These window values are on the higher end of the grayscale value spectrum because of the attenuation from the device itself. Concentrations of up to 5% mixing did not result in distinctive visualization of the parent artery from the background parenchyma. The relationship between the parent artery and the flow-diverter device was visually apparent in images acquired both with 10% and 15% concentrations (see Figure 2).
Figure 2.
Visualization of flow-diverter device using contrast-enhanced cone-beam computed tomography (CT) with varying contrast medium concentrations: (a) 10% contrast dilution and (b) 15% contrast dilution. Note the streaking artifacts starting to appear in cone-beam CT acquired with slightly higher contrast medium in (b) compared to (a). These slices are selected to show the streaking artifacts from higher concentrations of contrast and do not show the flow-diverter device.
ROI analysis in Figure 1(b) also showed that at low concentrations (≤5%), the grayscale values in the parent artery were close to the background brain tissue and hence the parent artery could not be differentiated. The grayscale values linearly increased with increasing contrast concentrations due to higher attenuation from the contrast column in the artery. At 15% concentration, however, streak artifacts from the contrast column were observed in the image (see Figures 1(c), 2(a) and 2(b)).
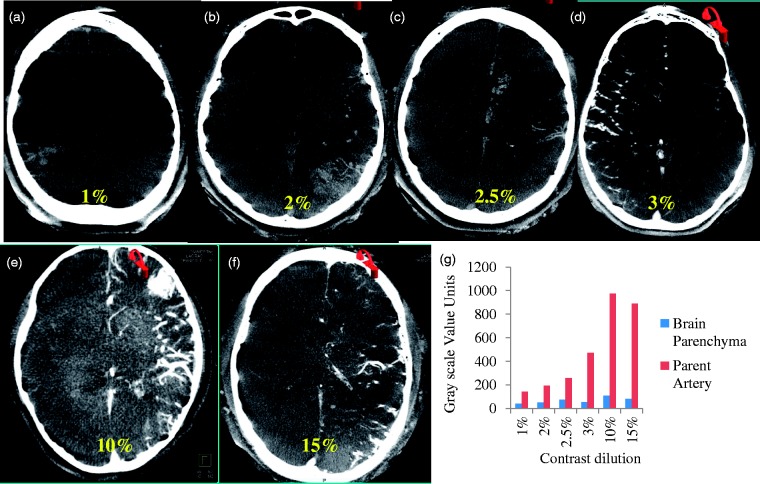
On the contrary, narrow window levels (W360, C184) and lower contrast concentrations (2% to 2.5%) resulted in better differentiation of the brain parenchyma while imaging AVMs with contrast injected from the internal carotid artery (ICA) (see Figure 3). All ICA injections are performed with the catheter placed in the midcervical ICA. A similar linear trend of increasing grayscale values with increasing contrast concentration is shown in Figure 3(g). Even at contrast medium concentrations as low as 3%, the contrast column was bright and the AVM structure was not readily visible in the context of the surrounding brain parenchyma.
Figure 3.
Visualization and quantification of arteriovenous malformation (AVM) and brain parenchyma simultaneously using contrast-enhanced cone-beam computed tomography. The contrast medium dilution was varied from 1% to 15%. A contrast dilution of 2.5% resulted in optimal windowing for simultaneous visualization of AVM and surrounding brain parenchyma.
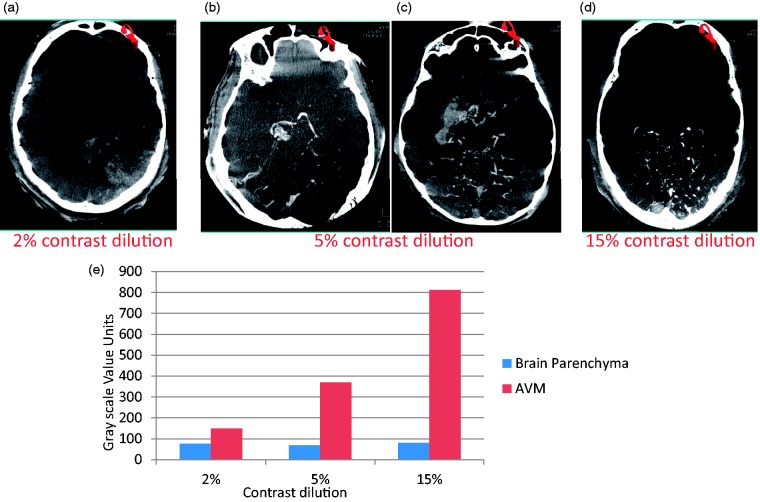
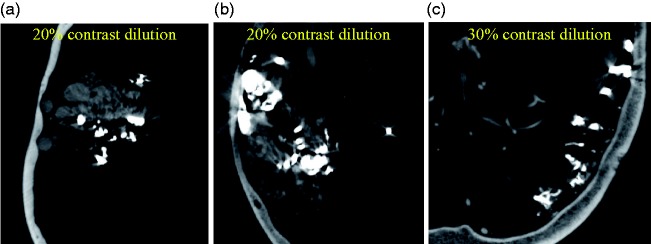
For AVMs supplied through a vertebral artery, a slightly higher concentration (5%) resulted in satisfactory simultaneous visualization of AVMs and the surrounding brain tissue (see Figure 4). CBCT images of AVMs with Onyx were imaged at 20% to 30% contrast concentration and windowed at the high end of the grayscale value spectrum (W3200, C1200) to filter out beam-hardening artifacts from the Onyx as shown in Figure 5(a).
Figure 4.
Visualization and quantification of arteriovenous malformation (AVM) and brain parenchyma simultaneously using contrast-enhanced cone-beam computed tomography. The contrast medium dilution was varied from 2% to 15%. The contrast medium was injected in the vertebral artery. A slightly higher concentration of contrast medium (5%) resulted in optimal visualization of AVM and brain parenchyma because of further dilution from another vertebral artery and bony skull base.
Figure 5.
Visualization of residual arteriovenous malformation (AVM) in patients treated with Onyx using contrast-enhanced cone-beam computed tomography. Higher concentrations resulted in better depiction of residual AVM in the presence of Onyx.
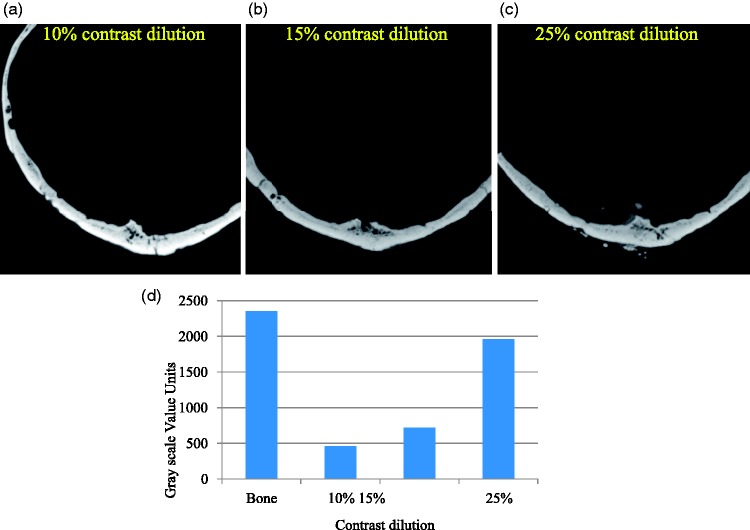
Figure 6(c) demonstrates that a higher concentration (25%) of contrast medium was necessary to visualize dAVFs in relation to adjacent bony structures.
Figure 6.
Visualization of dural arteriovenous fistula (dAVF) in the presence of bony anatomy. Higher concentration of contrast medium (c) is required to visualize the dAVF in the presence of bone.
Discussion
Contrast-enhanced CBCT images of neurovascular pathologies and devices provide invaluable information during and after interventional procedures. This study demonstrates that CBCT images can be acquired with lower doses of contrast medium than what is stated in the literature. Furthermore, concentration of contrast medium must be tailored to facilitate simultaneous visualization of neurovascular pathology and relevant anatomical structures.
Contrast medium concentration and injection rate are two major factors that have a direct impact on the quality of CBCT images. Recommended injection parameters found in the literature have been based on empirical findings and experience. For example, Patel et al.12 recommended 20% of iodinated contrast (Isovue, 250 mg/ml iodine concentration) mixed in 80% normal saline injected at a rate of 3.0 ml/s in the common carotid artery for imaging stents. Chintalapani and colleagues10 reported a 20% contrast (Iohexol, 200 mg/ml iodine concentration) mixed with 80% normal saline injected at a rate of 1 ml/s to image stents and flow-diverter devices. Kang et al.20 used 25% of iodinated contrast (300 mg/ml iodine concentration) mixed in 75% normal saline injected at a rate of 2 ml/s for imaging AVMs. Safain and colleagues21 reported acquisition of AVM CBCT images by injecting 20% of iodinated contrast (Isovue, 250 mg/ml iodine concentration) mixed with 80% normal saline at a rate of 1 ml/s.
Thus, the underlying hypothesis of our study was whether we can optimize diagnostic quality contrast-enhanced CBCT images by varying the contrast medium concentration and keeping the injection rate as a constant. Our study looked at various concentrations to image anatomical structures of interest and devices simultaneously, and showed that such imaging is possible with very low concentrations compared to the above recommendations from the literature and that the concentrations need to be tailored to the imaging task at hand.
Based on our experience, we have found that satisfactory imaging of flow-diverter devices can be achieved with 10% contrast (300 mg/ml iodine concentration) mixed with 90% normal saline at an injection rate of 3 ml/s. This results in a reasonably low utilization of undiluted contrast medium (6 ml) for the entire acquisition. However, the streak artifacts from the contrast column were apparent in the images with 15% concentration due to beam-hardening effect. We hypothesize that concentrations at or higher than 15% injected at 3 cc/sec will result in prominent streak artifacts. Although images can be windowed to suppress the streak artifacts, it may also deter the ability to infer device properties and wall apposition information. Concentrations lower than 10% may not be adequate to differentiate parent artery from background tissue, thus making it difficult to analyze device apposition.
Similarly, our study demonstrated that good contrast-enhanced CBCT images of AVMs can be acquired with concentrations around 2.5%. This number translates to 1.65 ml (2.5(amount of undiluted contrast medium loaded into the injector)*66(total volume injected during the acquisition)/100 (total volume loaded in the injector) = 1.65) of actual undiluted contrast medium administration, as compared to recommendations from the literature for volumes of 4.4 ml–11 ml. For imaging the posterior circulation, a slightly higher concentration of 5% dilution is required. This is attributed to further dilution from the nonopacified blood flow from the uninjected vertebral artery and attenuation from skull base bony anatomy.
For AVMs, the contrast concentration at the nidus may decrease as the number of arterial pedicles increases. As a result, the optimal contrast concentration for AVM visualization may increase as the number of supplying territory (anterior cerebral artery, middle cerebral artery, or posterior cerebral artery) increases.
X-ray attenuation is higher in the presence of dense objects such as coils, Onyx, or bony structures and thus we observed higher concentrations of contrast to image vascular anatomy surrounding these dense objects. In our study acceptable images were obtained with 20% to 30% contrast concentration (300 mg/ml iodine concentration). Visualization of residual AVM is highly dependent on the type and volume of embolic material already present in the AVM. The denser and larger the embolic load, the higher the concentration of contrast medium that is required. Similarly, bony structures have high attenuation and hence higher contrast concentrations are required for imaging dAVFs, which are generally located adjacent to bony structures. With increasing contrast medium concentration, the grayscale values in the artery were trending close to those in the bony structures, thus enabling simultaneous windowing of both structures of interest.
The ROI analysis presented in this paper, though limited, helped strengthen the observed trends. Grayscale values increased linearly with increased concentrations of contrast medium. In the absence of intracranial devices, a lower grayscale value differentiation was observed (approximately 1000 units in Figures 3(g) and 4(e)). In such instances, a very high concentration of contrast medium increases the attenuation and hence suppresses the background parenchyma. Hence, lower concentrations result in simultaneous delineation of vascular enhancement and surrounding anatomical structures.
Relatively larger grayscale value units were observed in the presence of intracranial devices such as the PED (approximately 2500 units in Figure 1(b)) or Onyx (approximately 20,000 units) because of increased attenuation from these radio-dense devices. In such instances, increasing the contrast medium concentration results in higher grayscale values for vasculature as well (10% for flow diverters and 25% for AVMs with Onyx as compared to 2.5% for untreated AVMs). Similar reasoning applies for analyzing small structures close to dense objects such as dAVFs presenting with tiny vasculature close to the skull anatomy.
Thus, achieving optimal contrast resolution and tissue characterization is very dependent on the patient-specific pathology. Given the nature of cone-beam CT reconstruction, grayscale value units vary from C-arm to C-arm, position to position and time to time, following a highly variable dynamic range that does not correspond to true HU numbers (CT numbers). Thus any such quantification should be restricted to deriving trends in data and cannot be utilized for absolute standardization.
The results presented in this paper were derived from using a specific type of contrast medium and fixed injection rate. Analyzing the implications of various contrast media and injection rates is beyond the scope of this paper and will require a statistically powered prospective study. With the experience gained from this study, we suggest that the injection parameters need to be adjusted appropriately with the type of contrast used and injection rate. Higher iodine concentration of contrast medium may need to be diluted further with higher injection rates and lower injection rates may need higher contrast medium concentration.
Furthermore, each patient and situation is different, as well as the imaging equipment. The opacification of the blood vessels and the parenchyma with contrast medium is also highly dependent on the catheter caliber and catheter location in the artery. Further work needs to be conducted to analyze the implications of all these parameters on image visualization and may require a statistically powered study with blinded image ratings from multiple observers.
In addition, differences in imaging systems and cone-beam CT reconstruction algorithms may also affect contrast concentration. However, we believe that the trends observed in this study can be broadly extended to a variety of C-arm imaging systems as the underlying physics of cone-beam CT reconstruction is grossly similar across various commercial platforms and that future generation imaging systems also have better imaging capabilities. Further large-scale studies are required to establish concrete guidelines on imaging various neurovascular pathologies using CBCT technology.
Conclusion
Our study demonstrates that simultaneous visualization of bony structures, brain parenchyma, devices, and pathological anatomy in contrast-enhanced CBCT images is feasible with varying doses of iodinated contrast and preferably lower doses in some instances. This study provides guidelines for baseline CBCT injection protocol and an analytical basis to further optimize the injection parameters for various neurovascular applications.
Declaration of conflicting interests
The authors declared the following potential conflicts of interest with respect to the research, authorship, and/or publication of this article: Dr Peter Kan serves as a consultant to Stryker and Medtronic, and Dr Gouthami Chintalapani is an employee of Siemens. The other authors have nothing to declare.
Funding
The authors received no financial support for the research, authorship, and/or publication of this article.
References
- 1.Akpek S, Brunner T, Benndorf G, et al. Three-dimensional imaging and cone beam volume CT in C-arm angiography with flat panel detector. Diagn Interv Radiol 2005; 11: 10–11. [PubMed] [Google Scholar]
- 2.Doerfler A, Glitz P, Engelhorn T, et al. Flat-panel computed tomography (DYNA-CT) in neuroradiology. From high-resolution imaging of implants to one-stop-shopping for acute stroke. Clin Neuroradiol 2015; 25: 291–297. [DOI] [PubMed] [Google Scholar]
- 3.Heran NS, Song JK, Namba K, et al. The utility of DynaCT in neuroendovascular procedures. AJNR Am J Neuroradiol 2006; 27: 330–333. [PMC free article] [PubMed] [Google Scholar]
- 4.Kamran M, Nagaraja S, Byrne JV. C-arm flat detector computed tomography: The technique and its applications in interventional neuro-radiology. Neuroradiology 2010; 52: 319–327. [DOI] [PubMed] [Google Scholar]
- 5.Orth RC, Wallace MJ, Kuo MD. C-arm cone-beam CT: General principles and technical considerations for use in interventional radiology. J Vasc Interv Radiol 2008; 19: 814–820. [DOI] [PubMed] [Google Scholar]
- 6.Ionescu M, Metcalfe RW, Cody D, et al. Spatial resolution limits of multislice computed tomography (MS-CT), C-arm-CT, and flat panel-CT (FP-CT) compared to MicroCT for visualization of a small metallic stent. Acad Radiol 2011; 18: 866–875. [DOI] [PubMed] [Google Scholar]
- 7.Psychogios MN, Buhk JH, Schramm P, et al. Feasibility of angiographic CT in peri-interventional diagnostic imaging: A comparative study with multidetector CT. AJNR Am J Neuroradiol 2010; 31: 1226–1231. [DOI] [PMC free article] [PubMed] [Google Scholar]
- 8.Doelken M, Struffert T, Richter G, et al. Flat-panel detector volumetric CT for visualization of subarachnoid hemorrhage and ventricles: Preliminary results compared to conventional CT. Neuroradiology 2008; 50: 517–523. [DOI] [PubMed] [Google Scholar]
- 9.Abe T, Hirohata M, Tanaka N, et al. Clinical benefits of rotational 3D angiography in endovascular treatment of ruptured cerebral aneurysm. AJNR Am J Neuroradiol 2002; 23: 686–688. [PMC free article] [PubMed] [Google Scholar]
- 10.Chintalapani G, Chinnadurai P, Maier A, et al. The added value of volume-of-interest C-arm CT imaging during endovascular treatment of intracranial aneurysms. AJNR Am J Neuroradiol 2016; 37: 660–666. [DOI] [PMC free article] [PubMed] [Google Scholar]
- 11.Benndorf G, Strother CM, Claus B, et al. Angiographic CT in cerebrovascular stenting. AJNR Am J Neuroradiol 2005; 26: 1813–1818. [PMC free article] [PubMed] [Google Scholar]
- 12.Patel NV, Gounis MJ, Wakhloo AK, et al. Contrast-enhanced angiographic cone-beam CT of cerebrovascular stents: Experimental optimization and clinical application. AJNR Am J Neuroradiol 2011; 23: 137–144. [DOI] [PMC free article] [PubMed] [Google Scholar]
- 13.Caroff J, Mihalea C, Neki H, et al. Role of C-arm VasoCT in the use of endovascular WEB flow disruption in intracranial aneurysm treatment. AJNR Am J Neuroradiol 2014; 35: 1353–1357. [DOI] [PMC free article] [PubMed] [Google Scholar]
- 14.Flood TF, van der Bom IM, Strittmatter L, et al. Quantitative analysis of high-resolution, contrast-enhanced, cone-beam CT for the detection of intracranial in-stent hyperplasia. J Neurointerv Surg 2015; 7: 118–125. [DOI] [PMC free article] [PubMed] [Google Scholar]
- 15.Jou LD, Chintalapani G, Mawad ME. Metal coverage ratio of pipeline embolization device for treatment of unruptured aneurysms: Reality check. Interv Neuroradiol 2016; 22: 42–48. [DOI] [PMC free article] [PubMed] [Google Scholar]
- 16.Kizilkilic O, Kocer N, Metaxas GE, et al. Utility of VasoCT in the treatment of intracranial aneurysm with flow-diverter stents. J Neurosurg 2012; 117: 45–49. [DOI] [PubMed] [Google Scholar]
- 17.Friedman WA. Stereotactic radiosurgery of intracranial arteriovenous malformations. Neurosurg Clin N Am 2013; 24: 561–574. [DOI] [PubMed] [Google Scholar]
- 18.Srinivasan VM, Schafer S, Ghali MG, et al. Cone-beam CT angiography (Dyna CT) for intraoperative localization of cerebral arteriovenous malformations. J Neurointerv Surg 2016; 8: 69–74. [DOI] [PubMed] [Google Scholar]
- 19.Rubin BA, Brunswick A, Riina H, et al. Advances in radiosurgery for arteriovenous malformations of the brain. Neurosurgery 2014; 74(Suppl 1): S50–S59. [DOI] [PubMed] [Google Scholar]
- 20.Kang J, Huang J, Gailloud P, et al. Planning evaluation of C-arm cone beam CT angiography for target delineation in stereotactic radiation surgery of brain arteriovenous malformations. Int J Radiat Oncol Biol Phys 2014; 90: 430–443. [DOI] [PMC free article] [PubMed] [Google Scholar]
- 21.Safain MG, Rahal JP, Raval A, et al. Use of cone-beam computed tomography angiography in planning for gamma knife radiosurgery for arteriovenous malformations: A case series and early report. Neurosurgery 2014; 74: 695–696. [DOI] [PMC free article] [PubMed] [Google Scholar]
- 22.Veeravagu A, Hansasuta A, Jiang B, et al. Volumetric analysis of intracranial arteriovenous malformations contoured for CyberKnife radiosurgery with 3-dimensional rotational angiography vs computed tomography/magnetic resonance imaging. Neurosurgery 2013; 73: 262–270. [DOI] [PubMed] [Google Scholar]
- 23.Gao Z, Zeng Y, Sun J, et al. Application of low injection rate and low contrast agent dose in three-dimensional rotational digital subtraction angiography of the intracranial aneurysm. Interv Neuroradiol 2016; 22: 287–293. [DOI] [PMC free article] [PubMed] [Google Scholar]
- 24.Jo KI, Kim SR, Choi JH, et al. Contrast-enhanced angiographic cone-beam computed tomography without pre-diluted contrast medium. Neuroradiology 2015; 51: 1121–1126. [DOI] [PubMed] [Google Scholar]
- 25.van Rooij WJ, Sprengers ME, de Gast AN, et al. 3D rotational angiography: The new gold standard in the detection of additional intracranial aneurysms. AJNR Am J Neuroradiol 2008; 29: 976–979. [DOI] [PMC free article] [PubMed] [Google Scholar]


