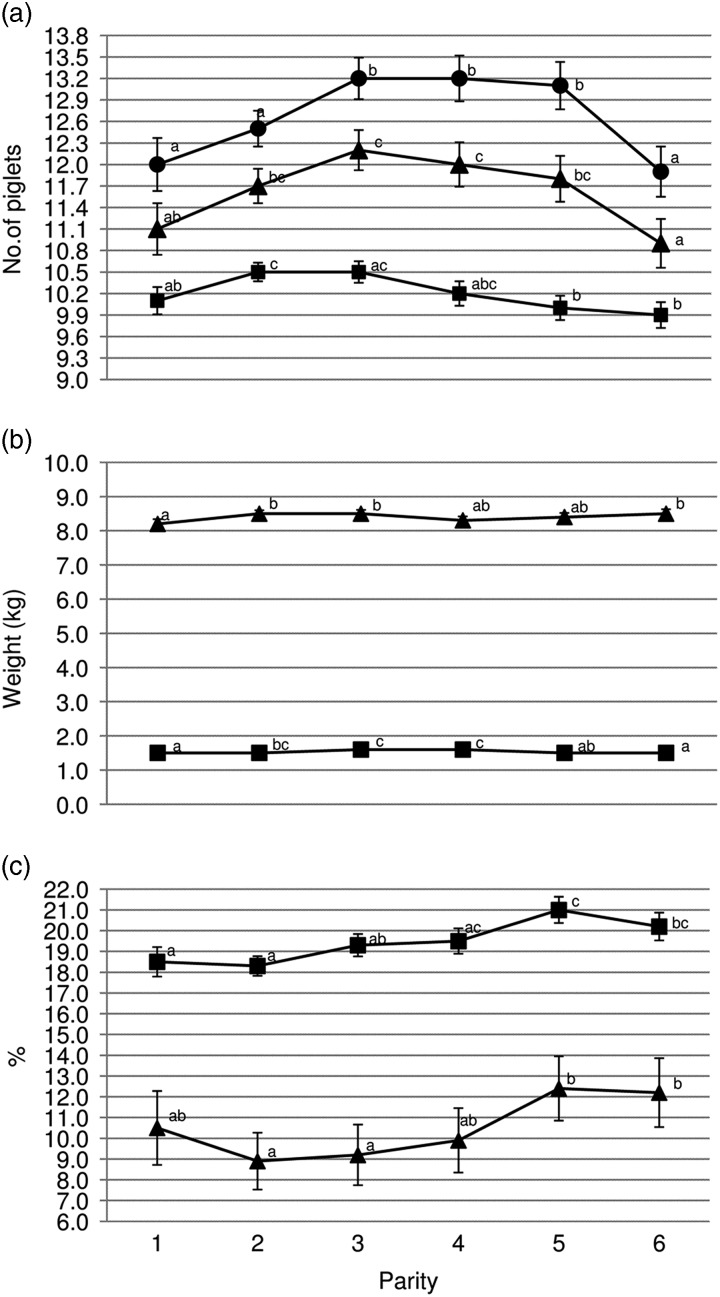
Figure 1.
Sow parity and associated (a) mean total born (●), born alive (▲) and number weaned (■); (b) mean piglet birth weight (■) and wean weight (▲); (c) within-litter variation in birth weight (■) and percentage pre-weaning mortality (▲). a,b,cValues within trait with different superscripts differ significantly from each other (P<0.05).

