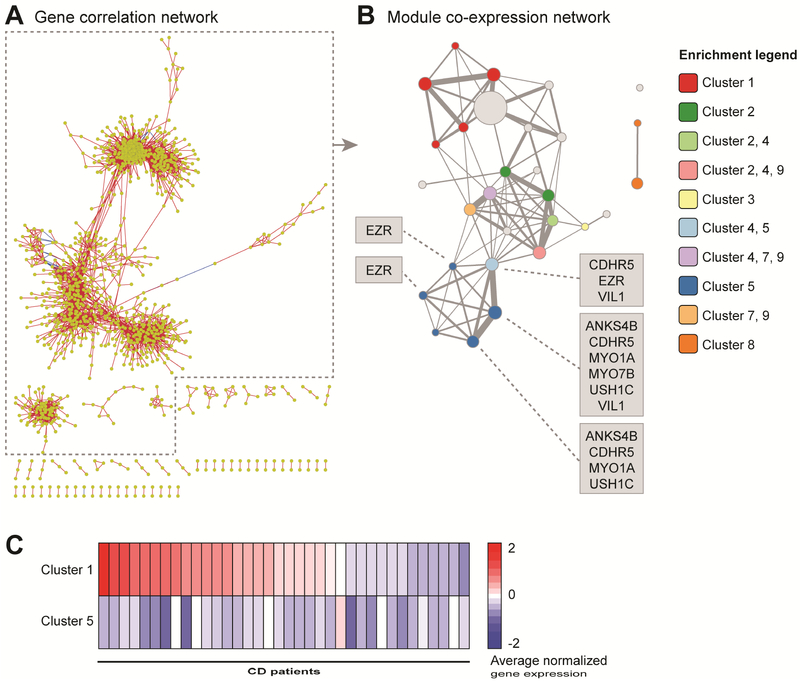
Figure 4. The common CD gene clusters are connected in a modular network.
(A) Visual organization of the gene correlation network with nodes representing genes and edges representing an absolute Spearman correlation of ≥0.75 between genes. (B) Visual organization of the co-expression module network with nodes representing modules and edges representing shared genes between modules. Node size and edge thickness are relative to the number of genes represented by each. The node color indicates significant enrichment by one-sided hypergeometric test for partitional cluster genes, as described in the legend. (C) Intensity plot of the average normalized gene expression values for partitional Cluster 1 and Cluster 5 in CD samples. The samples are arranged in the same order for each gene cluster according to their Cluster 1 rank.

