Abstract
Reliable assessment of image quality is an important but challenging task in complex imaging environments such as those encountered in vivo. To address this challenge, we propose a novel imaging metric, known as the lag-one coherence (LOC), which leverages the spatial coherence between nearest-neighbor array elements to provide a local measure of thermal and acoustic noise. In this paper, we derive the theory that relates LOC and the conventional image quality metrics of contrast and contrast-to-noise ratio (CNR) to channel noise. Simulation and phantom studies are performed to validate this theory and compare the variability of LOC to that of conventional metrics. We further evaluate the performance of LOC using matched measurements of contrast, CNR, and temporal correlation from in vivo liver images formed with varying mechanical index (MI) to assess the feasibility of adaptive acoustic output selection using LOC feedback. Simulation and phantom results reveal lower variability in LOC relative to contrast and CNR over a wide range of clinically-relevant noise levels. This improved stability is supported by in vivo measurements of LOC that show increased monotonicity with changes in MI compared to matched measurements of contrast and CNR (88.6% and 85.7% of acquisitions, respectively). The sensitivity of LOC to stationary acoustic noise is evidenced by positive correlations between LOC and contrast (r=0.74) and LOC and CNR (r=0.66) at high acoustic output levels in the absence of thermal noise. Results indicate that LOC provides repeatable characterization of patient-specific trends in image quality, demonstrating feasibility in the selection of acoustic output using LOC and its application for in vivo image quality assessment.
I. INTRODUCTION
MEASUREMENT of in vivo image quality is essential for the optimization of ultrasonic imaging parameters, beamforming methods, and sequence design. Traditionally, this is performed using measurements of contrast, contrast-to- noise ratio (CNR), and frame-to-frame or temporal correlation, which together capture information about the contrast and sensitivity of an imaging system [1]. Contrast and CNR assess the ability to distinguish differences between neighboring tissue regions by comparing speckle statistics between a hypo- or hyperechoic target and surrounding tissue, while temporal correlation provides a complementary measure of thermal noise level and penetration depth. Such metrics are commonly applied for the characterization of ultrasonic image quality and have been shown to correlate strongly with qualitative assessments by human observers under controlled phantom studies [2], [3].
Although widely used, existing metrics suffer from major drawbacks that limit their utility in vivo. Contrast and CNR require the identification of two regions of differing and, ideally uniform, backscatter amplitude. Consequently, these metrics are generally known to provide relative, rather than absolute, measures of image quality. They depend on native target contrast, which is unknown in most imaging scenarios and can vary significantly with small variations in acoustic window or imaging angle. Furthermore, the intrinsic variance of ultrasound speckle compromises these metrics and requires averaging over large regions-of-interest (ROIs) that can be difficult to obtain in heterogeneous targets or noisy imaging environments. Together, such factors contribute to variability in measurements of contrast and CNR that cannot be accounted for under realistic imaging conditions. Temporal correlation is sensitive to motion-induced decorrelation, which represents a major confounder in applications such as cardiac or flow imaging [4]–[6]. In addition, the utility of temporal correlation as a comprehensive metric for image quality is limited by its inability to discriminate between temporally- stable sources of acoustic clutter and echoes from tissue [7], [8].
Spatial coherence, which describes the similarity of backscattered ultrasound echoes as a function of their spatial separation or lag, is sensitive to all major forms of ultrasonic noise including phase aberration, reverberation clutter, off-axis scattering, and thermal noise. Focusing errors produce slow-varying decorrelations across the aperture [9]. Phase aberrations modulate the coherence function depending on the amplitude and frequency characteristics of the aberrator [10]. Thermal noise, which is uncorrelated across the array, introduces a delta function in the spatial coherence at zero lag that scales in amplitude based on the relative noise power [11]. As demonstrated by Pinton et al. [12], reverberation clutter, resulting from the superposition of multiply-scattered echoes, is well-approximated by spatially uncorrelated noise and results in rapid decorrelation in spatial coherence at very short lags, similar to the effect of thermal noise.
The sensitivity of spatial coherence to wavefront degradation has been leveraged in numerous applications. Short- lag spatial coherence (SLSC) [13] and coherent flow power Doppler (CFPD) [14] imaging use spatial coherence as a direct source of image contrast to suppress the appearance of acoustic clutter. Spatial coherence has also been used extensively in the context of aberration correction. Mallart and Fink [15] introduced a metric, termed the coherence factor by Hollman et al. [16], which uses the ratio of the coherent and incoherent sums of array signals as a criterion for focusing quality. Li and Li [17] extended this work to propose an adaptive imaging technique that uses the generalized coherence factor (GCF), measuring the ratio of spectral energy in a low frequency band to the total energy, to adaptively suppress image pixels arising from aberration and off-axis scattering. Similarly, Camacho et al. [18] developed the phase coherence factor (PCF), which measures the variance of backscatter phase across the aperture to reduce side and grating lobe energy. Other measurements, such as the wavefront similarity factor by Liu and Waag [19], have been used for characterizing changes in wavefront shape during iterative aberration correction.
In this paper, we investigate the application of spatial coherence as a direct measure of ultrasonic image quality using a novel metric termed the lag-one coherence (LOC). As its name implies, LOC is derived from the average spatial coherence between neighboring array elements and leverages the properties of spatial coherence to provide a local measure of image quality, representing the combined effects of temporally varying thermal noise and spatially incoherent acoustic noise. LOC seeks to address the limitations of existing metrics and provide a robust measure of image quality that is better suited for in vivo imaging.
This paper is organized as follows: Section II presents the theory relating spatial coherence to random additive noise and extends this theory to model the behavior of LOC, contrast, and CNR in varying levels of channel noise. Section III describes the experimental methods. In Section IV-A, we show that the derived theory can be used to relate measurements of LOC with contrast and CNR and compare the variability between LOC and conventional metrics in simulation. Sections IV-B to IV-E extend this analysis and compare measurements of LOC and conventional metrics obtained over a range of transmit voltage levels in phantom and in vivo liver to examine the sensitivity and stability of LOC under various imaging conditions. The clinical feasibility of adaptive acoustic output selection using LOC image quality feedback is assessed and discussed in Section IV-F.
II. THEORY
A. Spatial Coherence in Noise
In statistical optics, the van Cittert-Zernike (VCZ) theorem describes the spatial coherence of a wave field emanating from an incoherent source [20]. This theory was extended to pulse-echo ultrasound by Mallart and Fink [21], [22] who demonstrated that the spatial coherence of backscattered echoes from a diffuse, randomly scattering medium can be represented as the scaled Fourier transform of the transmit intensity profile or, equivalently, the autocorrelation of the transmit aperture function.
In the presence of additive uncorrelated channel noise, this theoretical description is modified to account for the incoherent contribution of noise. In this case, we can express the normalized spatial coherence between receive channels i and i + m with element separation or lag m as the correlation between Gaussian zero-mean complex echo signals Si and Si+m with zero-mean additive noise Ni and Ni+m:
| (1) |
where 〈 · 〉 denotes the expected value and * represents the complex conjugate.
Assuming that noise terms are uncorrelated and letting ψS represent the power of signals Si and Si+m and ψN represent the noise power for Ni and Ni+m, this equation can be rewritten as a function of the channel signal-to-noise ratio ψS/ψN (SNR) and the noise-free spatial coherence where
| (2) |
and
| (3) |
As shown above, the effect of spatially incoherent noise is to introduce a delta function in the coherence curve, which scales in magnitude based on the relative noise power. LOC, representing the coherence value at m = 1, measures the step decorrelation resulting from this delta function in order to characterize the level of spatially incoherent signal from both thermal noise and temporally stable sources of acoustic noise such as reverberation clutter and high frequency aberration [11], [12], [23].
Given Eq. (2) and Eq. (3), the analytic expression for LOC as a function of SNR can be readily derived for a uniform speckle target. By application of VCZ theory, for a rectangular transmit aperture can be modeled as a triangle function with
| (4) |
where M is the number of transmit elements. Fig. 1 depicts the theoretically predicted spatial coherence and LOC of speckle under varying levels of additive incoherent channel noise.
Fig. 1.
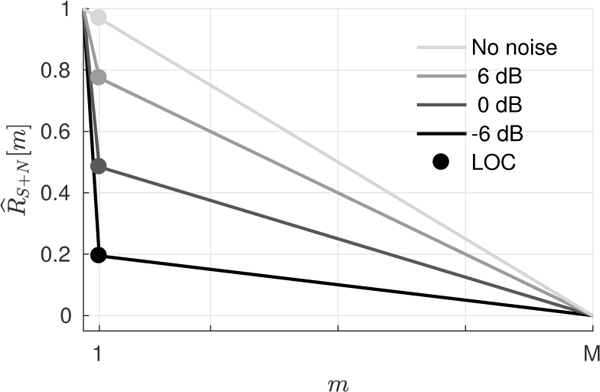
The theoretically predicted spatial coherence plotted as a function of lag m for a uniform speckle target and an M-element array at ∞, 6, 0, and −6 dB channel SNR. The spatial coherence is described as a weighted sum of a triangle function from partially correlated speckle signal and a delta function from incoherent channel noise. Changes in the relative magnitude of the delta function with channel noise are captured by LOC (circles), representing the spatial coherence at m = 1.
Note that for standard imaging arrays with M » 1, Eq. (4) can be approximated by the expected LOC for a perfectly coherent point target where
| (5) |
Hence, we can see that under these assumptions, LOC represents a non-linear scaling of channel SNR that ranges from 0 to 1 with increasing SNR. In this case, we can alternatively rearrange terms in Eq. (4) to estimate the channel SNR from measurements of LOC made in speckle:
| (6) |
B. Contrast and CNR in Noise
For these same assumptions, we can derive the theoretical expressions that relate the conventional metrics for contrast (C) and CNR to channel SNR where
| (7) |
and
| (8) |
μT and are the mean and variance of beamformed signal in a target region, and μB and are the corresponding values in a reference background region.
Contrast and CNR can be measured from either signal intensity or magnitude. The expected intensity of speckle follows a chi-squared distribution with mean and variance:
| (9) |
| (10) |
While the magnitude follows a Rayleigh distribution with
| (11) |
| (12) |
where the first-order statistics of both intensity and magnitude are defined solely in terms of the beamformed signal power Ψ [20], [24].
For a conventional delay-and-sum beamformer, we can model the beamformed signal as the sum of M channels, each composed of zero-mean complex Gaussian echo signal Si with additive white Gaussian noise Ni. Under these assumptions, the beamformed signal power ΨS + N is defined as
| (13) |
Given that signal Si and noise Ni are independent:
| (14) |
where and are the channel signal power and channel noise power, respectively, and is the noise-free spatial coherence evaluated at m = |i − j|. To simplify notation, we can rewrite this equation in terms of the receive beamformer gain G:
| (15) |
where G represents the ratio of the beamformed SNR (ΨS/ΨN) to the channel SNR :
| (16) |
In the case of speckle, the receive beamformer gain G is lower than that of a coherent target where
| (17) |
| (18) |
Given the expressions above, we can redefine Eqs. (7) and (8) with respect to the beamformed signal power ΨS+N for both target and background regions to model contrast and CNR as a function of channel SNR. For signal intensity [Eqs. (9) and (10)], the expression for contrast becomes
| (19) |
where noise is assumed to be constant between background and target regions. Defining the native contrast C0 as and channel SNR in the background region as :
| (20) |
Repeating this derivation for signal magnitude [Eqs. (11) and (12)]:
| (21) |
As expected, for , the estimated contrast approaches the native contrast value where and ; while for , both background and target are dominated by noise resulting in and .
It follows that Eq. (8) can be rearranged to model CNR in terms of the predicted contrast and a constant representing the μ/σ of speckle:
| (22) |
where and for based on intensity, and and = 1.91 for based on magnitude.
By setting G = Gspeckie, Eqs. (20) to (22) describe the behavior of contrast and CNR between uniformly scattering target and background regions under varying levels of random additive channel noise. In defining each metric with respect to channel SNR, these expressions in combination with Eqs. (4) and (6) provide a theoretical framework for relating LOC to conventional metrics of image quality.
C. Spatial Coherence Measurement
In practice, spatial coherence can be calculated by taking the average correlation between pairs of time-delayed channel signals si and si+m received at array elements with m-element separation
| (23) |
where M is the total number of array elements, m is the lag given in terms of element number, and n1 and n2 define the bounds of an axial kernel. As indicated by brackets 〈·〉, an additional ensemble average over estimates can be made over a region-of-interest (ROI) in a manner similar to the approach presented in [22]. LOC represents the output of this expression evaluated specifically at m = 1, where the number of individual correlation estimates is highest.
III. METHODS
A. Simulation
Field II simulations were performed to validate the theory presented in Section II as well as to characterize the performance of LOC relative to conventional image quality metrics [25], [26]. Simulations were conducted for a 128-element linear array with a 5 MHz center frequency, 80% bandwidth, and λ/2 pitch. A 4 cm focus was used on transmit and dynamic delays were applied on receive with rectangular apodization across the full aperture.
Five different layered phantoms were simulated with 3, 6, 12, 20, and 30 dB native contrast. Each was composed of randomly distributed scatterers spanning a 60 × 60 × 1 mm block with a scatterer density of 20 scatterers per resolution cell. Varying levels of intrinsic contrast were introduced by proportionally decreasing the echogenicities of scatterers located on one side of the phantom to produce two distinct vertically-oriented layers. Forty independent scatterer realizations were simulated for each phantom, resulting in a total of 200 simulations.
RF channel data were generated over 128 lines evenly spaced by the array pitch to provide a 2 cm lateral field- of-view (FOV) for each phantom. To simulate spatially incoherent thermal and acoustic noise, Gaussian white noise was filtered at the bandwidth of the transducer and added to receive channel signals. Noise power was scaled based on the channel signal power in the reference layer under noise-free conditions and equally applied across all channel signals for SNRs ranging from −30 to 30 dB.
Contrast and CNR were calculated from the envelope detected magnitude of images generated across all noise conditions and speckle realizations using equally-sized background and hypoechoic target ROIs located at identical depth and placed laterally adjacent to one another. Matched measurements of LOC were calculated using channel data from each background region used for corresponding measurements of contrast and CNR. Note that LOC measurements were performed over a single region and did not use the target ROIs.
The mean and variability of contrast, CNR, and LOC as a function of channel SNR were characterized using 15 × 15λ (4.6 × 4.6 mm) ROIs at the focal depth. Variability was quantified via the coefficient of variation (CV), representing the ratio of the standard deviation over the mean of measurements obtained across all 40 speckle realizations. This analysis was repeated for different ROI sizes to characterize the dependence of LOC on ROI size.
B. Phantom and Liver Experiments
As a demonstration of clinical feasibility, phantom and in vivo acquisitions were performed to assess the ability for LOC to characterize patient-specific harmonic image quality with changes in acoustic output. Phantom and in vivo liver datasets were acquired using a Vantage 256 Verasonics research scanner (Verasonics, Redmond, WA). Pulse inversion harmonic imaging was performed using the C5–2v curvilinear array transmitting at 2.4 MHz and receiving at 4.8 MHz with a 6 cm focal depth and F/2 focal geometry.
To study changes in image quality with acoustic output, custom sequences were designed to capture interleaved B- mode and M-mode channel data across 34 different transmit voltages at 20 Hz, resulting in a total acquisition time of 1.7 seconds. B-mode channel data were acquired over 70 lines spanning a 20° sector. Interleaved M-mode data, consisting of five repeated ensemble firings, were collected at three lateral locations within the span of the B-mode sector at a 2 kHz pulse repetition frequency (PRF). Interleaved B- and M- mode channel data were stored for all acquisitions for offline processing.
Phantom experiments were performed on a tissue mimicking phantom (Model 549, ATS Laboratories Inc., Bridgeport, CT). Variable acoustic output data were obtained for views containing a series of 1-cm diameter cylindrical lesion targets of varying native contrast (3, 6, and 15 dB). Independent acquisitions were performed by translating the probe in elevation over 10 separate acoustic windows, each containing a new realization of speckle.
Using the same acquisition sequence, in vivo data were collected from liver and hepatic vasculature in 11 volunteers of varying body habitus. Variable acoustic output data were acquired at a number of different imaging windows in each volunteer with the sonographer attempting to maximize the contrast of hepatic vessels in each acquisition. Written consent was obtained from all study participants and the study protocol was approved by the Investigational Review Board at Duke University.
C. Acoustic Output Measurement
The 34 transmit voltage levels used in this study were calibrated to measurements of mechanical index (MI). MI describes the risk of non-thermal bioeffects in diagnostic ultrasound and is defined as the derated peak rarefactional pressure divided by the square root of transmitted center frequency. Pressure waveforms were obtained for each transmit voltage condition in a water tank using a high precision 3-D translation stage (Newport, Irvine, CA, USA) and a calibrated membrane hydrophone (polyvinylidene fluoride with a 0.5-mm spot size, Acertara Acoustics Labs, Longmont, CO, USA). Measured MI values for the sequence in this study span from 0.06 to 1.51 and include standard clinical output levels below the FDA limit (MI < 1.9).
D. Phantom and Liver Data Processing
To characterize the behavior of different image quality metrics with changes in MI, measurements of contrast, CNR, and LOC were obtained from all phantom and liver acquisitions (each containing data from 34 transmit voltages sampled over 1.7 seconds). Target ROIs were defined within cylindrical targets in the phantom and blood vessels in the liver. Corresponding background ROIs were selected in areas of uniform speckle directly adjacent to and at the same depth as target ROIs. Background and target regions were kept as similar in size as possible and selected in areas within roughly 2 cm of the focus to isolate the effects of acoustic output and minimize the influence of transmit focusing. Each ROI was manually traced from the frame acquired halfway through each acquisition to minimize misregistration due to physiological and transducer motion.
Contrast and CNR were measured from the envelope detected magnitude of each image using pairs of background and target ROIs, while corresponding measurements of spatial coherence and LOC were computed from only background regions. To reduce the impact of element directivity, calculations for spatial coherence and LOC were restricted to the active aperture used for image formation. In this way, all measurements of contrast, CNR, and spatial coherence were extracted from the same channel data. In background regions containing M-mode ensemble data, temporal correlation was also measured by taking the normalized cross-correlation between consecutively fired M-mode lines using a 5λ kernel. Correlation values were averaged over the ensemble of M- mode firings and across the spatial extent of each ROI. Measurements of each metric were obtained from three separate locations in each liver acquisition. Given the limited number of identifiable vessels in each image, metrics were calculated using unique background ROIs referenced to a common target region.
Measurements of LOC as a function of acoustic output were characterized and compared to corresponding curves obtained from matched measurements of contrast, CNR, and temporal correlation. To capture the behavior of each metric with changes in acoustic output, metrics from each acquisition were fit to asymmetric logistic functions following the five- parameter model presented in [27]. From each logistic fit, the image quality asymptote was extracted, and specifically for LOC, the MI at 98% of this asymptote was also extracted. The former represents the maximum achievable image quality, and the latter approximates the minimum MI needed to maintain optimal image quality. For the purposes of this study, these values provide an effective description of the ALARA output conditions, which optimize diagnostic information while limiting ultrasound exposure to “as low as reasonably achievable.”
To evaluate the monotonicity of each metric with changes in MI, Spearman’s rank correlation rs was calculated between image quality measurements and acoustic output levels [28]. A higher rs, indicating increased monotonicity, suggests a more stable metric with less noise between measurements obtained at different output levels. Note that a linear relationship between metric values and MI is not required for rs = 1. Comparisons of rs between contrast, CNR, and LOC measurements were performed after Fisher’s z-transformation to normalize the sample distribution of rs values [29].
IV. RESULTS AND DISCUSSION
A. Simulation
B-mode images of the simulated layer phantoms are presented in Fig. 2 with 15 × 15λ boxes indicating the ROIs used for metric calculation. LOC was calculated from background regions (solid box), while contrast and CNR were necessarily computed using both background and target ROIs. Increased channel noise, as indicated by lower channel SNR, results in degraded image quality and decreased conspicuity of individual layers. Unsurprisingly, for a given channel SNR, the apparent contrast between layers varies significantly as a function of native contrast.
Fig. 2.
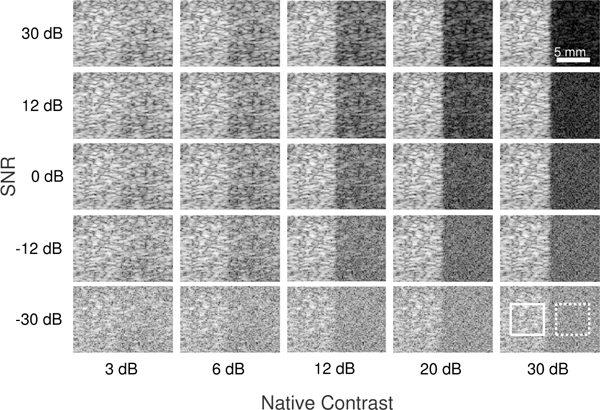
B-mode images of the layer phantoms simulated in Field II with varying levels of native contrast and channel SNR arranged in columns and rows, respectively. Locations of the background (solid) and target (dotted) regions used for metric calculation are indicated by 15 × 15λ boxes. All images are centered about the 4 cm focal depth and shown on a 45 dB dynamic range.
Fig. 3 shows measurements of contrast and CNR plotted as a function of the measured LOC across varying levels of channel noise. Results demonstrate strong agreement between theoretically predicted values for contrast, CNR, and LOC [Eqs. (4), (21) and (22)] with measurements made in simulation. LOC is positively correlated with contrast, and the two metrics exhibit an increasingly linear relationship for higher levels of native contrast. Likewise, LOC and CNR are positively correlated, but show a weaker linear dependence in comparison.
Fig. 3.
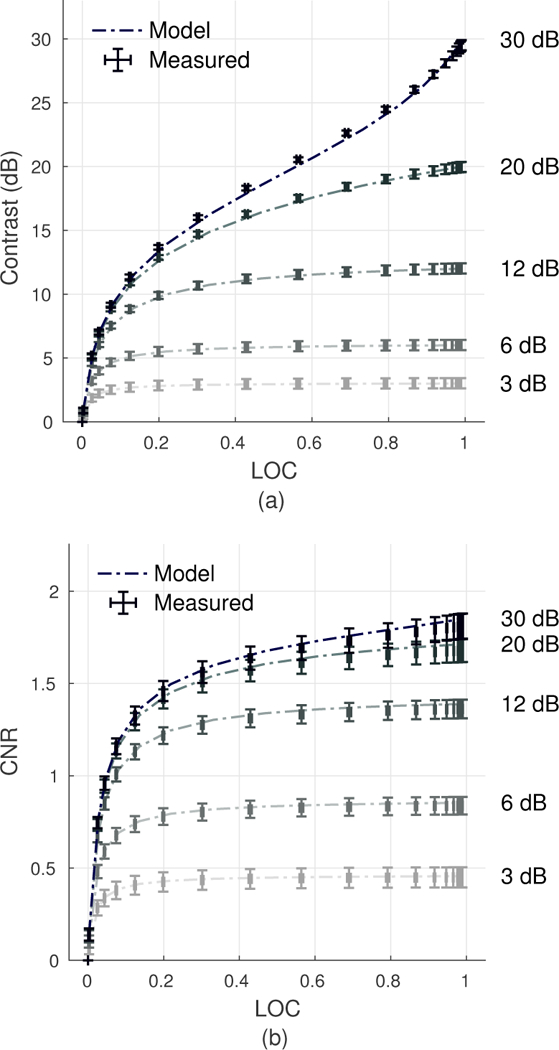
Relationship between contrast and LOC (a) and CNR and LOC (b) as predicted by theory and measured in simulation across varying levels of channel SNR and for targets with 3, 6, 12, 20, and 30 dB native contrast. Error bars along both axes represent the standard deviation across measurements made over 40 speckle realizations. Model and simulation results are in close agreement.
The mean and variability of each metric over 40 independent speckle realizations using 15 × 15λ ROIs are plotted as a function of channel SNR in Fig. 4. The influence of native contrast is reflected in the mean values for both contrast and CNR in Figs. 4a to 4c, which show large differences across the five phantoms. In the context of image quality optimization, results suggest that optimal imaging criteria, as defined by contrast and CNR, can vary significantly depending on native contrast. As shown in Fig. 4a, high contrast targets require greater increases in SNR to approach their maximum contrast and CNR values. For a 3 dB target, contrast reaches 98% of its maximum value at an SNR of roughly −2 dB, whereas this occurs closer to 11.5 dB in the 20 dB target. Conversely, LOC provides a local measure of channel noise derived from a single ROI. Overlapping curves in Fig. 4c demonstrate consistent behavior of LOC, indicating a fixed response to SNR across all five phantoms.
Fig. 4.
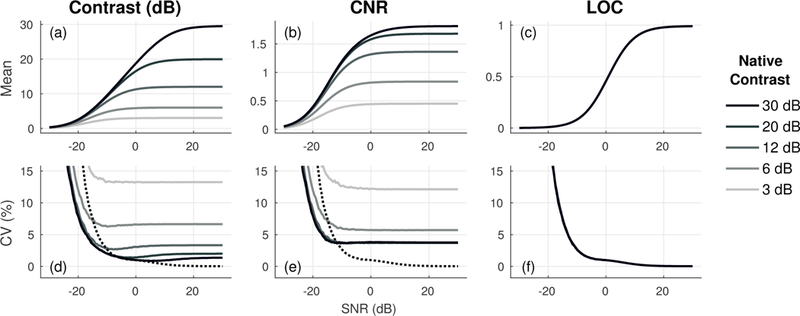
Mean (a-c) and variability (d-f) of contrast, CNR, and LOC measured using 15 × 15λ ROIs across 40 independent speckle realizations. As reference, the variability of LOC (dotted line) is displayed on corresponding plots for contrast and CNR. LOC eliminates dependence on native contrast and has lower variability over a range of channel SNRs. Note that measurements for LOC from all 5 phantoms (3, 6, 12, 20, and 30 dB) are shown in c and f but are entirely overlapping.
Figs. 4d to 4f show the variability of contrast, CNR, and LOC measurements across independent speckle realizations. Consistent with the decreased texture noise in measurements of spatial coherence relative to B-mode speckle [13], results show lower variability in LOC relative to contrast and CNR for a wide range of clinically-relevant channel SNRs, which for the harmonic abdominal imaging conditions in this study were shown to be on the order of −13 to 14 dB [Section IV-F]. Improvements in stability with LOC are observed across all simulated phantoms, but become less apparent as the mean values for contrast and CNR increase with increasing native contrast. Interestingly, the variability of LOC increases above that of contrast and CNR for SNRs below roughly −10 dB. The degraded performance at high noise levels can be linked to the effective decrease in noise power after channel summation. While contrast and CNR are measured from beamformed image data and benefit from the improvement in SNR due to channel summation [Eq. (16)], measurements of LOC are derived from single channel signals and correspondingly show greater sensitivity and more rapid decorrelation to zero under noisy imaging conditions.
Fig. 5 compares the variability of different metrics calculated using ROI sizes ranging from 5 × 0λ (5λ axial kernel) to 15 × 15λ across all 40 speckle realizations. Results are shown for a 20 dB layer with −10, 0, and 10 dB channel SNR. The proportional increase in the variability of LOC relative to the variability of contrast measured with a 15 × 15λ background and target ROI is listed above each bar. These values compare the performance of LOC under various ROI conditions against standard contrast measurements made using sufficiently large ROIs of fixed size. Note that measurements in Fig. 5 reflect values of LOC obtained using a single ROI compared to contrast and CNR measurements obtained using both a background and target ROI (i.e. twice the spatial extent).
Fig. 5.
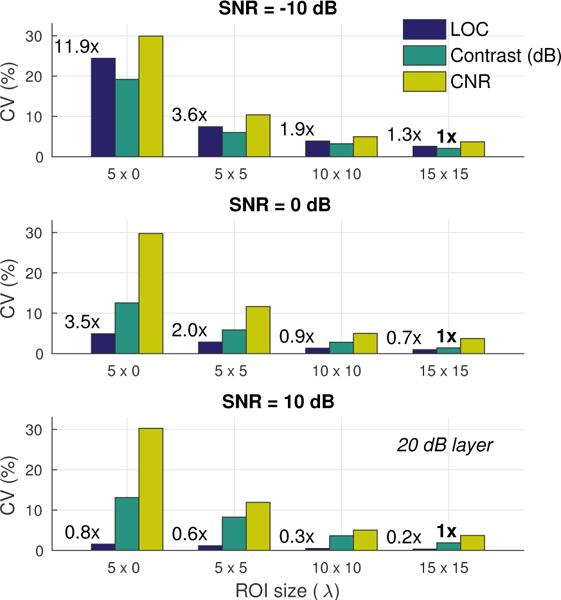
Variability across measurements of contrast, CNR, and LOC made using ROIs with sizes ranging from 5 × 0λ (axial kernel over a single beam) to 15 × 15λ for a 20 dB layer with −10, 0, and 10 dB channel SNR. Lower values signify improved measurement stability across the 40 speckle realizations. Relative to conventional metrics, LOC measurements maintain low variability (i.e. improved stability) with small ROI sizes at moderate to high channel SNRs.
In general, LOC is observed to have lower variability compared to matched measurements of contrast and CNR, and it is most stable at moderate to high channel SNRs, where 5λ kernel estimates of LOC show lower variability than 15 × 15λ measurements of contrast. At 0 dB SNR, this same criteria is met using 10 × 10λ (roughly 56% smaller) measurements of LOC. Consistent with Figs. 4d to 4f, the improvements in stability observed with LOC become less apparent at lower SNRs. At −10 dB SNR, the variability of LOC exceeds that of contrast, but still shows slight improvements over the variability in CNR.
These results indicate that LOC can be reliably measured over small ROIs under low to moderate levels of channel noise. The improved stability of LOC over conventional metrics affords greater flexibility under realistic imaging conditions where heterogeneous and complex anatomy can significantly limit the regions over which viable measurements can be taken. Note that the results in Fig. 5 are presented for a 20 dB layer. Greater improvements in stability can be expected for targets with lower native contrast where the variabilities in both contrast and CNR are higher [Figs. 4d to 4f].
B. Phantom Measurements
Experimental data were acquired to compare the performance of LOC and conventional metrics in measuring changes in image quality with varying MI. Fig. 6 shows harmonic B-mode images of phantom targets with 3, 6, and 15 dB native contrast acquired at MIs ranging from to 0.14 to 1.19. The conspicuity of all three targets improves at higher MIs, consistent with the expected increase in SNR with increases in acoustic output. As observed in Fig. 6, these improvements become no longer visible above a certain MI. This threshold represents the minimum acoustic output level that optimizes image quality, i.e. the ALARA output condition.
Fig. 6.
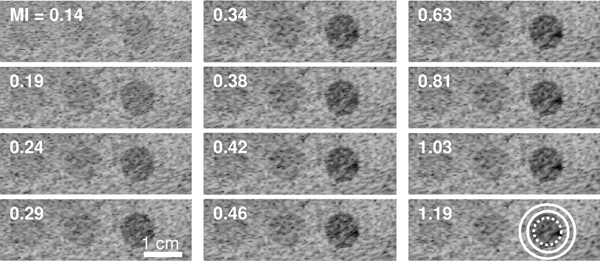
Harmonic B-mode images of the phantom lesion targets (3, 6, and 15 dB native contrast going from left to right) acquired at varying MIs. Circles indicate the placement of target (dashed) and background (solid) regions used for computing image quality metrics. All images are shown on a 60 dB dynamic range.
Phantom and in vivo studies extend the analysis of LOC to harmonic imaging using a curved array. Under these conditions, the noise-free spatial coherence deviates from the triangle function predicted by VCZ theory. Nonlinear propagation and element directivity introduce systematic differences in the harmonic echo coherence function that can be described as an effective apodization of the transmit aperture [22]. Despite differences between the assumed and true harmonic spatial coherence function, phantom measurements presented in Figs. 7a and 7b indicate that analytic expressions [Eqs. (6), (21) and (22)] derived under the assumption of a triangular coherence function provide a reasonable approximation for harmonic LOC, contrast, and CNR.
Fig. 7.
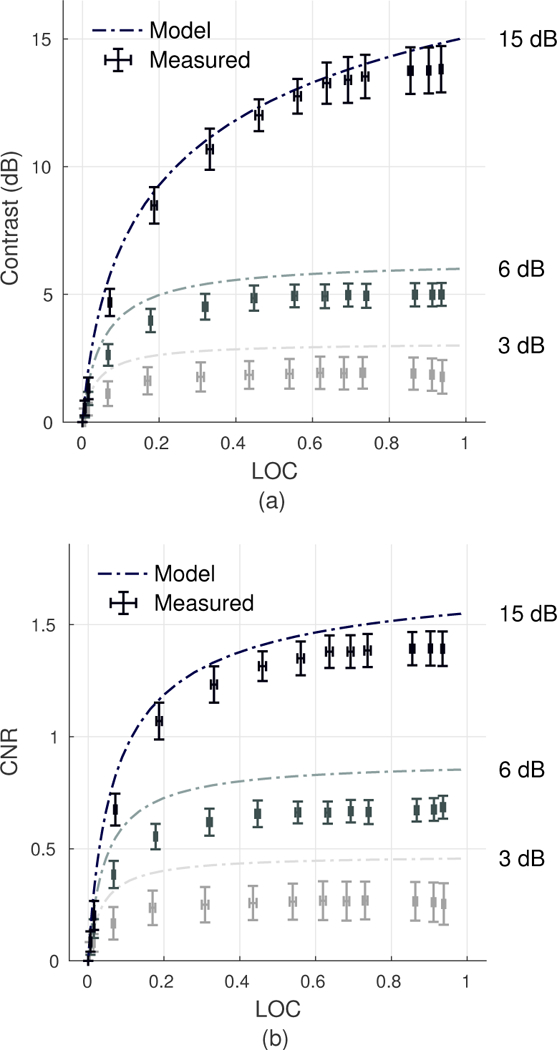
Relationship between contrast and LOC (a) and CNR and LOC (b) as predicted by theory and measured in the phantom across varying transmit voltage levels and for 3, 6, and 15 dB contrast targets. Error bars along both axes represent the standard deviation between measurements obtained from 10 different elevational slices. Model results provide an approximation of the relationship between LOC and conventional metrics under varying output conditions in harmonic imaging.
Figs. 8a to 8c plot contrast, CNR, and LOC as a function of MI for measurements obtained from 10 different elevational slices in the phantom. Metrics were calculated using 1-cm diameter target regions referenced to annulus background regions of approximately equal area around each target. Compared to contrast and CNR, LOC demonstrates improved repeatability across different speckle realizations as well as increased monotonicity with changes in output level. Note that LOC measurements from the background regions of all three cylindrical targets are entirely overlapping. This is reflected in the measured variability across all 10 acoustic windows, which is shown in Figs. 8d to 8f as a function of MI and for each target. Consistent with simulation results, measurements of LOC in the phantom show lower variability across all output levels, most notably so for targets with lower native contrast.
Fig. 8.
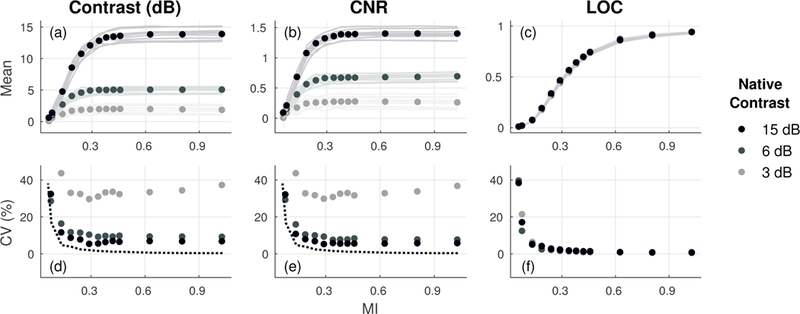
Contrast, CNR, and LOC as a function of MI measured from 10 independent acquisitions (a-c) and the corresponding variability between repeat measurements (d-f) for 3, 6, and 15 dB cylindrical phantom targets. As reference, the variability of LOC measured from background regions used for the 15 dB target (dotted line) is displayed on corresponding plots for contrast and CNR. LOC shows improved monotonicity and lower variability compared to matched measurements of contrast and CNR. Note that measurements for LOC from all 3 targets are shown in c and f but are entirely overlapping.
C. In Vivo Liver Measurements
Fig. 9 shows the spatial coherence curves measured from background speckle regions over a range of MI values for the phantom (Ph) and ROIs in the livers of 11 subjects (S). In general, the results are consistent with the expected delta function decorrelation describing spatially incoherent thermal and acoustic noise. At high output levels, the phantom as well as subjects S1 and S2 have coherence curves that approximate the expected, theoretically predicted triangle function, while the curves at lower MIs and from other subjects display a range of steep decorrelations at lag one with a roughly linear decrease at higher lags. In a subset of these cases (e.g. S6-S8 and S11), spatial coherence remains low across all output conditions, suggesting high levels of incoherent channel noise, which are largely unaffected by increases in MI.
Fig. 9.
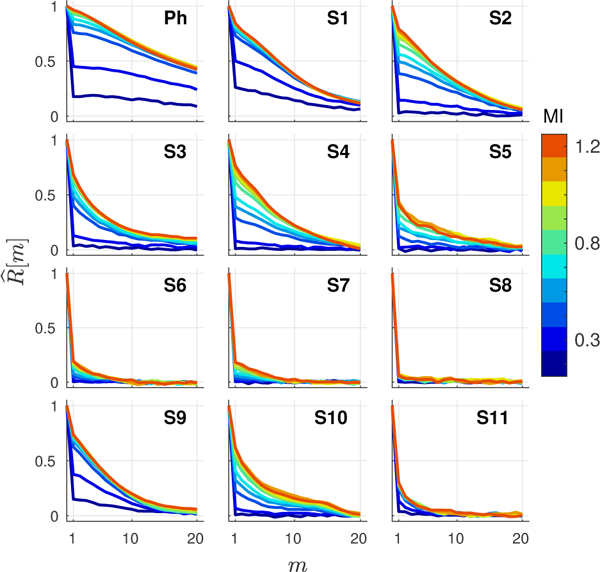
Harmonic spatial coherence curves, representing the spatial coherence as a function of lag m, at varying MIs measured from reference speckle regions in the phantom (Ph) and 11 subjects (S-). Curves exhibit a sharp decorrelation at lag one that decreases in magnitude as MI is increased.
Changes in spatial coherence with acoustic output are well captured by LOC, which also generally follows the behavior of matched measurements of contrast and CNR. Fig. 10 displays representative harmonic images acquired from four subjects under the highest transmit intensity condition (MI = 1.51). Values for different metrics are shown in the bottom left corner of each image and all consistently reflect the differences in image quality among the four subjects, with the exception of temporal correlation (ρT), which remains close to 1.00 across all of the images. Consistent with findings in clinical literature, increased thickness of abdominal fat layers, as observable in Fig. 10 by the depth of intermediate tissue layers between the transducer and liver, is associated with decreased image quality and correspondingly lower values of LOC. The image shown for S8 represents an example in which the lack of an identifiable vessel prohibits the measurement of contrast and CNR where viable measurements of LOC can still be obtained.
Fig. 10.
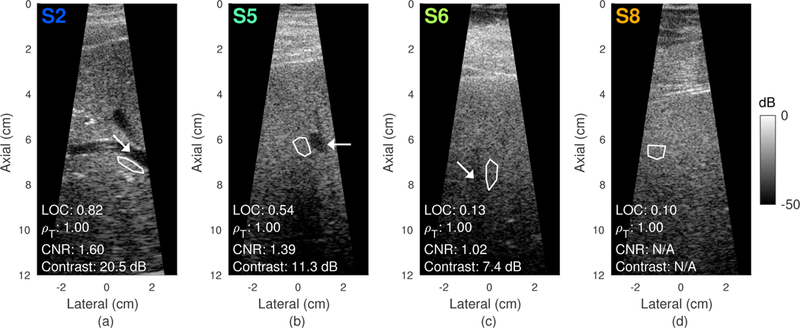
Harmonic B-mode images from subjects S2, S5, S6, and S8 (left to right) acquired at the highest output condition (MI = 1.51). Contrast and CNR were measured from vessels denoted by the white arrows. LOC and temporal correlation ρT were measured from the adjacent background speckle regions outlined in white. Image quality decreases going from left to right as indicated by the diminishing contrast of hepatic vessels and decreasing LOC. Note that contrast measurements could not be obtained in S8 due to the lack of identifiable hypoechoic target regions.
Table I lists the number of acquisitions with measurements of contrast, CNR, and LOC over the total number of acquisitions performed in each subject. Several acquisitions in subjects S6-S8 and S11 lacked visible vessel regions required for measurements of contrast and CNR. In other cases, bulk transducer motion during the 1.7-s acquisition resulted in the displacement of ROIs outside the vessels of interest. As shown by Table I, measurements of LOC could be obtained from all acquisitions regardless of motion or the absence of target regions.
TABLE I.
Fraction of viable acquisitions per subject.
| S1 | S2 | S3 | S4 | S5 | S6 | S7 | S8 | S9 | S10 | S11 | |
|---|---|---|---|---|---|---|---|---|---|---|---|
| Contrast, CNR | 5/5 | 5/5 | 4/4 | 5/5 | 7/7 | 3/5 | 3/3 | 0/4 | 2/3 | 1/3 | 0/3 |
| LOC | 5/5 | 5/5 | 4/4 | 5/5 | 7/7 | 5/5 | 3/3 | 4/4 | 3/3 | 3/3 | 3/3 |
D. Characterization of Acoustic Noise
Figs. 11a to 11d plot measurements of contrast, CNR, temporal correlation, and LOC as MI is swept from 0.06 to 1.51 for the 15 dB phantom target and subjects S2, S5, S6, and S8 (colors). Dotted-dashed lines represent the logistic fits across measurements obtained from each variable output acquisition. Markers (+) in Fig. 11d indicate the ALARA conditions as identified by measurements of LOC, which are discussed in Section IV-F.
Fig. 11.
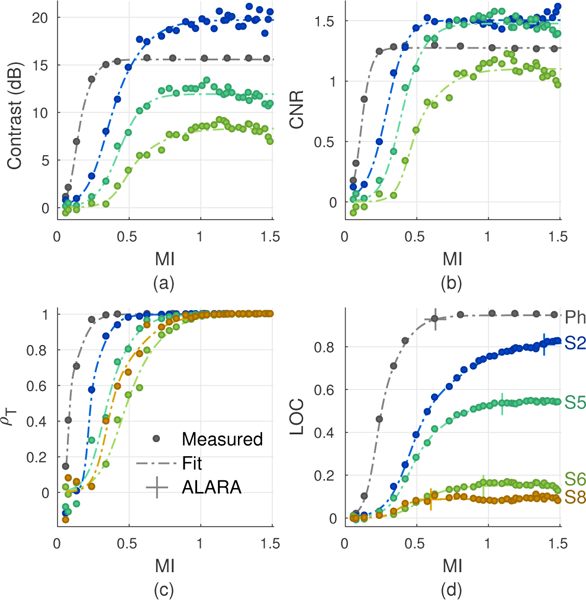
Measured contrast (a), CNR (b), temporal correlation ρT (c), and LOC (d) as MI is increased from 0.06 to 1.51 in the phantom and subjects S2, S5, S6, and S8. All metrics show improvements in image quality with increasing MI up to an asymptotic limit. Dotted-dashed lines represent the logistic fits used to extract the asymptotes for each metric. For LOC, these fits were also used to extract the MI values at 98% of each asymptote to characterize the ALARA acoustic output conditions.
To characterize the behavior of metrics under different levels of acoustic noise, the asymptotes for each logistic fit were extracted from all acquisitions performed in the 11 subjects and phantom. Fig. 12 shows the asymptotes for conventional metrics plotted against corresponding asymptotes for LOC. These asymptotes represent the maximum contrast, CNR, ρT, and LOC that can be achieved with increases in acoustic output, i.e. the values of each metric in the presence of stationary acoustic noise and isolated from the effects of temporally-varying thermal noise. Accordingly, Fig. 12c shows that the asymptotes for temporal correlation universally approach ρT = 1.
Fig. 12.

Scatter plots comparing the image quality asymptotes for contrast (a), CNR (b), and temporal correlation ρT (c) against matched measurements for LOC in each subject and the phantom. Shaded ellipses represent the mean and standard deviation in each subject. The Pearson’s correlation coefficient r between conventional and LOC asymptotes across all subjects measures the linearity between metrics. In the absence of thermal noise, LOC is positively correlated with contrast and CNR, but shows poor correlation with ρT.
Though they occur at MIs at which decorrelation from thermal noise is negligible, LOC asymptotes span a range of values, supporting the notion that spatial coherence represents unique information that is unobtainable from temporal correlation. In general, the LOC asymptotes from all 11 subjects are positively correlated with corresponding asymptotes for contrast and CNR (r = 0.74 and r = 0.66, respectively). The lower correlation coefficient between CNR and LOC is expected given the weak linear dependence between CNR and LOC as predicted by theory [Figs. 3b and 7b].
As was demonstrated in the simulation and phantom results, differences in native target contrast represent a significant source of variation in conventional metrics, which cannot be accounted for under in vivo imaging conditions. This dependence is directly observed in the phantom measurements in Fig. 12a and Fig. 12b. Despite its more favorable imaging conditions, the phantom shows lower values for contrast and CNR compared to a number of measurements obtained in vivo. These results demonstrate the relative nature of conventional metrics, which are not only sensitive to differences in noise level, but also to the intrinsic properties of target and background regions. Nonetheless, the positive correlations between contrast and LOC as well as CNR and LOC suggest consistent behavior between LOC and conventional metrics in the measurement of acoustic noise under various in vivo imaging conditions.
E. Metric Monotonicity
As observed in Figs. 11a, 11b and 11d, measurements of LOC appear more monotonic with changes in MI compared to contrast and CNR. In addition to the effects of speckle variance observed in simulation and phantom, conventional metrics are additionally influenced by motion and changes in echogenicity due to blood flow and other physiological phenomena. Given the weak echogenicity of vessels relative to surrounding tissue, small changes in the properties of target regions used for estimating contrast and CNR can lead to spurious fluctuations between consecutive measurements of image quality.
To assess the stability of LOC and conventional metrics in vivo, the monotonicity of each metric with changes in MI was quantified using the Fisher z-transformed Spearman’s rank correlation (z) between metric and MI values. Figs. 13a and 13b compare the monotonicity between matched measurements of contrast and LOC as well as CNR and LOC from all subjects. under ideal conditions, a perfectly monotonic relationship between each metric and MI is expected, where implying that all measurements are non-decreasing with increasing MI. In this case, improved monotonicity (higher z) is an indicator of decreased noise between subsequent measurements of image quality.
Fig. 13.
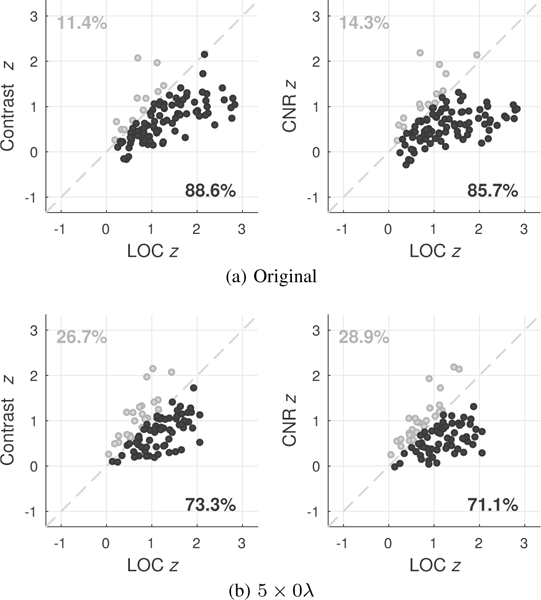
Monotonicity of each metric with MI as reflected by Fisher z-transformed Spearman’s rank correlations (z). Plots compare the monotonicity of metrics with MI between matched measurements of contrast and LOC as well as CNR and LOC made using the original manually traced ROIs (a) and using the original ROIs for contrast and CNR and a 5λ axial kernel (5 × 0λ) for LOC (b). Points below the main diagonal represent improvements in the monotonicity of LOC over contrast and CNR, indicating decreased variability between consecutive measurements of image quality. The percentage of points above and below this diagonal are shown in the upper left and lower right quadrants, respectively.
As shown in Fig. 13a, LOC demonstrates increased monotonicity relative to contrast and CNR, with 88.6% and 85.7% of LOC measurements showing higher Spearman’s correlations compared to matched measurements of contrast and CNR, respectively. This analysis was repeated after truncating the size of LOC ROIs to reflect small 5 × 0λ axial kernels centered about the original ROI locations, while keeping original target and background regions for measurements of contrast and CNR. Consistent with simulation results, Fig. 13b indicates that the stability of LOC is largely maintained for small ROIs, with 73.3% and 71.1% of 5λ kernel estimates of LOC having Spearman’s correlations greater than corresponding measurements of contrast and CNR made using significantly larger ROIs.
F. Acoustic Output Selection
Figs. 14a and 14b summarize the ALARA output conditions in the phantom and each subject as identified by measurements of LOC. Box plots represent the median and inter-quartile range (IQR) of LOC asymptotes [Fig. 14a] and the MIs at which the asymptotes were achieved [Fig. 14b] across all measurements made from each subject (# acquisitions in Table I × 3 ROIs) with repeat acquisitions performed at distinct but adjacent acoustic windows and measurement ROIs selected in discrete, non-overlapping regions of uniform tissue within 2 cm of the focal depth.
Fig. 14.
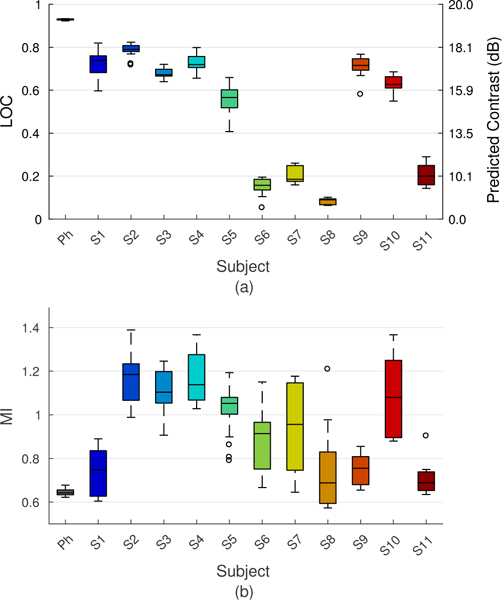
ALARA output conditions in each subject as characterized by the median and IQR of LOC asymptotes (a) and the MI values required to achieve each asymptote (b). The contrast scale on the right-hand y-axis represents the predicted image contrast based on measurements of LOC for a vessel with 20 dB native contrast. Box plots represent data from multiple acquisitions in each subject (see Table I), each consisting of measurements from 3 separate ROIs located within 2 cm of the focus. Results show high repeatability in the characterization of patient-specific image quality using LOC.
Using the analytic expressions derived in Section II, LOC was used to estimate channel SNR and predict the loss in contrast and CNR due to incoherent channel noise. In Fig. 14a, the predicted contrast values for a 20 dB vessel are shown in the right-hand y-axis. Although relationships derived under assumptions of a triangular coherence function and additive random noise do not fully hold under in vivo conditions, they offer a means to calibrate measurements of LOC to traditionally computed metrics of image quality. Still under many circumstances, as demonstrated by phantom measurements in Figs. 7a and 7b and coherence curves in Fig. 9, this simplified model is observed to closely approximate the behavior of spatial coherence under realistic imaging conditions.
Subjects exhibit a range of different LOC and MI values under ALARA conditions. Consistent with Fig. 12, LOC asymptotes span the full dynamic range (0.05 to 0.96), indicating that some individuals image well, some poorly and others in between at optimal acoustic output levels. Under the assumptions in Eq. (6), these values translate to channel SNRs on the order of −13 to 14 dB, indicating a wide range of stationary acoustic noise levels observed under the harmonic imaging conditions in this study. Differences in image quality are reflected by the predicted contrast values, which are as low as 5 dB in subject S8 and approach the full 20 dB native contrast in the phantom.
In addition to differences in the maximum LOC, results in Fig. 14b also reveal differences in the acoustic output levels needed to achieve maximum image quality in each subject. In general, subjects with high LOC asymptotes (S2-S5 and S10) require MIs on the order of 1.0 to 1.4 to reach their image quality maxima, while those with low LOC asymptotes (S6-S8 and S11) approach their maxima at comparably lower levels of output. Interestingly, subjects S1 and S9 as well as the phantom represent cases with both high image quality and low optimal MIs. Results suggest that MIs in these subjects as well as those with low LOC asymptotes can be reduced below standard clinical values with little detriment to image quality.
Trends observed in Fig. 14 highlight an important relationship between the image quality improvements observed with elevated MI and differences in acoustic noise level. In subjects S6-S8 and S11, low LOC asymptotes, indicating poor spatial coherence in the absence of thermal noise, suggest that stationary sources of acoustic noise such as phase aberration and reverberation clutter are the dominant sources of image degradation. Because these sources of noise are largely multiplicative in nature and scale with acoustic output, elevated MIs yield minimal change in the effective channel SNR and consequently have little impact on image quality. This is reflected in LOC values, which show a diminishing benefit to increased acoustic output and low optimal MI values, indicating equally poor image quality under both high and low MI conditions. Such trends are not as easily captured by measurements of contrast and CNR, which are confounded by intrinsic contrast dependence, or temporal correlation, which is insensitive to acoustic noise.
The improved stability of LOC coupled with its ability to capture both temporal and acoustic noise using a single ROI present major advantages over conventional image quality metrics. As illustrated by the relatively small IQRs for each subject in Fig. 14a and Fig. 14b, such properties allow for highly repeatable measurements of LOC across independent acquisitions that reliably characterize patient-specific image quality. Though additional studies are needed to further validate the specific trends observed in Fig. 14, preliminary experimental results demonstrate clear feasibility in the quantification of in vivo ultrasonic image quality using measurements of LOC.
V. CONCLUSION
We have presented a novel image quality metric, known as lag-one coherence (LOC), which is derived from the correlation between backscattered ultrasound echoes from pairs of neighboring array elements. Analytic expressions relating LOC to varying levels of noise and to conventional metrics were introduced and validated in simulation and phantom studies. Clinical feasibility of LOC was demonstrated in the context of adaptive acoustic output selection in harmonic liver imaging.
Theory and experimental results indicate that LOC provides a local, single ROI measurement of both thermal and acoustic noise, which is correlated with conventional metrics, but has lower measurement variability. As shown by in vivo measurements of LOC, such properties enable reliable characterization of patient-specific image quality under realistic conditions with motion, heterogeneous anatomy, and different sources and varying degrees of noise. The flexibility afforded by LOC shows promise to facilitate the development of clinical ultrasound technologies, which rely on the automated or semiautomated measurement of image quality.
ACKNOWLEDGMENT
The authors would like to thank Dr. Rendon Nelson, M. Morgan, K. Flint, and D. Bradway for their assistance with subject recruitment and data collection. This work was supported by the National Institute of Biomedical Imaging and Bioengineering grants R01-EB017711, R01-EB026574 and T32-EB001040.
Biographies

Will Long received the B.S. degree in biomedical engineering from the university of Rochester, Rochester, NY, USA, in 2013. He is currently a Ph.D. candidate in biomedical engineering at Duke University, Durham, NC, USA. His current research interests include beamforming, adaptive imaging, and noise in ultrasonic imaging.

Nick Bottenus received the B.S.E. degree in biomedical engineering and electrical & computer engineering from Duke University, Durham, NC, USA, in 2011 and the Ph.D. degree in biomedical engineering from Duke University in 2017. He is currently a research scientist at Duke University, developing methods for performing large aperture ultrasound imaging and improving image quality through beamforming.

Gregg E. Trahey (S’83-M’85) received the B.G.S. and M.S. degrees from the University of Michigan, Ann Arbor, MI, USA, in 1975 and 1979, respectively, and the Ph.D. degree in biomedical engineering, from Duke University, Durham, NC, USA, in, 1985. He served in the Peace Corps from 1975 to, 1978 and was a project engineer at the Emergency, Care Research Institute in Plymouth Meeting, PA, USA, from 1980 to 1982. He currently is a Professor, with the Department of Biomedical Engineering at, Duke University and holds a secondary appointment, with the Department of Radiology at the Duke University Medical Center. His, current research interests include adaptive beamforming and acoustic radiation, force imaging methods.
REFERENCES
- [1].Üstüner KF and Holley GL, “Ultrasound imaging system performance assessment,” in AAPM Annual Meeting, 2003. [Google Scholar]
- [2].Patterson M and Foster F, “The improvement and quantitative assessment of b-mode images produced by an annular array/cone hybrid,” Ultrasonic Imaging, vol. 5, no. 3, pp. 195–213, 1983. [DOI] [PubMed] [Google Scholar]
- [3].Smith S and Wagner R, “Ultrasond speckle size and lesion signal to noise ratio: Verification of theory,” Ultrasonic Imaging, vol. 6, no. 2, pp. 174–180, 1984. [DOI] [PubMed] [Google Scholar]
- [4].Touil B, Bernard O, and Friboulet D, “Motion decorrelation in echocardiography: Analysis from a realistic simulation,” in Biomedical Imaging: From Nano to Macro, 2008. ISBI2008. 5th IEEE International Symposium on. IEEE, 2008, pp. 1469–1472. [Google Scholar]
- [5].D’Hooge J, Heimdal A, Jamal F, Kukulski T, Bijnens B, Rademakers F, Hatle L, Suetens P, and Sutherland G, “Regional strain and strain rate measurements by cardiac ultrasound: principles, implementation and limitations,” European Journal of Echocardiography, vol. 1, no. 3, pp. 154–170, 2000. [DOI] [PubMed] [Google Scholar]
- [6].Friemel BH, Bohs LN, Nightingale KR, and Trahey GE, “Speckle decorrelation due to two-dimensional flow gradients,” IEEE Transactions on Ultrasonics, Ferroelectrics, and Frequency Control, vol. 45, no. 2, pp. 317–327, 1998. [DOI] [PubMed] [Google Scholar]
- [7].Dahl JJ and Sheth NM, “Reverberation clutter from subcutaneous tissue layers: Simulation and in vivo demonstrations,” Ultrasound in Medicine and Biology, vol. 40, no. 4, pp. 714–726, 2014. [DOI] [PMC free article] [PubMed] [Google Scholar]
- [8].Doherty JR, Dahl JJ, and Trahey GE, “Harmonic tracking of acoustic radiation force-induced displacements,” IEEE Transactions on Ultrasonics, Ferroelectrics, and Frequency Control, vol. 60, no. 11, pp. 2347–2358, 2013. [DOI] [PMC free article] [PubMed] [Google Scholar]
- [9].Bottenus N, Byram BC, Dahl JJ, and Trahey GE, “Synthetic aperture focusing for short-lag spatial coherence imaging,” IEEE Transactions on Ultrasonics, Ferroelectrics, and Frequency Control, vol. 60, no. 9, pp. 1816–1826, 2013. [DOI] [PMC free article] [PubMed] [Google Scholar]
- [10].Walker WF and Trahey GE, “Speckle coherence and implications for adaptive imaging,” The Journal of the Acoustical Society of America, vol. 101, no. 4, pp. 1847–1858, 1997. [DOI] [PubMed] [Google Scholar]
- [11].Bottenus NB and Trahey GE, “Equivalence of time and aperture domain additive noise in ultrasound coherence,” The Journal of the Acoustical Society of America, vol. 137, no. 1, pp. 132–138, 2015. [DOI] [PMC free article] [PubMed] [Google Scholar]
- [12].Pinton GF, Trahey GE, and Dahl JJ, “Spatial coherence in human tissue: Implications for imaging and measurement,” IEEE Transactions on Ultrasonics, Ferroelectrics, and Frequency Control, vol. 61, no. 12, pp. 1976–1987, 2014. [DOI] [PMC free article] [PubMed] [Google Scholar]
- [13].Lediju MA, Trahey GE, Byram BC, and Dahl JJ, “Short- lag spatial coherence of backscattered echoes: Imaging characteristics,” IEEE Transactions on Ultrasonics, Ferroelectrics, and Frequency Control, vol. 58, no. 7, 2011. [DOI] [PMC free article] [PubMed] [Google Scholar]
- [14].Li YL and Dahl JJ, “Coherent flow power doppler (cfpd): flow detection using spatial coherence beamforming,” IEEE Transactions on Ultrasonics, Ferroelectrics, and Frequency Control, vol. 62, no. 6, pp. 1022–1035, 2015. [DOI] [PMC free article] [PubMed] [Google Scholar]
- [15].Mallart R and Fink M, “Adaptive focusing in scattering media through sound-speed inhomogeneities: The van cittert zernike approach and focusing criterion,” The Journal of the Acoustical Society of America, vol. 96, no. 6, pp. 3721–3732, 1994. [Google Scholar]
- [16].Hollman K, Rigby K, and O’Donnell M, “Coherence factor of speckle from a multi-row probe,” in Ultrasonics Symposium, 1999. Proceedings. 1999 IEEE, vol. 2 IEEE, 1999, pp. 1257–1260. [Google Scholar]
- [17].Li P-C and Li M-L, “Adaptive imaging using the generalized coherence factor,” IEEE Transactions on Ultrasonics, Ferroelectrics, and Frequency Control, vol. 50, no. 2, pp. 128–141, 2003. [DOI] [PubMed] [Google Scholar]
- [18].Camacho J, Parrilla M, and Fritsch C, “Phase coherence imaging,” IEEE Transactions on Ultrasonics, Ferroelectrics, and Frequency Control, vol. 56, no. 5, 2009. [DOI] [PubMed] [Google Scholar]
- [19].Liu D-L and Waag RC, “Correction of ultrasonic wavefront distortion using backpropagation and a reference waveform method for time- shift compensation,” The Journal of the Acoustical Society of America, vol. 96, no. 2, pp. 649–660, 1994. [DOI] [PubMed] [Google Scholar]
- [20].Goodman JW, Statistical optics. John Wiley & Sons, 2015. [Google Scholar]
- [21].Mallart R and Fink M, “The van cittert-zernike theorem in pulse echo measurements,” The Journal of the Acoustical Society of America, vol. 90, no. 5, pp. 2718–2727, 1991. [Google Scholar]
- [22].Fedewa RJ, Wallace KD, Holland MR, Jago JR, Ng GC, Rielly MR, Robinson BS, and Miller JG, “Spatial coherence of the nonlinearly generated second harmonic portion of backscatter for a clinical imaging system,” IEEE Transactions on Ultrasonics, Ferroelectrics, and Frequency Control, vol. 50, no. 8, pp. 1010–1022, 2003. [DOI] [PubMed] [Google Scholar]
- [23].Pinton G, Trahey G, and Dahl J, “Characteristics of the spatial coherence function from backscattered ultrasound with phase aberration and reverberation clutter,” in Ultrasonics Symposium (IUS), 2011 IEEE International. IEEE, 2011, pp. 684–687. [Google Scholar]
- [24].Wagner RF, Insana MF, and Smith SW, “Statistics of speckle in ultrasound b-scans,” IEEE Transactions on Sonics and Ultrasonics, vol. 30, no. 3, pp. 156–163, 1983. [Google Scholar]
- [25].Jensen JA and Svendsen NB, “Calculation of pressure fields from arbitrarily shaped, apodized, and excited ultrasound transducers,” IEEE Transactions on Ultrasonics, Ferroelectrics, and Frequency Control, vol. 39, no. 2, pp. 262–267, 1992. [DOI] [PubMed] [Google Scholar]
- [26].Jensen JA, “Field: A program for simulating ultrasound systems,” in Proceedings of the 10th Nordic-Baltic Conference on Biomedical Engineering, vol. 34, 1996, pp. 351–353. [Google Scholar]
- [27].Ricketts JH and Head GA, “A five-parameter logistic equation for investigating asymmetry of curvature in baroreflex studies,” American Journal of Physiology-Regulatory, Integrative and Comparative Physiology, vol. 277, no. 2, pp. R441–R454, 1999. [DOI] [PubMed] [Google Scholar]
- [28].Hauke J and Kossowski T, “Comparison of values of pearson’s and spearman’s correlation coefficients on the same sets of data,” Quaes- tiones Geographicae, vol. 30, no. 2, pp. 87–93, 2011. [Google Scholar]
- [29].Corey DM, Dunlap WP, and Burke MJ, “Averaging correlations: Expected values and bias in combined pearson rs and fisher’s z transformations,” The Journal of General Psychology, vol. 125, no. 3, pp. 245–261, 1998. [Google Scholar]


