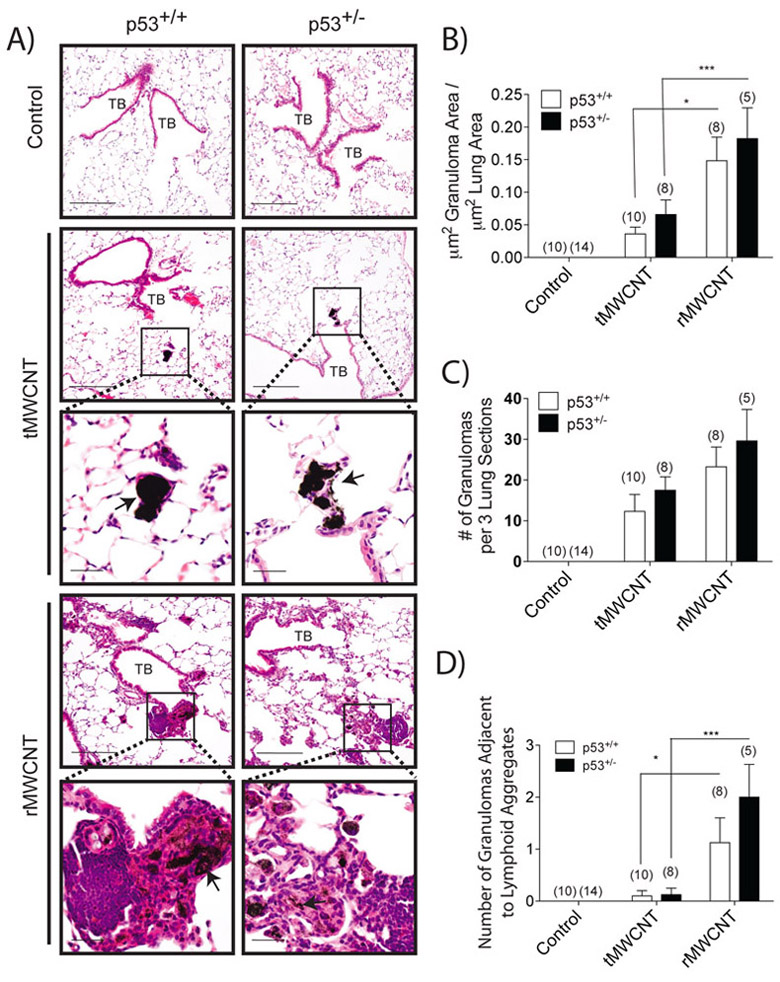
Figure 3.
rMWCNT exposure results in significantly larger lung granuloma area and a higher association with lymphoid tissue compared to tMWCNT, with a trend of larger formations in the lungs of p53+/− mice. A) H&E stained lung sections from wild type and p53+/− mouse lungs exposed to t- or r- MWCNTs near the terminal bronchioles (TB) of the lungs. Insets depict matured granuloma formations as indicated by arrows. (scale bar equal 200 μm, inset scale bars equal 50 μm). B) Average area of lung occupied by granuloma measured by quantitative morphometry (***p<0.001, *p<0.05 between tMWCNTs and rMWCNTs). C) Average number of granulomas per three lung sections per mouse. D) Average number of granulomas directly adjacent to lymphoid tissue per three lung sections per mouse. Number in parentheses above graph bar indicates number of animals per group. (***p<0.001, *p<0.05 between tMWCNTs and rMWCNTs).

