Abstract
Background: Serum amyloid A (SAA1) is an apolipoprotein that maintains glucose and lipid homeostasis. Its polymorphisms are associated with risks of myocardial infarction and coronary artery disease (CAD). Methods: However, little is known about the associations of these polymorphisms with susceptibility to osteoporosis, which we evaluated in this hospital-based case–control study involving 300 osteoporosis patients and 350 controls. Three single-nucleotide polymorphisms (SNPs) (rs183978373, rs12218, and rs10832915) were genotyped using MALDI TOF MS. Results: There were no differences in the rs183978373 and rs12218 polymorphisms between the osteoporosis group and controls. The SAA1 gene rs10832915 polymorphism increased the risk of osteoporosis in our Chinese population. The genotypes of the rs10832915 polymorphism were not significantly associated with clinical parameters (age, body mass index (BMI), high- and low-density lipoprotein (LDL), total cholesterol (TC), and T-score). Haplotype analysis revealed that the ATT haplotype had a significant correlation with a decreased risk of osteoporosis. Conclusion: In conclusion, the SAA1 rs10832915 polymorphism and its haplotypes are associated with osteoporosis, but this finding should be confirmed in large well-designed studies.
Keywords: Chinese population, molecular epidemiology, osteoporosis, polymorphism, SAA1
Introduction
Osteoporosis is the most common bone disease and is characterized by a reduction in bone mineral density (BMD), a deterioration of the bone tissue microarchitecture, and an increased risk of fractures [1]. The prevalence of osteoporosis is higher in females than in males (25.41 compared with 15.33%) and increases with age [2]. Despite its severe effects, the mechanism of underpinning osteoporosis remains unclear. Osteoporosis is recognized as a multifactorial disease resulting from genetic, and environmental factors and their interaction [3,4]. A genetic study revealed that osteoporosis has a major risk of low BMD and is controlled genetically [5].
Serum amyloid A (SAA) proteins are a family of inflammatory apolipoproteins that may modify the structures and functions of high-density lipoprotein (HDL) [6]. The higher HDL-C level of high-SAA1 patients is associated with increased all-cause and cardiovascular mortality rates [7]. SAA1 plays an active role in atherosclerosis and coronary artery disease (CAD) [6,8]. The incidence of CAD including a high coronary artery calcium score (≥100), obstructive CAD, and multivessel disease is significantly higher in lower BMD subjects, including those with osteopenia and osteoporosis [9]. However, no association between SAAs and osteoporosis has been reported.
SAA1 is located in chromosome 11p15.1 and has four exons. Although two studies have reported an association between the SAA1 rs12218 polymorphism and the risk of osteoporosis, their findings conflicted [10,11]. Therefore, this case–control study which enrolled 300 osteoporosis patients and 350 controls was conducted to evaluate the role of SAA1 gene polymorphisms in the risk of osteoporosis in a Chinese population.
Materials and methods
Participants
The 300 postmenopausal osteoporosis patients and 350 controls were enrolled from the Affiliated Changzhou No. 2 People’s Hospital of Nanjing Medical University (Changzhou, China) and the Second Affiliated Hospital of Medical College, Zhejiang University (Hangzhou, China) with a respond rate of 78% between April 2012 and June 2017. All participants were of Chinese Han nationality and genetically unrelated. Those having diseases (e.g. diabetes mellitus, hyperthyroidism, or any systemic illness) or taking drugs (e.g. calcium supplements) that affected bone metabolism were excluded. The present study was approved by the Institutional Ethnics Committees of the two hospitals. Personal and medical confidentiality was ensured in line with Declaration of Helsinki. Written informed consent was obtained from all participants.
Measurement of body mass density
BMDs at the lumbar spine (L2–L4) and the femoral neck were measured using a dual-energy X-ray absorptiometer (Lunar Corp, Madison, WI, U.S.A.) by two qualified radiologists who were blind to other medical data. BMDs were recorded in g/cm2 and as peak bone mass percentage in the controls (T-score).
Co-expression analysis and single-nucleotide polymorphism selection
The co-expressed genes with SAA1 were identified on MEM-Multi Experiment Matrix (http://biit.cs.ut.ee/mem/index.cgi) Relevant functions of these genes were explored through Gene Ontology (GO) analysis.
Linkage data of SAA1 gene were searched from Ensembl (http://www.ensembl.org/index.html) and processed on Haploview. Relevant parameters were set as follows: Hardy–Weinberg P-value cutoff = 0.05; minimum genotype = 95%; Max# Mendel error = 1; minimum allele frequency = 0.05. Such setting may help to find the tagging single-nucleotide polymorphisms (SNPs).
Peripheral blood DNA extraction and genotyping for SAA1 gene
Peripheral venous blood (2 ml) was collected from each participant, and then genomic DNA was isolated using a WizardVR genomic DNA purification kit (Promega, Madison, U.S.A.) following the supplier’s manual. The concentration and purity of the genomic DNA were estimated on NanoDrop using two optical density wavelengths 260 and 280 nm.
Genotyping was done by MALDI-TOF-MS using a MassARRAY system (Sequenom, San Diego, CA, U.S.A.) as previously described [13]. Complete genotyping reactions were spotted on to a 384-well spectroCHIP (Sequenom) using MassARRAY nanodispenser (Sequenom) and analyzed by MALDI-TOF-MS. Genotype callings were done in real time with MassARRAY RT 3.1 and analyzed on MassARRAY Typer 4.0 (both Sequenom). For quality control, 10% of the randomly selected samples were analyzed repeatedly.
Genotype and gene expression correlation analysis
Genotypes data of SAA1 rs10832915 polymorphism were downloaded from the International HapMap Project. Its mRNA expression data were available on GTex portal (https://www.gtexportal.org/home/) [12].
Statistical analysis
All statistical analyses were conducted on Stata 11.0 (SAS Institute, Cary, NC, U.S.A.). All continuous variables were expressed as mean ± S.D. Hardy–Weinberg equilibrium (HWE) for the rs12218 polymorphism in the control group was examined using the Chi-square test. Differences in BMDs, body mass index (BMI), HDL, low-density lipoprotein (LDL), total cholesterol (TC), T-score and Z-score according to different genotypes were tested using analysis of covariance (ANOVA). Association between variables was evaluated by multiple regression and logistic regression. Odds ratio (OR) and 95% confidence interval (CI) were calculated to evaluate the association between the SAA1 rs12218 polymorphism and the risk of osteoporosis by logistic analysis. The significance was set at P<0.05.
Results
Bioinformatics analysis
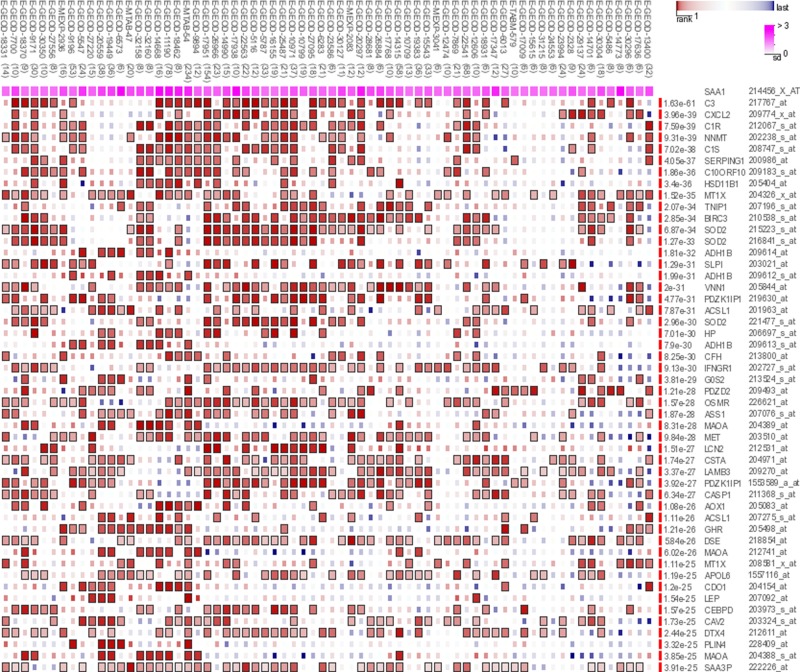
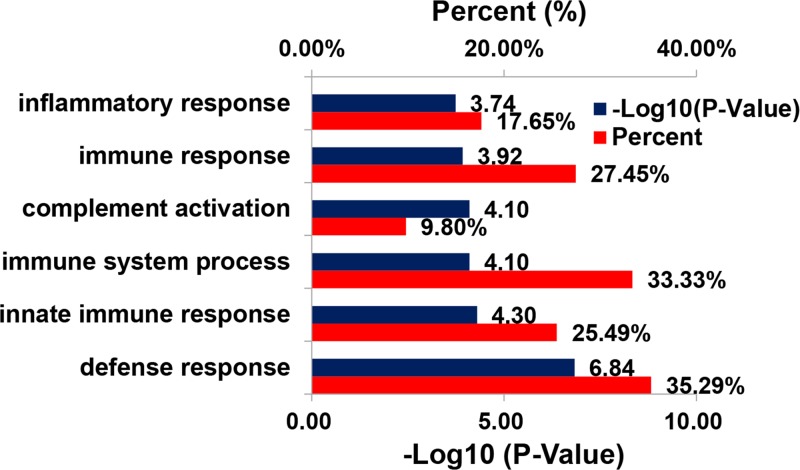
The genes co-expressed with SAA1 are shown in Figure 1. The cortisol synthesis enzyme 11β-hydroxysteroid dehydrogenase (HSD11B) affects the physiological levels and severity of age-related osteoporosis [13]. Superoxide dismutase 2 (SOD2) was significantly up-regulated at protein level in vivo in low-hip-BMD Chinese compared with high-hip-BMD [14]. GO analysis of biological process indicated that these genes of SAA1 were mainly involved in the immune system process (Figure 2).
Figure 1. Co-expression genes with SAA1.
Figure 2. Barplot of representative GO biological process of co-expressed gene with SAA1.
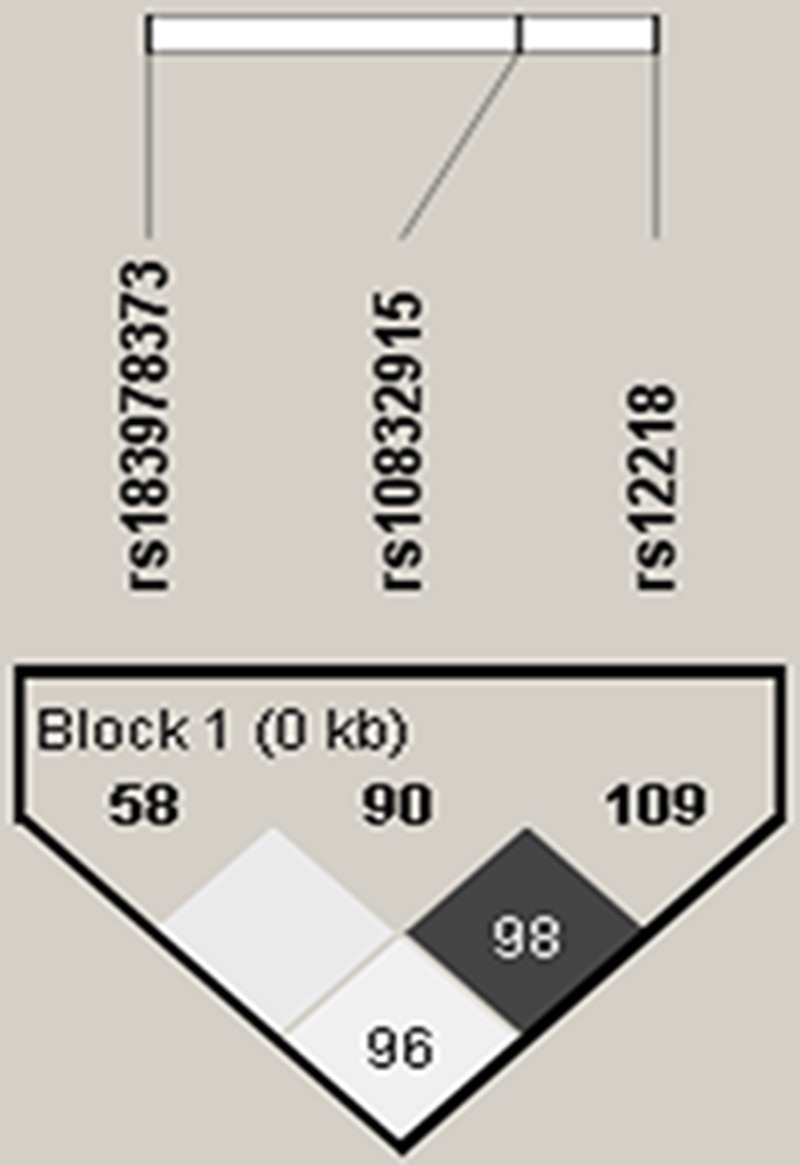
In the present study, three tagging SNPs (rs183978373, rs12218, and rs1083295) were identified. Of them, rs12218 was under linkage disequilibrium with two other SNPs that were also located in the intron region of SAA1 gene (Figure 3).
Figure 3. Linkage disequilibrium for SAA1 gene.
Subject characteristics
Some characteristics of the study population and corresponding significances were summarized in Table 1. The mean ages were not significantly different between the patients and the controls (46.70 compared with 46.88 years). Significant differences between the cases and the controls were found in T-scores and Z-scores (both P<0.05), but not in BMI, HDL, LDL, or TC (all P>0.05). No significant deviations of the SAA1 gene polymorphisms from HWE were found in either patients or controls (P=0.658, 0.975, and 0.856, respectively).
Table 1. Patient demographics and risk factors in osteoporosis.
| Variable | Cases (n=300) | Controls (n=350) | P |
|---|---|---|---|
| Age (years) | 46.70 ± 4.47 | 46.88 ± 5.01 | 0.641 |
| BMI (kg/m2) | 24.40 ± 1.45 | 24.24 ± 1.45 | 0.179 |
| HDL (mmol/l) | 1.21 ± 0.35 | 1.24 ± 0.36 | 0.241 |
| LDL (mmol/l) | 2.61 ± 0.84 | 2.43 ± 0.75 | 0.050 |
| TC (mmol/l) | 4.48 ± 0.96 | 4.38 ± 0.84 | 0.143 |
| T-score | −3.02 ± 0.58 | 0.13 ± 0.11 | <0.001 |
| Z-score | −2.08 ± 0.47 | 0.63 ± 0.18 | <0.001 |
Analysis of SAA1 gene polymorphisms
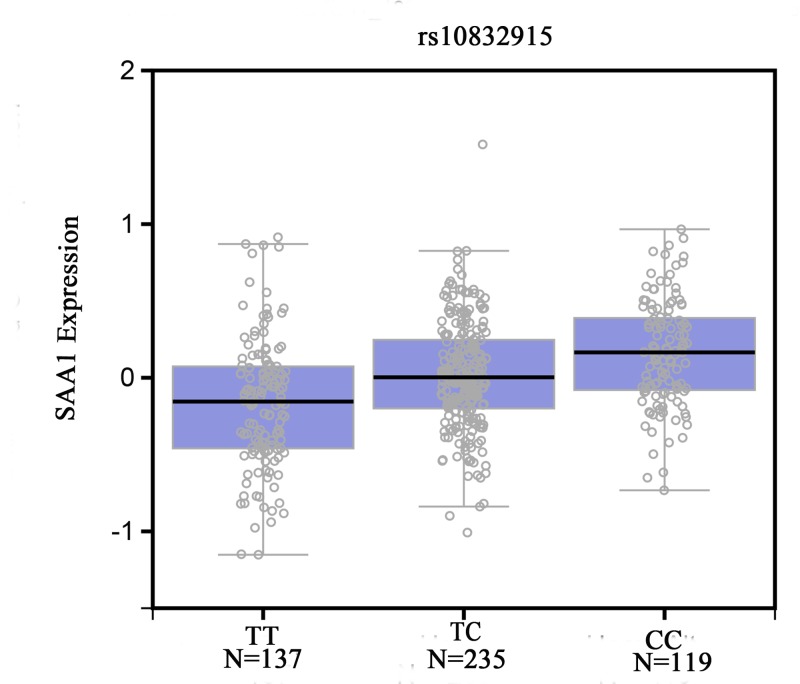
The genotype and allele distributions of the three SAA1 gene polymorphisms in the two groups are provided in Table 2. SAA1 rs183978373 polymorphism was not associated with the risk of osteoporosis. The rs12218 polymorphism was significantly correlated with an increased risk of osteoporosis in the recessive model. The CC genotype or C allele of rs10832915 polymorphism was significantly associated with the risk of osteoporosis (CC compared with TT, OR = 1.62, 95% CI = 1.01–2.60, P=0.045; C compared with T, OR = 1.26, 95% CI = 1.01–1.58, P=0.041, Table 2). No association between this polymorphism and risk of osteoporosis was identified under the dominant or recessive models. The genotypes of this polymorphism were not significantly associated with clinical characteristics (age, BMI, TC, HDL, LDL, and T-score; Table 3). The SAA1 mRNA expression levels by the genotypes of rs10832915 polymorphism were shown in Figure 4. We found significant difference in the expression levels for rs10832915 polymorphism in the muscles (P=1.7 × 10⁻¹²). CC genotype increased the SAA1 compared with TT genotype. Furthermore, all three SNPs were located in one haplotype block. Haplotype analysis suggested ATT haplotype was associated with decreased risk of osteoporosis (Table 4).
Table 2. Logistic regression analysis of associations between SAA1 gene polymorphisms and risk of osteoporosis.
| Genotype | Cases (n=300) | Controls (n=350) | OR (95% CI) | P | ||
|---|---|---|---|---|---|---|
| n | % | n | % | |||
| Rs183978373 | ||||||
| CC | 225 | 75.0 | 245 | 70.0 | 1.00 | |
| CA | 65 | 21.7 | 97 | 27.7 | 0.73 (0.51, 1.05) | 0.088 |
| AA | 10 | 3.3 | 8 | 2.3 | 1.36 (0.53, 3.51) | 0.524 |
| AA+CA | 75 | 25.0 | 105 | 30.0 | 0.78 (0.55, 1.10) | 0.156 |
| CC+CA | 290 | 96.7 | 342 | 97.7 | 1.00 | |
| AA | 10 | 3.3 | 8 | 2.3 | 1.47 (0.57, 3.78) | 0.420 |
| C allele | 515 | 85.8 | 587 | 83.9 | 1.00 | |
| A allele | 85 | 14.2 | 113 | 16.1 | 0.86 (0.63, 1.16) | 0.323 |
| Rs12218 | ||||||
| TT | 98 | 32.7 | 113 | 32.3 | 1.00 | |
| TC | 137 | 45.7 | 187 | 53.4 | 0.85 (0.60–1.20) | 0.343 |
| CC | 65 | 21.7 | 50 | 14.3 | 1.50 (0.95–2.37) | 0.083 |
| TC+CC | 202 | 67.3 | 237 | 67.7 | 0.98 (0.70–1.36) | 0.918 |
| TT+TC | 235 | 78.4 | 300 | 85.7 | 1.00 | |
| CC | 65 | 21.7 | 50 | 14.3 | 1.66 (1.11–2.49) | 0.015 |
| T allele | 333 | 44.5 | 413 | 59.0 | 1.00 | |
| C allele | 267 | 55.4 | 287 | 41.0 | 1.15 (0.93–1.44) | 0.203 |
| Rs10832915 | ||||||
| TT | 108 | 36.0 | 148 | 42.3 | 1.00 | |
| TC | 140 | 46.7 | 158 | 45.1 | 1.21 (0.87, 1.70) | 0.258 |
| CC | 52 | 17.3 | 44 | 12.6 | 1.62 (1.01, 2.60) | 0.045 |
| TC+CC | 192 | 64.0 | 202 | 57.7 | 1.30 (0.95, 1.79) | 0.102 |
| TT+TC | 248 | 82.7 | 306 | 87.4 | 1.00 | |
| CC | 52 | 17.3 | 44 | 12.6 | 1.46 (0.94, 2.25) | 0.089 |
| T allele | 356 | 40.7 | 554 | 64.9 | 1.00 | |
| C allele | 244 | 59.3 | 246 | 35.1 | 1.26 (1.01, 1.58) | 0.041 |
Bold values are statistically significant (P<0.05).
Table 3. The clinical and biochemical characteristics of SAA1 rs10832915 polymorphism between two groups.
| Patients (n=300) | Controls (n=350) | |||||||
|---|---|---|---|---|---|---|---|---|
| TT (n=108) | TC (n=140) | CC (n=52) | P | TT (n=148) | TC (n=158) | CC (n=44) | P | |
| Age (years) | 46.74 ± 4.46 | 46.58 ± 4.35 | 46.96 ± 4.88 | 0.866 | 46.57 ± 5.03 | 47.27 ± 5.06 | 46.50 ± 4.76 | 0.408 |
| BMI (kg/m2) | 24.45 ± 1.41 | 24.47 ± 1.49 | 24.12 ± 1.40 | 0.283 | 24.30 ± 1.45 | 24.29 ± 1.62 | 23.91± 1.31 | 0.310 |
| TC (mmol/l) | 4.48 ± 0.94 | 4.52 ± 0.98 | 4.41 ± 0.96 | 0.794 | 4.30 ± 0.85 | 4.43 ± 0.86 | 4.46 ± 0.74 | 0.329 |
| HDL (mmol/l) | 1.22 ± 0.37 | 1.19 ± 0.34 | 1.21 ± 0.38 | 0.730 | 1.22 ± 0.35 | 1.25 ± 0.35 | 1.27 ± 0.43 | 0.676 |
| LDL (mmol/l) | 2.68 ± 0.80 | 2.61 ± 0.84 | 2.46 ± 0.90 | 0.293 | 2.42 ± 0.70 | 2.50 ± 0.78 | 2.25 ± 0.73 | 0.148 |
| T-score | −3.09 ± 0.54 | −3.00 ± 0.61 | −2.95 ± 0.57 | 0.255 | 0.14 ± 0.11 | 0.14 ± 0.11 | 0.13 ± 0.10 | 0.877 |
| Z-score | −2.11 ± 0.41 | -2.06 ± 0.47 | −2.11 ± 0.55 | 0.615 | 0.62 ± 0.17 | 0.66 ± 0.19 | 0.60 ± 0.17 | 0.094 |
Figure 4. Functional implication of SAA1 rs10832915 polymorphism.
Table 4. Distribution of haplotypes.
| Haplotype | Osteoporosis | Controls | OR (95% CI)* | P |
|---|---|---|---|---|
| CTT | 0.310 | 0.366 | 0.85 (0.66, 1.08) | 0.184 |
| CCC | 0.202 | 0.193 | 1.05 (0.78, 1.40) | 0.763 |
| ATT | 0.077 | 0.116 | 0.66 (0.45, 0.98) | 0.039 |
| CCT | 0.273 | 0.286 | 0.96 (0.74, 1.24) | 0.736 |
Bold values are statistically significant (P<0.05).
OR, the ratio of the number of individuals with/without CTT/CCC/ATT/CCT haplotype in the osteoporosis patients/the ratio of the number of individuals with/without CTT/CCC/ATT/CCT haplotype in the controls.
Discussion
We found that SAA1 rs10832915 polymorphisms conferred susceptibility to osteoporosis under codominant and allelic models. Furthermore, the ATT haplotype decreased the risk of osteoporosis.
During the acute-phase response, SAA1 can remodel HDL in a manner that releases apoA-1 or other efficient ABCA ligands from HDL [15]. An elevated HDL level was observed in osteoporosis patients, and HDL was inversely correlated with BMD [16]. Additionally, SAA induces monocyte tissue factor, which may contribute to inflammation-associated thrombosis [17]. Sun et al. [18] found that SAA alters macrophage phenotypes and modulates macrophage functions via an MYD88-dependent mechanism that affects the magnitude and duration of the inflammatory response. Inflammation modulates bone resorption via proinflammation cytokines and macrophage colony stimulating factor [19]. However, there are few reports on the role of SAA1 in the etiology of osteoporosis.
SAA1 gene polymorphisms may alter the gene expression and function and modulate osteoporosis susceptibility. Therefore, we performed this case–control study to evaluate the association between SAA1 gene polymorphisms and the risk of osteoporosis. This is the first study to uncover an association between rs183978373 and rs10832915 polymorphisms and the risk of osteoporosis. The rs12218 polymorphism is associated with the risks of many diseases, including myocardial infarction [20], CAD [21], and ischemic stroke [22]. However, little is known about its association with the susceptibility to osteoporosis. The first relevant hospital-based study involving 307 osteoporosis patients and 387 controls [10]. They found that the CC genotype of the rs12218 polymorphism expressed more SAA1 and increased the risk of osteoporosis compared with the TT genotype [10]. This SNP was also associated with the TC, HDL, LDL levels, and the BMD in osteoporosis patients [10]. Moreover, CC genotype carriers had a lower risk of osteoporosis than TT genotype carriers in a Saudi population including 138 osteoporosis patients and 128 controls [11]. The CC genotype and C allele were associated with TC, LDL, HDL, T-score, Z-score and lower SAA1 levels in osteoporosis patients [11]. Our results suggest that the SAA1 rs12218 polymorphism is not associated with the risk of osteoporosis in a Chinese Han population involving 300 cases and 350 controls. Additionally, the CC genotype could not significantly change the SAA1 expression; this result stands in contrast with that reported by Feng et al. [10] study who found and increase, as well as to that reported by Abdu-Allah et al. [11], who found a decrease. We failed to find any significant association between the C allele and other clinical parameters (age, BMI, TC, LDL, HDL, and T-score). The disparities between previous studies and ours may be attributed to clinical heterogeneity, the use of different ethnic populations, and small sample sizes. Specifically, the C-allele frequencies of Asians were 0.189 [10] and 0.383 (the present study), which were significantly lower than that in Caucasians (0.734 [11]). This result may be reflected by the difference in the allele frequency of the SAA1 rs12218 polymorphism. Addtionally, the relatively small sample size may have underpowered the study performed by Abdu-Allah et al. [11]. Finally, the contradictions between our study and Feng et al. [10] may also be explained by the fact that environmental factors (e.g., geographic location and eating habits) also affect susceptibility to osteoporosis.
Three aspects of our results warrant explanation. For rs12218, the amino acid does not change when the nucleotide T is replaced with C. In general, this SNP does not contribute to the risk of osteoporosis. Additionally, the sites linked to the rs12218 polymorphism were found to be located in the intron region of the SAA1 gene and did not affect the binding of transcription factors or miRNAs to the SAA1 gene. For rs10832915, the CC genotype was associated with elevated levels of SAA1. We hypothesized that this polymorphism conferred susceptibility to osteoporosis by regulating the SAA1 level.
The present study has several potential limitations. First, selection bias may exist because all participants were from the same hospitals. Second, only three polymorphisms of the SAA1 gene were examined, and this did not completely cover the gene. Third, our results were affected by confounding factors such as drinking, smoking histories, and occupation. Finally, the sample size was moderate, which could lead to deviation from the true results.
In conclusion, the SAA1 rs10832915 polymorphism may be a genetic contributor to the risk of osteoporosis in the Chinese Han population. Nevertheless, this finding should be validated by further studies of larger populations and a functional evaluation of the polymorphisms.
Abbreviations
- BMD
bone mineral density
- BMI
body mass index
- CAD
coronary artery disease
- CI
confidence interval
- GO
gene ontology
- HDL
high-density lipoprotein
- HWE
Hardy–Weinberg equilibrium
- LDL
low-density lipoprotein
- OR
odds ratio
- SAA1
serum amyloid A
- SNP
single-nucleotide polymorphism
- TC
total cholesterol
Author contribution
Conceived and designed the experiments: Y.H. and N.X. Performed the experiments: X.Z. and J.L. Analyzed the data: X.Z., L.J. and D.Z. Contributed reagents/materials/analysis tools: L.W. Wrote the paper: X.Z., Y.H. and N.X.
Competing interests
The authors declare that there are no competing interests associated with the manuscript.
Funding
This work was supported in part by the National Natural Science Foundation of China [grant number 81702179].
References
- 1.Cummings S.R. and Melton L.J. (2002) Epidemiology and outcomes of osteoporotic fractures. Lancet 359, 1761–1767 10.1016/S0140-6736(02)08657-9 [DOI] [PubMed] [Google Scholar]
- 2.Chen P., Li Z. and Hu Y. (2016) Prevalence of osteoporosis in China: a meta-analysis and systematic review. BMC Public Health 16, 1039 10.1186/s12889-016-3712-7 [DOI] [PMC free article] [PubMed] [Google Scholar]
- 3.Origa R., Fiumana E., Gamberini M.R., Armari S., Mottes M., Sangalli A.. et al. (2005) Osteoporosis in beta-thalassemia: clinical and genetic aspects. Ann. N.Y. Acad. Sci. 1054, 451–456 10.1196/annals.1345.051 [DOI] [PubMed] [Google Scholar]
- 4.Berg K.M., Kunins H.V., Jackson J.L., Nahvi S., Chaudhry A., Harris K.A. Jr. et al. (2008) Association between alcohol consumption and both osteoporotic fracture and bone density. Am. J. Med. 121, 406–418 10.1016/j.amjmed.2007.12.012 [DOI] [PMC free article] [PubMed] [Google Scholar]
- 5.Urano T. and Inoue S. (2015) Recent genetic discoveries in osteoporosis, sarcopenia and obesity. Endocr. J. 62, 475–484 10.1507/endocrj.EJ15-0154 [DOI] [PubMed] [Google Scholar]
- 6.Fyfe A.I., Rothenberg L.S., DeBeer F.C., Cantor R.M., Rotter J.I. and Lusis A.J. (1997) Association between serum amyloid A proteins and coronary artery disease: evidence from two distinct arteriosclerotic processes. Circulation 96, 2914–2919 10.1161/01.CIR.96.9.2914 [DOI] [PubMed] [Google Scholar]
- 7.Zewinger S., Drechsler C., Kleber M.E., Dressel A., Riffel J., Triem S.. et al. (2015) Serum amyloid A: high-density lipoproteins interaction and cardiovascular risk. Eur. Heart J. 36, 3007–3016 [DOI] [PubMed] [Google Scholar]
- 8.Lakota K., Mrak-Poljsak K., Bozic B., Tomsic M. and Sodin-Semrl S. (2013) Serum amyloid A activation of human coronary artery endothelial cells exhibits a neutrophil promoting molecular profile. Microvasc. Res. 90, 55–63 10.1016/j.mvr.2013.07.011 [DOI] [PubMed] [Google Scholar]
- 9.Lee S.N., Cho J.Y., Eun Y.M., Song S.W. and Moon K.W. (2016) Associations between osteoporosis and coronary artery disease in postmenopausal women. Climacteric 19, 458–462 10.1080/13697137.2016.1200550 [DOI] [PubMed] [Google Scholar]
- 10.Feng Z.P., Li X.Y., Jiang R., Deng H.C., Yang M., Zhou Q.. et al. (2013) Associations of SAA1 gene polymorphism with lipid lelvels and osteoporosis in Chinese women. Lipids Health Dis. 12, 39 10.1186/1476-511X-12-39 [DOI] [PMC free article] [PubMed] [Google Scholar]
- 11.Abdu-Allah A.M., Tarhouny S.A. and Baghdadi H.H. (2015) Serum amyloid a gene polymorphism and its association with lipid profile in Saudi females with osteoporosis. Pak. J. Med. Sci. 31, 1124–1129 10.12669/pjms.315.7981 [DOI] [PMC free article] [PubMed] [Google Scholar]
- 12.Gong J., Mei S., Liu C., Xiang Y., Ye Y., Zhang Z.. et al. (2018) PancanQTL: systematic identification of cis-eQTLs and trans-eQTLs in 33 cancer types. Nucleic Acids Res. 46, D971–D976 10.1093/nar/gkx861 [DOI] [PMC free article] [PubMed] [Google Scholar]
- 13.Siggelkow H., Etmanski M., Bozkurt S., Grobeta P., Koepp R., Brockmoller J.. et al. (2014) Genetic polymorphisms in 11beta-hydroxysteroid dehydrogenase type 1 correlate with the postdexamethasone cortisol levels and bone mineral density in patients evaluated for osteoporosis. J. Clin. Endocrinol. Metab. 99, E293–E302 10.1210/jc.2013-1418 [DOI] [PubMed] [Google Scholar]
- 14.Deng F.Y., Lei S.F., Chen X.D., Tan L.J., Zhu X.Z. and Deng H.W. (2011) An integrative study ascertained SOD2 as a susceptibility gene for osteoporosis in Chinese. J. Bone Miner. Res. 26, 2695–2701 10.1002/jbmr.471 [DOI] [PMC free article] [PubMed] [Google Scholar]
- 15.Lee S., Bacha F., Gungor N. and Arslanian S. (2008) Comparison of different definitions of pediatric metabolic syndrome: relation to abdominal adiposity, insulin resistance, adiponectin, and inflammatory biomarkers. J. Pediatr. 152, 177–184 10.1016/j.jpeds.2007.07.053 [DOI] [PubMed] [Google Scholar]
- 16.D’Amelio P., Pescarmona G.P., Gariboldi A. and Isaia G.C. (2001) High density lipoproteins (HDL) in women with postmenopausal osteoporosis: a preliminary study. Menopause 8, 429–432 10.1097/00042192-200111000-00008 [DOI] [PubMed] [Google Scholar]
- 17.Cai H., Song C., Endoh I., Goyette J., Jessup W., Freedman S.B.. et al. (2007) Serum amyloid A induces monocyte tissue factor. J. Immunol. 178, 1852–1860 10.4049/jimmunol.178.3.1852 [DOI] [PubMed] [Google Scholar]
- 18.Sun L., Zhou H., Zhu Z., Yan Q., Wang L., Liang Q.. et al. (2015) Ex vivo and in vitro effect of serum amyloid a in the induction of macrophage M2 markers and efferocytosis of apoptotic neutrophils. J. Immunol. 194, 4891–4900 10.4049/jimmunol.1402164 [DOI] [PMC free article] [PubMed] [Google Scholar]
- 19.Lacativa P.G. and Farias M.L. (2010) Osteoporosis and inflammation. Arq. Bras. Endocrinol. Metabol. 54, 123–132 10.1590/S0004-27302010000200007 [DOI] [PubMed] [Google Scholar]
- 20.Wang B.Y., Hang J.Y., Zhong Y. and Tan S.J. (2014) Association of genetic polymorphisms of SAA1 (rs12218) with myocardial infarction in a Chinese population. Genet. Mol. Res. 13, 3693–3696 10.4238/2014.May.9.13 [DOI] [PubMed] [Google Scholar]
- 21.Xie X., Ma Y.T., Yang Y.N., Li X.M., Zheng Y.Y., Liu F.. et al. (2015) Genetic polymorphisms of serum amyloid A1 and coronary artery disease risk. Tissue Antigens 85, 168–176 10.1111/tan.12516 [DOI] [PubMed] [Google Scholar]
- 22.Campbell D.B., Gordon B.H. and Ings R.M. (1985) Pharmacodynamic and pharmacokinetic interactions of almitrine bismesylate. Rev. Mal. Respir. 2, S39–S44 [PubMed] [Google Scholar]


