

Abstract
The most direct way to estimate the shelf life of a product is to conduct simulation tests which are time consuming and expensive. Conversely, accelerated shelf life tests can be successfully used for stable products having long expected shelf life. The aim of the study was directed to verify the possibility to apply an accelerated shelf life test to perishable food products having a short-expected shelf life, such as a new ready-to-eat processed food preparation, composed mainly by cereals, tuna and chicken, packed in thermo-sealed trays and pasteurised. Different samples of the product were stored in thermal abuse conditions, collected periodically and subjected to determinations of TVB-N, pH and sensorial characteristics. Q10 and activation energy were calculated allowing to obtain a predictive evaluation of the product shelf life at the 4°C recommended temperature. The product shelf life was assessed at 26 days vs the 30 days expected by the manufacturer, showing the possibility to apply successfully ASLT for products having short shelf life, saving both time and money.
Key words: Accelerated shelf life test, RTE food, Spoilage
Introduction
All sectors of the food and drink industry are under increasing pressure to rapidly develop and launch new and innovative products to maintain market share. Part of the product development cycle is to set a suitable shelf life. For ambient stable products with long shelf life, commercial pressure means it is rarely feasible for full shelf life evaluations to have been completed prior to product launch (Campden Bri, 2014). For the chilled foods sector, although the shelf lives are much shorter, they might extend to weeks and it has been demanded to determine the shelf-life in less than half of this time or shorter. In accelerated shelf life tests, the chemical, biochemical and microbiological changes may be induced in shorter time, that it would not otherwise occur. All foods are composed by biological material undergoing to degradation or spoilage beyond a certain period of time; this deterioration belongs to that processes that cannot be fully blocked. The shelf life is the time in which the product remains, after manufacture and packing, safe and suitable to use, in defined storage conditions. The food product must preserve in that period its own chemical, physical, microbiological and sensorial characteristics and, where appropriate, comply with any label declaration of nutritional information when stored according to the recommended conditions (Man, 2002). The shelf life is then the amount of time in which a food product is considered acceptable for consumption when stored at the appropriate storage conditions. According to Regulation (UE) 1169/2011, “in the case of foods which, from a microbiological point of view, are highly perishable and are therefore likely after a short period to constitute an immediate danger to human health, the date of minimum durability shall be replaced by the ‘use by’ date”. Therefore, according to the in force EU legislation, the shelf life, called “date of minimum durability”, is applicable to foods that are not highly perishable and do not constitute an immediate danger to human health.
Shelf life is commonly estimated by two different stability testing procedures: realtime stability tests and accelerated stability tests. In real-time stability testing, a product is stored at recommended storage conditions and monitored until it fails the specification. In accelerated stability tests, a product is stored at elevated stress conditions (such as temperature, humidity, and pH). Degradation at the recommended storage conditions can be predicted using known relationships between the acceleration factor and the degradation rate. Temperature is the most common acceleration factor used for chemicals, pharmaceuticals, and biological products because its relationship with the degradation rate is characterized by the Arrhenius equation. The Arrhenius equation is a formula for the temperature dependence of reaction rates that has a vast and important application in determining rate of chemical reactions and calculation of the energy of activation (Laidler, 1987). The degradation rate depends on the activation energy for the chemical reaction and it is product specific. We don’t always have to deal with higherorder equations; in many cases, the observed responses of different orders of reactions are indistinguishable for products that degrade slowly. Each product has a specific mode of spoilage (i.e. rancidity, moisture loss/gain, organoleptic changes), so every study is tailored to the specific product. In this study, a shelf life determination (ASLT) was performed to evaluate the date of minimum durability (Regulation EU 1169/2011) of a new ready-to-eat processed food preparation, packed in thermo-sealed trays and pasteurised, considering food safety as a prerequisite. The product was ready to launch in the market and the manufacturer was very hurrying, needing the shelf life test results as soon as possible, in order to answer to the market demand, especially large-scale retail. The aim of the study was then directed to verify the possibility to perform an accelerated shelf life test to perishable products, such as the ready to use one, having a short-expected shelf life.
Materials and Methods
The ready-to eat culinary food preparation was a three cereals salad with tuna and chicken. The preparations has the following ingredients as reported in the product labelling: cooked spelt, cooked barley, cooked rice, water, 6% tuna, sunflower oil, 5% chicken fillets, olive oil, green pea, bell pepper, salt, black bean, olives, carrot, onion, Provolone cheese, celery, milk protein, butter, potato starch, flavouring, wheat starch, black pepper, dextrose, fructose, emulsifiers: E331-E452, stabilizer: E450, acidity regulator: E330, antioxidant: rosemary extract. The processed preparation was packed in 1 kg thermo-sealed trays, pasteurised and chill-stored.
The pasteurisation process was performed at a temperature of 90°C for 20 minutes and the packages were blast chilled and stored at a temperature of 0-4°C. Microbiological characterisation of the product was achieved in three different batches analysing total microbial count (UNI EN ISO 4833-1:2013), Escherichia coli (AFNOR AES 10/06-01/08), coagulase- positive staphylococci (UNI EN ISO 6888-2:2004), Listeria monocytogenes (ISO 11290-2:2005), Salmonella spp. (ISO 18593:2004), Bacillus cereus (UNI EN ISO 7932:2005), sulphite reducing clostridia (Tryptose Sulphite Cycloserine Agar; 37°C - 24 h), coliforms (AFNOR BRD - 07/08-12/04) and mould (Dichloran Rose Bengala Chloramphenicol Agar; 25°C - 5 days).
The accelerated shelf life evaluation was conducted on three different batches and seven just finished products ready to market of each batch were planned to be used. For each batch, one of the packages was immediately analysed and the other six stored in thermal stress conditions, at the following temperatures: one at 25±0.5°C; two at 18±0.5°C; three at 12±0.5°C. One of the packages stored at different temperatures was collected at different time according to the sampling plan shown in Figure 1, where sampling is indicated by an “X”. Each collected sample belonging to the seven packages per batch was analysed three times, for a total of nine data points for each sample stored in abused temperature (total of planned analyses = 7 products x 3 batches x 3 analysis = 63), for total basic volatile nitrogen (TVB-N) according to Rapporti Istisan 96/34 (1996), and pH in accordance with Nundy (2003). On each sample, sensory evaluations, based on aspect, texture, colour, odour and aroma, were also performed by a team of five trained persons, following a hedonic scale from 6 to 0 (6, original characteristics; 5, very light, not significant changes; 4, changes at the limit of significance; 3, light but significant changes; 2, significant changes; 1, very significant changes; 0, very high significant changes). After evaluation of the normal distribution of data using Shapiro-Wilk test, the TVB-N and pH levels obtained in each sample collected during the shelf life study, at both different time and various storage temperatures as shown in Figure 1, were statistically compared with the starting values using the one-way analysis of variance (ANOVA) and considered significant with P≤0.05 (Little and Hills 1978; Ballatori 1988).
Figure 1.
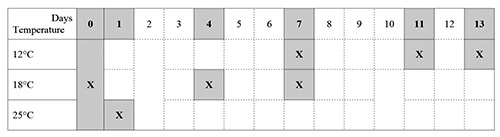
Sampling plan of the shelf life study.
A linear regression curve for Arrhenius plot (inverse Kelvin temperature vs natural logarithm of the time of decay, based on sensorial evaluation and/or analytical results) was performed so as to achieve a predictive calculation of the product shelf life at the 4°C recommended temperature.
The predictive model was validated over time on many different products, storing one food package at the recommended temperature and evaluating at the end of the calculated shelf life the food characteristics. In this study, a further validation was also achieved on the processed ready-to-eat food preparation, performing on the product stored a 4°C, at the end of the obtained shelf life, determination of sensory properties and TVB-N and pH values of three samples per batch, for three batches, with a total of nine analysed samples.
Results and Discussion
In the present study, the shelf life was assessed on an RTE three cereals salad with tuna and chicken, packed in thermo-sealed trays and pasteurised. The most direct way to estimate the shelf life of a product is to conduct simulation or real-time stability test that corresponds to the time of decay of a food under optimum storage conditions. Such an approach requests the constant analyses of some indicator parameters chosen in accordance with the type of food until the degradation of the product is reached. A simulation approach is time consuming and expensive, especially for certain types of products. Conversely, ASLT can be successfully used; with this approach, food is subjected to high temperature stress thus requiring lower costs and time in order to produce results (Haouet et al., 2006, 2008). For a shelf life study, indicators of decay must be chosen and analysed, and not all possible microbiological, chemical and physical properties must be considered. To conduct a feasible and sustainable shelf life study, only some fast, reliable and useful indicators must be chosen. In the present study, only TVB-N and pH are chosen to be analysed to disclose respectively proteolytic and fermentation processes and not all the factors and microorganisms that can be responsible of these processes. For the microbiological characterization, total microbial count was on average 5000 UFC/g while the other analysed bacteria were all not detected (<10 UFC/g). In the manufacturing HACCP system, pasteurisation temperature and time are listed among the critical control points, and analysis of Listeria, Salmonella and B. cereus are planned to be performed at each batch and must be as not detected.
Table 1 reports the results of TVB-N, pH, and sensory evaluation (hedonic scale) during the accelerated shelf life test. The samples planned to be collected after 13 days storage at 12°C were not evaluated as the products were already spoiled. Enzymatic and bacteriologic activity in food can rapidly decrease the protein content and quality, which causes products to be stale; some trimethylamine, dimethylamine and volatile bases are produced, which together are called TVB-N (Fallah et al., 2015). TVB-N is used as indicator of protein degradation, with the release into the middle of protein metabolites including some volatile ammines, especially ammonia, and it can be used potentially as indicator of toxic molecules including histamine, putrescine, tyramine, and tryptamine, generated by the high temperature reached by the product (Yang et al., 2017). The increase in TVB-N should therefore be progressive over time and is affected by several factors, including the natural or forced aging of the product. Regarding pH values, it was observed a strong decrease of the values, all significant when compared with the starting level (P≤0.001), that indicates an acidification attributable to a cereal fermentation phenomenon and, especially, the sugars present therein. It seems that the thermal treatment applied during pasteurisation is not sufficient to inactivate totally the microbial flora of the product and it is possible that a lactic acid fermentation was mainly carried out by lactic acid bacteria (Soni and Sandhu, 1990; McKay and Baldwin, 1990). The type of bacterial flora developed in each fermented food depends on the water activity, pH, salt concentration, temperature and food matrix composition. Most fermented foods, including the major products that are common in the western world, as well of many of those from other sources that are less well characterised, are dependent on lactic acid bacteria to mediate the fermentation process (Conway, 1996). Lactic acid fermentation contributes towards the safety, nutritional value, shelf life and acceptability of a wide range of cereal based foods (Oyewole, 1997). However, although fermentation may be seen as a simple and economical way of improving nutritional value, sensory properties, and functional qualities of cereals (Campbell-Platt 1994; Blandino et al., 2003), the occurred modifications must be considered herein as a product decay. Finally, sensory analysis reflected in some way the results of physicochemical analyses. It should be noted that the changes observed in all the samples after production and packaging show a more or less significant decay of the product. However, while those observed after 4 and 7 days, respectively at the storage temperatures in thermal abuse of 18°C and 12°C, are at the limit of significance, changes after 7 and 11 days at the same temperatures are very profound and extremely significant. The time of product decay was then assessed at 4 and 7 days at these temperatures respectively (18°C and 12°C). On the basis of sensorial evaluations and analytical results, the product decay was assessed at one, four and seven days, respectively at the storage temperature of 25°C, 18°C and 12°C.
Table 1.
TVN (mg/100 g) and pH: means and standard errors (SE).
| Sampling, day | Storage temperature, °C | TVB-N | pH | Sensorial evaluation, scale | ||
|---|---|---|---|---|---|---|
| Mean | SE | Mean | SE | |||
| 0 | 8.0a | 0.4 | 6.08a | 0.003 | 6 | |
| 1 | 25 | 15.0b | 0.9 | 6.18b | 0.003 | 1 |
| 4 | 18 | 18.2c | 0.6 | 5.28c | 0.003 | 3-4 |
| 7 | 18 | 20.1d | 0.7 | 5.03d | 0.003 | 0 |
| 7 | 12 | 13.8b | 0.6 | 5.99e | 0.004 | 3-4 |
| 11 | 12 | 17.4c | 0.5 | 5.42f | 0.004 | 1 |
abcSignificant differences at P≤0.001
Figure 2 shows the time / temperature tolerance and Figure 3 shows the Arrhenius plot by which the behaviour of the model used for the predictive mathematical calculation system was evaluated. In these figures, it can be observed that the coefficients of correlation were 0.998 and 0.957 respectively. In the present accelerated shelf life study, the used indicators are in good agreement and can be used for the shelf life modelling (Figure 3; Arrhenius plot). When the temperature range of concern is relatively narrow then the shelf life of a product can be determined using the log shelf life model (Labuza and Fu, 1993). For a temperature difference from 20 to 30°C, a simple plot of the log time to reach some value N (e.g. shelf life) vs. temperature is also a fairly good straight line. The equation takes the form of ts = t0 exp(-bT), where ts is the shelf life at temperature T (°C), t0 is the shelf life at 0°C, and b is the slope of ln ts vs. T. (Shimoni and Labuza, 2000).
Figure 2.
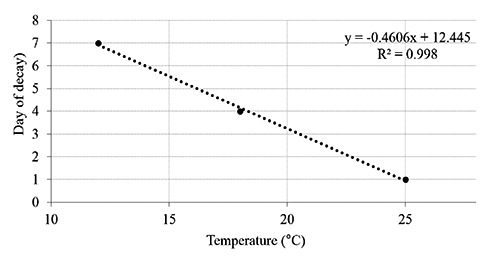
Linear regression curve for the tolerance time/temperature.
Figure 3.
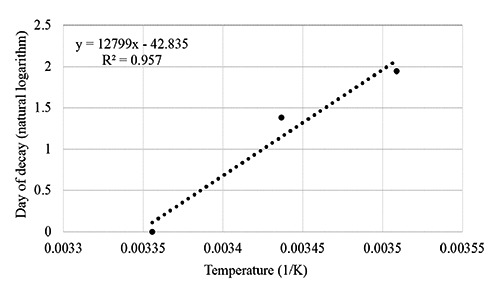
Linear regression curve for Arrhenius plot.
The graphical resolution of the above equation allows also the calculation of the Q10, i.e. the increase in rate for a 10°C increase in temperature from the following equation: Q10 = exp(10b), where b is the slope of each regression line, reported in the first equation (Shimoni and Labuza, 2000; Limbo et al., 2010). Following this procedure, in the present study Q10 resulted of 4.53 and the Ea 105.58 kj. Then, on the base of the Q10 and Ea results, a shelf-life of 26 days at the recommended temperature of 4 °C has been established for the ready-to-eat processed food preparation, packed in thermo- sealed trays and pasteurised. As for the protocol validation, results were 9.0±0.5 mg/100 g for TVB-N and 6.10±0.04 for pH (mean±SE), while sensory evaluation was 6. Then no significant differences were observed when compared with the original characteristics of the product.
Conclusions
Most food spoilage can be explained by one or more different mechanisms (IFST, 1993). Storing the packaged product under typical storage conditions and investigating shelf life test is costly and time-consuming (Hao et al., 2016). Further, time and temperature are crucial factors affecting the quality of foods and the accelerated shelf life determinations are particularly useful when the pattern of changes is practically identical during normal and accelerated storage so that shelf life under normal storage can be predicted with a high degree of certainty (Labuza, 1982; Labuza and Schmidel, 1985).
In the present study, an ASLT was carried out to assess the durability or best before dates of a new ready-to-use food preparation, packed in thermo-sealed trays and pasteurised. Only TVB-N, as expression of nitrogen spoilage, and pH, that reflects fermentation phenomena of cereals, were taken into account as fast, reliable and useful indicators, together to sensory evaluations, to disclose variations of the specific properties. Seven packages of the product were planned to be used to achieved the study, but six of them were enough to be analysed and conclude the shelf life test, as the obtained time of decay was lower than that expected. ASLT allows to obtain a date of durability in a shorter period of time when compared to simulation tests. In the present study, only eleven days and six samples for analytic determinations can be necessary. In this experimentally test, 54 determinations for each analyte were achieved, as three batches with three independent determinations, not required in routine activities, were performed.
The manufacturer assessed a shelf life of 30 days vs the 26 days obtained herein, and the present study shows the possibility to apply successfully ASLT for products having a short-expected shelf life, saving time and allowing to plan and conduct studies, to ensuring food safety during all the shelf life as requested by Regulation 2073/2005, in a shorter period of time.
Funding Statement
Funding: none.
References
- Ballatori E, 1988. Statistica e metodologia della ricerca. 391 Galeno Ed, Perugia. [Google Scholar]
- Blandino A, Al-Aseeri ME, Pandiella SS, Cantero D, Webb C, 2003. Cereal-based fermented foods and beverages. Food Res Int 36:527-543 [Google Scholar]
- Campden Bri, 2014. Setting product shelf life. From March 2014 newsletter. Available from: https://www.campdenbri.co.uk/news/setting-food-product-shelf-life.php. [Google Scholar]
- Campbell-Platt G, 1994. Fermented foods: a world perspective. Food Res Int 27:253. [Google Scholar]
- Conway PL, 1996. Selection criteria for probiotics microorganisms. Asia Pac J Clin Nutr 5:10-14. [PubMed] [Google Scholar]
- European Commission, 2005. Commission Regulation (EC) No 2073/2005 of 15 November 2005 on microbiological criteria for foodstuffs. In: Official Journal, L 338/1, 22.12.2005. [Google Scholar]
- European Parliament and of the Council, 2011. Regulation of 25 October 2011 on the provision of food information to consumers, amending Regulations (EC) No 1924/2006 and (EC) No 1925/2006 of the European Parliament and of the Council, and repealing Commission Directive 87/250/EEC, Council Directive 90/496/EEC, Commission Directive 1999/10/EC, Directive 2000/13/EC of the European Parliament and of the Council, Commission Directives 2002/67/EC and 2008/5/EC and Commission Regulation (EC) No 608/2004, 1169/2011/EU. In: Official Journal, L 304/18, 22.11.2011. [Google Scholar]
- Fallah F, Ebrahimnezhad Y, Maheri-Sis N, Ghasemi-Sadabadi M, 2016. The effect of different levels of diet total volatile nitrogen on performance, carcass characteristics and meat total volatile nitrogen in broiler chickens. Arch Anim Breed 59:191-9. [Google Scholar]
- Hao F, Lu L, Wang J, 2016. Finite Element Simulation of Shelf Life Prediction of Moisture-Sensitive Crackers in Permeable Packaging under Different Storage Conditions. J Food Proc Preserv 40:37-47. [Google Scholar]
- Haouet MN, Altissimi MS, Blasi G, Petruzzelli A, Scuota S, Cenci T, 2006. Shelf life assessment and prediction of traditional food of Central Italy. Ital J Food Sci S1. [Google Scholar]
- Haouet MN, Altissimi MS, Scuota S, Cenci T, 2008. Spoilage mechanisms evaluation to predict the shelf life of fresh cheeses. Ital J Food Sci S1. [Google Scholar]
- IFST 1993. Shelf life of foods. Guidelines for its determination and prediction. Institute of Food Science and Technology (UK), London. [Google Scholar]
- Labuza TP, 1982. Open Shelf Life Dating of Foods. Food and Nutrition Press. [Google Scholar]
- Labuza TP, Fu B, 1993. Growth kinetics for shelf-life prediction: Theory and practice. J Industr Microbiol 12:309-23. [Google Scholar]
- Labuza TP, Schimdl MK, 1985. Accelerated shelf life of foods. Food Technol 39:57-134. [Google Scholar]
- Labuza TP, Schmidl MK, 1985. Accelerated shelf-life testing of foods. Food Technol 39:57-62, 64, 134. [Google Scholar]
- Laidler KJ, 1987. Chemical Kinetics, Third Edition, Harper & Row, 42. [Google Scholar]
- Limbo S, Torri L, Sinelli N, Franzetti L, Casiraghi E, 2010. Evaluation and predictive modeling of shelf life of minced beef stored in high-oxygen modified atmosphere packaging at different temperatures. Meat Sci 84:129-36. [DOI] [PubMed] [Google Scholar]
- Little TM, Hills FJ, 1978. Agricultural experimentation: design and analysis. 31. John Willey and sons, New York. [Google Scholar]
- Man D, 2002. Food Industry Briefing Series: Shelf life. Blachwell Science Ltd Ed; UK. [Google Scholar]
- McKay LL, Baldwin KA, 1990. Applications for biotechnology: present and future improvements in lactic acid bacteria. FEMS Microbiol Rev 87:3-14. [DOI] [PubMed] [Google Scholar]
- Nundy Dev C, 2003. Compendium of Analytical Methods, Volume 2. Determination of the pH of foods including foods in hermetically sealed containers. MFHPB-03. Health Canada, Food Section, Ottawa Laboratory (Carling), Canadian Food Inspection Agency. http://www.hc-sc.gc.ca/fn-an/resrech/analy-meth/microbio/volume2/mfhpb03-01-eng.php. [Google Scholar]
- Oyewole OB, 1997. Lactic fermented foods in Africa and their benefits. Food Control 8:289-97. [Google Scholar]
- Pauling LC, 1988. General Chemistry, Dover Publications Port, CT. [Google Scholar]
- Rapporti ISTISAN 96/34, 1996. Azoto basico volatile (TVN) in Metodi di analisi utilizzati per il controllo chimico degli alimenti. Istituto Superiore di Sanita, 15-16. [Google Scholar]
- Shimoni E, Labuza TP, 2000. Modeling pathogen growth in meat products: Future challenges. Trends Food Sci Technol 11:394-402. [Google Scholar]
- Soni S K, Sandhu DK, 1990. Indian fermented foods: microbiological and biochemical aspects. Indian J Microbiol 30:135-57. [Google Scholar]
- Steele R, 2004. Understanding and measuring the Shelf life of food. Woodhead Publishing Limited, Cambridge England. [Google Scholar]
- Yang Q, Sun DW, Cheng W, 2017. Development of simplified models for nondestructive hyperspectral imaging monitoring of TVB-N contents in cured meat during drying process. J Food Eng 192:53-60. [Google Scholar]