Abstract
Assessing the potential health risks for newly developed nanoparticles poses a significant challenge. Nanometer-sized particles are not generally detectable with the light microscope. Electron microscopy typically requires high-level doses, above the physiologic range, for particle examination in tissues. Enhanced dark-field microscopy (EDM) is an adaption of the light microscope that images scattered light. Nanoparticles scatter light with high efficiency while normal tissues do not. EDM has the potential to identify the critical target sites for nanoparticle deposition and injury in the lungs and other organs. This study describes the methods for EDM imaging of nanoparticles and applications. Examples of EDM application include measurement of deposition and clearance patterns. Imaging of a wide variety of nanoparticles demonstrated frequent situations where nanoparticles detected by EDM were not visible by light microscopy. EDM examination of colloidal gold nanospheres (10–100 nm diameter) demonstrated a detection size limit of approximately 15 nm in tissue sections. EDM determined nanoparticle volume density was directly proportional to total lung burden of exposed animals. The results confirm that EDM can determine nanoparticle distribution, clearance, transport to lymph nodes, and accumulation in extrapulmonary organs. Thus, EDM substantially improves the qualitative and quantitative microscopic evaluation of inhaled nanoparticles.
Keywords: fibrosis, inhalation, nanoparticles, nanotechnology, pathology, toxicology
In recent years, there has been a dramatic development in new forms of engineered materials, which measure nanometers in at least 1 dimension. These nanomaterials have new and unique properties. For instance, carbon nanotubes are composed of one or more cylindrical sheet(s) of carbon atoms and range from 4 to 100 nm in diameter. This unique nanostructure has the strength of steel and is ultralight in weight compared to aluminum. When carbon nanotubes are added to a mixture of epoxy or plastics, the resulting composite material is stronger than the equivalent steel or aluminum structure and weighs significantly less. Parts made by this process can be used to make automobiles significantly lighter and thus allow car manufacturers to meet future United States Environmental Protection Agency gas mileage standards. There are numerous applications for other nanoparticles being researched or applied to commercial products. For instance, many current sunscreen products contain nanometer-sized titanium dioxide, as it is a much more efficient sunscreen than prior formulations. Determining the health risks due to inhalation of these new products poses a significant challenge. Because of the small size of nanoparticles and their unique physical–chemical structures, there is a concern that inhalation of nanoparticles may have unique toxic effects in the lungs and/or move from the lung to other organs of the body. Thus, detection and measurement of nanoparticles in the lungs and extrapulmonary organs is fundamental to investigating their potential toxic effects.
Traditionally, micron-dimensioned particles in the lungs of exposed animals are easily detected and measured. This is due to the efficient phagocytosis of these particles in the lungs by alveolar macrophages. In these conditions, detection and study of the particles is reduced to detection of the alveolar macrophages that concentrate and potentially clear the particles from the lungs. Sampling of alveolar macrophages with a light microscope is relatively simple, as alveolar profiles typically also contain the profile of an alveolar macrophage. For instance, there are 4.2 million alveoli in a mouse lung (Mercer, Russell, and Crapo 1994a) and 3.9 million alveolar macrophages (Stone et al. 1992) or roughly 1 alveolar macrophage per alveolus. A typical 5-μm thick paraffin section used in light microscopy samples approximately 10% of the average alveolar diameter of the mouse lung (Mercer, Russell, and Crapo 1994a) and is likely to contain the profile of an alveolar macrophage. Thus, when the lungs are sectioned for light microscopy, the numerous alveolar profiles will frequently contain an alveolar macrophage profile and particles for study.
Nanoparticles deposited in the lungs are not necessarily concentrated within alveolar macrophages. The huge increase in numbers of free nanoparticles (nonmacrophage associated) observed in the lung following a typical nanoparticle exposure may result from incomplete phagocytosis. Study of these free nanoparticles can be difficult because the individual nanoparticles are below the limits of both detection and resolution by the light microscope. Free nanoparticles may gain entry into the alveolar interstitium, stimulate fibrogenic responses, and/or enter into the lymphatic drainage of the lungs as singlet particles (Choi et al. 2010; Mercer et al. 2013b). Detection of these individual particles is critical to identification of potential mechanism(s) of injury. However, as will be demonstrated in this work, traditional light microscopy is not capable of detecting individual nanoparticles in the lungs or other tissues. Other imaging methods such as the transmission electron microscopy (TEM) or scanning electron microscopy (SEM) have the requisite resolution to detect nanoparticles at high magnification (typically 5,000× or greater). However, sampling statistics for the small field of view in TEM and SEM are much less favorable for detection of particles even in the case where the particles are concentrated in alveolar macrophages. A TEM section may contain 100 or more alveolar profiles, but it is typically only 60- to 100-nm thick, so the number of alveolar macrophage profiles per alveolus is dramatically reduced. This sampling problem is compounded in the case of nanoparticles, which escape phagocytosis and must be examined in tissue sections of experimental animals following exposures relevant to humans.
Enhanced dark-field microscopy (EDM) is a light microscope adaptation that is well suited to detect, image, and measure the distribution of nanoparticles in the lungs and extrapulmonary tissues. A number of studies have reported the use of EDM to study specific cases of nanoparticles following exposure in the lungs (Ma et al. 2014, 2015; McKinney et al. 2012; Mercer et al. 2013b; Roberts et al. 2016; Shvedova et al. 2008; Sisler et al. 2016a; Barry et al. 1988; Roberts et al. 2013). With the exception of Roth et al. (2015) who examined a range of metal oxide nanoparticles, these studies have been limited to detection and imaging of nanoparticles in the lungs. We have used EDM to study the accumulation of several different nanoparticles in the tracheobronchial lymph nodes which drain the lungs (Ma et al. 2014; McKinney et al. 2012; Mercer et al. 2013b; Shvedova et al. 2008; Sisler et al. 2016a) and in the case of multiwalled carbon nanotubes (MWCNTs) measured their accumulation in extrapulmonary organs (Mercer et al. 2013b).
The objective of this work is to further describe how the EDM can be used to (1) detect individual nanoparticles in tissue sections and (2) make quantitative measurements of the distribution of the nanoparticles in tissue sections. The study provides representative images of a variety of nanoparticles using this new form of microscopy, gives a general description of optical properties that make nanoparticles optimal targets for imaging by EDM, describes the necessary methods of tissue preparation, illustrates the factors important for efficient tissue sampling, describes common problems encountered in imaging nanoparticles by EDM, and provides examples where this technique has been used to study nanoparticle distribution and dynamics in the body.
Background
The selection of scattered light for use in imaging of nanoparticles is based on a number of inherent optical properties of nanoparticles, which results in significantly greater scattering of light by nanoparticles than by tissues. These properties include the characteristic dimension of the particle (d), the wavelength of light (λ), and the differences between the refractive index of the particle versus the tissue/embedding media refractive indexes (ηparticle and ηtissuea). These characteristics are given in the Rayleigh light scattering approximation, which describes the scattering of light by spheres that are much smaller than the wavelength of light. A proportionality for this relationship, given in equation (1), shows the relative contributions of each factor to the (van de Hulst 1957) ratio of scatter light (I) versus incident light (I0). Where the constant k reflects the distance of the source from the tissue section and the angle of incident. The Rayleigh light scattering approximation is not accurate for particles greater than approximately 10% of the wavelength of light and thus is not strictly applicable to nanoparticles greater than approximately 50 nm (van de Hulst 1957). However, it can serve as a guide in assessing the suitability of EDM for a newly developed nanoparticle and in optimizing the conditions for examination.
| (1) |
As indicated in equation (1), the relative ratio of refractive index of the particle to the tissue/media is a key element in determining the intensity of scattered light. The refractive index of the tissue and embedding medium in a light microscope are closely matched being 1.55 for tissue and 1.52 for a typical embedding medium. The refractive index of nanoparticles is generally much higher. For instance, the refractive index of graphite (the base material of carbon nanotubes) is 2.25 at λ = 550 nm (Wang 2004). On the other hand, the refractive index of 1.59 at λ = 550 nm for polystyrene beads (Ma et al. 2003) is not significantly different from that of the embedded tissue section. Due to the closer matching of refractive index to that of tissue, the lower refractive index of polystyrene beads produces significantly dimmer images. The refractive index given in equation (1) is generally wavelength dependent. However, over a narrow visible range of wavelengths (400–1,000 nm), the changes in refractive index are minor compared to the difference between the particle and tissue refractive index. Further, substantial differences in light intensity between wavelengths are required over this narrow range to produce difference in perceived color. Thus, most nanoparticles observed by EDM appear white. Notable exceptions are diesel exhaust particles (DEPs) and welding fumes, which demonstrate a varied range of particle color, and the mix of white and black regions for graphene nanoparticles, which has an anisotropic refractive index.
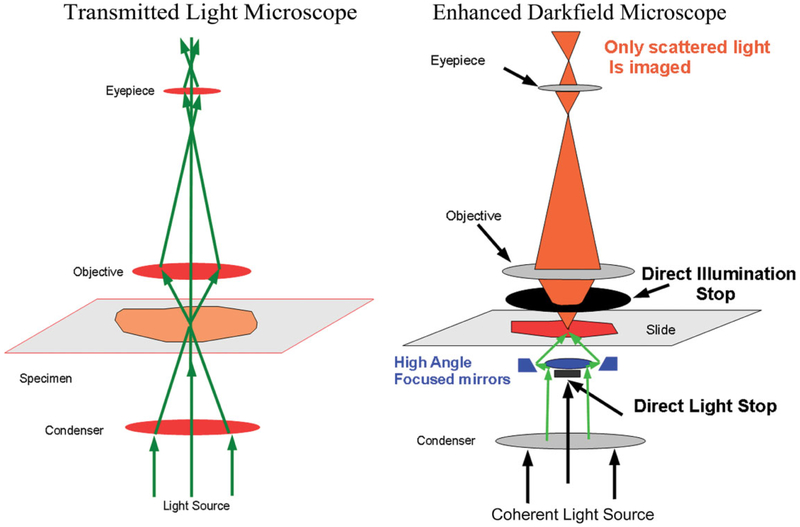
Imaging this difference in scattered light between tissue and nanoparticles is generally accomplished by significant alterations in the optical components of a traditional transmission light microscope. The EDM contains optical components, which specifically select scattered light components from the illuminated tissue sample, while blocking the light observed in a traditional transmission light microscope. The diagram of the light path of a traditional transmission light microscope (on the left side of Figure 1) illustrates how light is focused by a substage condenser on a tissue section and then imaged by the upper stage optics (objective and eyepiece). Scattered light deviates from this straight-line trajectory in traditional light microscopy. In a traditional light microscope, scattered light blurs the contrast between elements in the tissue section, and its minimization is one of the design goals in the development of a traditional microscope system. For instance, light is scattered when the rays of light pass from one region of refractive index to another. To minimize this source of light scattering in a traditional microscope, the tissue section is infiltrated in a coverslipping medium with a refractive index closely matching that of tissue. In addition, the optical elements may include low dispersion optical glasses, and the entire interior of the optical mounting surfaces is coated with a light absorbing material in order to prevent scattered light reflections from entering the image plane.
Figure 1.
Comparison of light paths in traditional transmission light microscope and enhanced dark-field microscopy (EDM). The green arrows in the image of the left figure illustrate the light path for a traditional transmission light microscope. In the optics of the EDM, illustrated on the right side of the image, the substage light source is reflected by a cardioid annular condenser mirror to focus the illumination at a high angle of incidence on the tissue section. At this high angle of incidence, transmitted light passing through the tissue section is blocked by the direct illumination stop. The light reaching the eyepiece or camera is restricted. Only light which is scattered due to passage through a submicron particle, whose refractive index differs significantly from the refractive index of the tissue section, will be imaged.
EDM essentially flips the roles by using only scattered light in the image formation process and efficiently eliminates transmitted or straight-line trajectory light from entering into the image formation process. As illustrated in Figure 1, this is accomplished by a special substage mirrored surface that projects the illumination light source at such an oblique angle that the direct rays passing through the specimen are completely blocked by the adjustable aperture of the objective lens. We note that earlier dark-field microscopes used a simple substage illumination system with a central disk to block the direct illumination and an above stage annular ring. While these systems work on the same general principle as the EDM, the elimination of transmitted straight-line trajectory light is not as efficient as the EDM. In addition, the EDM optical light source uses a high intensity coherent light source that enhances the resolution and eliminates the problem of low light intensity noted in the earlier dark-field microscopes. Further, the EDM is set up to focus the substage light on a narrow plane, which corresponds to the same plane as the above stage optics. Thus, the EDM has a narrow focal plane, which gives it optical section properties similar to that of a confocal microscope.
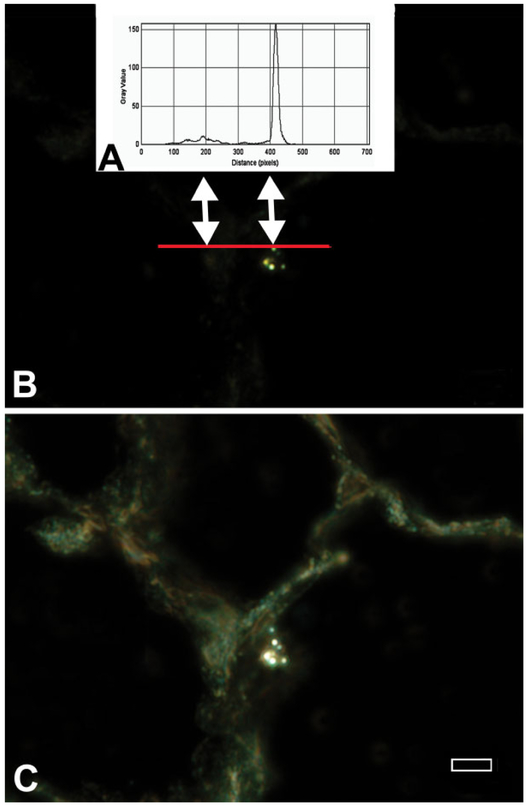
An illustration of the difference in image brightness between tissue and nanoparticles is given in Figure 2. This figure contains the graph of the EDM image intensity along a line (red line in B) that intersects an area of tissue and a titanium dioxide nanoparticle in a lung tissue section (left and right arrows, respectively). The upper plot (A) plots image intensity and demonstrates an approximately 20-fold difference between the intensity of light scattered by the nanoparticles (double arrow on the right) and the much weaker level of light scattered by the lung tissue (double arrow on the left). As illustrated by the lower micrograph (C), it is necessary to add transmitted light to the image in order to make the tissue of the section visible in EDM micrographs.
Figure 2.
Differences in image intensity between nanoparticles and tissue for enhanced dark-field microscopy (EDM). The graph in the upper plot (A) shows the image intensity corresponding to the pixels of the red line in the EDM micrograph that goes through lung tissue and a TiO2 nanoparticle. (B) This graph of image intensity demonstrates the approximately 20-fold difference between the intensity of light scattered by the nanoparticles (double arrow on the right) and the much weaker level of light scattered by the lung tissue (double arrow on the left). The lower micrograph (C) is of the same area. In this micrograph, the tissue adjacent to the nanoparticles has been made visible by addition of transmitted light. As shown in the lower micrograph, unstained tissue typically has a slight green tint (autofluorescence). Magnification bar is 5 μm.
The EDM is uniquely capable of detecting nanoparticles. When the individual nanoparticles are visible, details associated with the tissue sampling necessary for observation must also be considered. The organ particle burden, tissue area to be sampled, and section thickness must be considered, to provide an optimal number of nanoparticles in each slide or tissue section. For general analysis and particularly for quantitative analysis such as counting the number particles per area of interest, nanoparticle number must be in an optimal range. If there are too few particles, the average specimens will contain many zero values, have a large variance, and may deviate from an otherwise normal distribution. Likewise, if there are too many particles, then the time to analyze each specimen may greatly increase and increases the likelihood for selection bias.
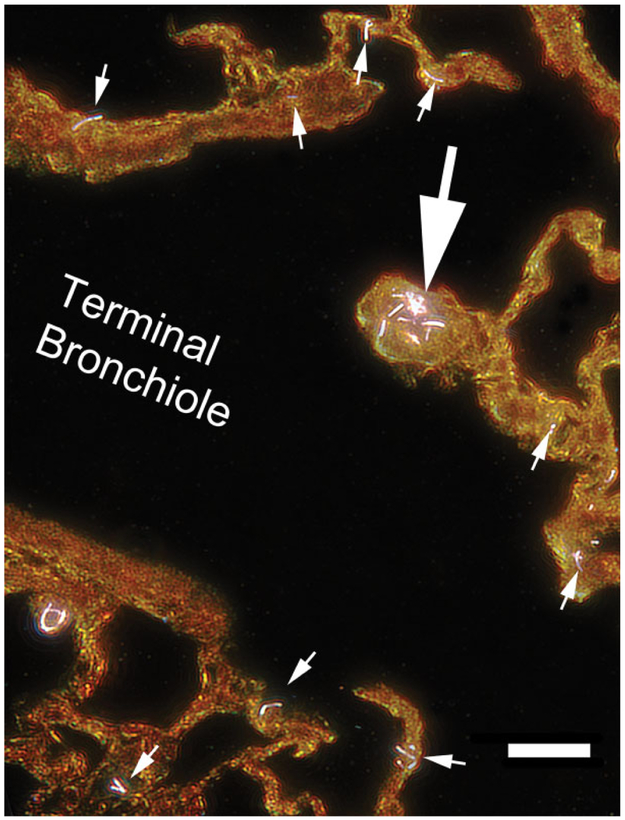
The issue of sampling is further complicated by the fact that aerosol exposures of nanoparticles typically involve a range of particle size due to variation in the degree of agglomeration of the nanoparticles. For instance, only 3–5% of the mass of an MWCNT aerosol generated by a fluidized bed is composed of singlet MWCNT (Chen et al. 2012). The bulk of the aerosol consists of a much larger agglomerates with a volume equivalent diameter of approximately 8 μm. An example of the resulting distribution in the lungs is shown in the EDM micrograph of Figure 3. This figure shows the typical distribution 1 day after a 12-day inhalation exposure to MWCNT in mice with the large arrow indicating a large agglomerate of MWCNT and the numerous singlet and small number clusters of MWCNT indicated by the small arrows. As indicated, only 3–5% of the MWCNT aerosol generated in these exposures was composed of singlet or small clusters of MWCNT. The frequent appearance of these small MWCNT in comparison to the single, larger agglomerate demonstrates how smaller particles can appear significantly more frequent even though the smaller particles account for only a fraction of the total lung burden. The potential for large numbers of smaller nanoparticles in an aerosol exposure may dramatically alter the apparent distribution in tissue sections.
Figure 3.
Enhanced dark-field microscopy image of multiwalled carbon nanotube (MWCNT) in the region of the junction of the terminal bronchiole to the alveolar ducts at 1 day after a 12-day inhalation exposure to MWCNT in mice. The large arrow points to a cluster of MWCNT located at the first alveolar duct junction. This cluster would typically be visible in a traditional light microscope image. However, singlet or doublet MWCNT, indicated by the small arrows, would generally not be detected by a traditional light microscope examination of this region. Magnification bar is 20 μm.
To adequately appreciate this relationship between particle size, number, and lung burden and to optimize the number of particles in a section for study, a basic morphometric relationship between the number of particle profiles per unit area in a tissue section and the number of objects per unit volume will be used. This relationship can be used to estimate the density of nanoparticles in a tissue section, or in morphometric terms the number of particle profiles per unit area in a tissue section, and thus optimize the sampling as described in equation (2; Hillard 1962). In this equation, Na is the number of particles that could be counted or observed per unit area of the section, Nv is the number per unit volume, is the mean caliper diameter (a measurement of the average outside diameter of the particle in all possible sectioned orientations; Woody, Woody, and Crapo 1980), and t is the section thickness.
| (2) |
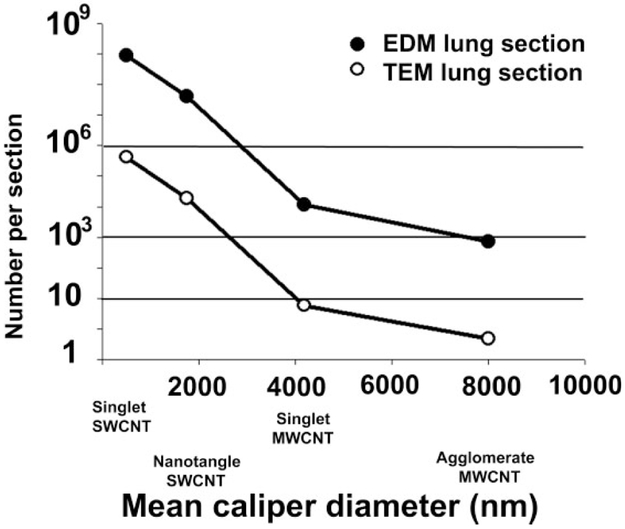
An example of this relationship for a number of typical cases in a mouse lung exposed to 10 μg of particles is given in Figure 4. The Y-axis shows the number of particle that would be observed for various cases. The filled circle curves correspond to the number of particles that would be observed in a typical EDM section (1 cm2 and 5-μm thick). The unfilled circles correspond to the average number of particles that would be observed in a TEM section (2 × 2 mm and 60-nm thick). The X-axis corresponds to different values. For convenience, these are labeled in terms of various nanoparticle and particle structures.
Figure 4.
Calculation of nanoparticle numbers in enhanced dark-field microscopy (EDM) and transmission electron microscopy (TEM) tissue sections for different nanoparticles exposures to a constant level of lung burden. This graph shows the estimates of the number of nanoparticles in EDM and TEM tissue sections (see equation [1] in text) that would be counted in various applications for a 10-μg dose in a mouse lung. The filled circle curves correspond to the number of particles in an EDM paraffin section (section thickness of 5 μm and area of 1 cm2). The unfilled circles give the average number of particles in a TEM section (section thickness of 0.06 μm and area of 0.04 cm2). Example nanoparticle indicated on the X-axis correspond to values of 504 nm for singlet single-wall carbon nanotube (SWCNT), 1,750 nm for an SWCNT nanotangle, a grouping of several poorly organized nanotubes (Mercer et al. 2008), 4,182 nm for singlet multiwalled carbon nanotube (MWCNT), and 8,000 nm for the MWCNT agglomerates. For the example nanoparticles indicated, the 10-μg dose in the mouse lung would be equivalent to a total lung number burden of 15 million agglomerate MWCNT, 230 million singlet MWCNT, or 790 million nanotangle SWCNT, or 1,770 million singlet SWCNT.
Figure 4 demonstrates that the range between lung burden and particle number resulting in the lungs is so extreme that the sampling method, which results for a given lung burden in either EDM or TEM sections, must be considered. For a given lung burden, a significantly greater number of particles will be found, as the particle size is decreased. At the same time, there is a large range between the volume of tissue observed with the EDM and the TEM. As illustrated in Figure 4, a 10-μg dose of singlet MWCNT would yield approximately 12,000 particle profiles in an EDM section. As many as 12,000 particles in an EDM section is entirely too numerous for any measurements and unlikely to correspond to any physiologic exposure. Observation of the same tissue in the narrow field, thin section of the TEM would yield 6 particle profiles of singlet MWCNT. In TEM observation, 6 particle profiles is likely too few to be useful in practical observation. For the case of a larger MWCNT agglomerate, there would be approximately 700 agglomerates in EDM tissue sectioned examined and less than 1 agglomerate in every 3 TEM sections.
Material and Method
Materials
This study provides a variety of examples of nanoparticle visualizations. Their characterizations are listed below with source, values for the particle dimensions, and reference(s). Agricultural dust was obtained from a high volume air sampler in a grape field in Central Valley of California in 2007 and had a mean diameter of 2.22 μm and geometric mean diameter of 1.87 μm. Physical and chemical characterization was previously reported (Vallyathan et al. 2007). Briefly, organic carbon was 84.8/100 mg, inorganic carbon was 15.2/100 mg, crystalline silica was 12.67/100 mg, endotoxin was 37 EU/100 mg, and iron was 31.7 μg/100 mg. Crystalline silica (Min-U-Sil-5) was obtained from U.S. Silica (Berkeley Springs, WV) with a mean geometric diameter of 2.2 μm (Porter et al. 2004). The MWCNTs used in this study were obtained from Hodogaya Chemical Company (MWCNT-7, lot #061220-31) and were manufactured using a floating reactant catalytic chemical vapor deposition method followed by high thermal treatment in argon at 2,500°C furnace. MWCNT trace metal contamination was 1.32%, with iron (1.06%) being the major metal contaminants (Porter et al. 2010). For the aerosol exposure in this report, the mass mean aerodynamic diameter was 1.3 μm, with a count mean aerodynamic diameter of 0.42 μm (Porter et al. 2013). Single-wall carbon nanotubes (SWCNTs; CNI, Houston, TX) were produced by the high-pressure CO disproportionation technique and were then purified by acid treatment to remove metal contaminates for use in this study. Elemental analysis of the SWCNT by nitric acid digestion and inductively coupled plasma-atomic emission spectrometry (ICP-AES, NMAM #7300) showed that the SWCNTs were 99% elemental carbon and 0.23% iron (Mercer et al. 2008). Silver nanoparticles, used in an intratracheal exposure study, were 20 nm in diameter (Roberts et al. 2011). Vapor grown carbon nanofibers (VGCNFs) have been described previously in a comparative study to MWCNT (Porter et al. 2017). The count median length and width of VGCNF were 2.46 μm and 146 nm, respectively. VGCNF trace metal contamination was 0.03%. CeO2 and DEPs have been previously characterized (Ma et al. 2014, Ma et al. 2015). CeO2 primary particle diameter determined by TEM was 10.1 nm with less than 0.2% total contaminating metals as determined by ICP-MS analysis. DEP particles (NIST SRM 1650 DEP standard) containing 98% carbon were typically clumps of material with a diameter of 38 nm. CoO nanoparticles (53.5 nm diameter) were purchased from Sky-Spring Nanomaterials (Houston, TX), and La2O3 nanoparticles (134.2 nm diameter) were purchased from Nanostructured & Amorphouse Materials, Inc. (Houston, TX) with characterization reported in detail (Sisler et al. 2016a, 2016b).
Experimental Animals and Exposure Conditions
Studies used either mice (male C57BL/6 J, 7-weeks old) from Jackson Laboratories (Bar Harbor, ME) or rats (specific pathogen-free male Sprague-Dawley (Hla: SD-CVF; ~250 g) obtained from Hilltop Laboratories (Scottdale, PA). Animals were housed 1 per cage in polycarbonate-ventilated cages, which provided HEPA-filtered air, and were illuminated with fluorescent lighting from 0700 to 1900 hr. Autoclaved Alpha-Dri virgin cellulose chips and hardwood Beta-chips were used as bedding. Animals were monitored to be free of endogenous viral pathogens, parasites, mycoplasms, helicobacter, and CAR bacillus. Animals were used after a 1-week acclimatization period. All animals used in this study were housed in an AAA-LAC International accredited, specific pathogen-free, environmentally controlled facility. All animal procedures were approved by the National Institute for Occupational Safety and Health ACUC.
Details of the inhalation exposure methods and exposure conditions have previously been reported for cerium oxide/DEPs (Ma et al. 2014), cobalt monoxide and lanthanum oxide (Sisler et al. 2016a), SWCNT (Mercer et al. 2008), and MWCNTs (Porter et al. 2013).
Tissue Fixation
For tissue fixation, the lungs were preserved either by intratracheal instillation of fixative or by vascular perfusion of fixative, and details of both methods are described in the references given earlier in the Materials subsection for each particle. A brief description of the method of vascular perfusion, used in the case of MWCNT studies, follows (Mercer et al. 2010).
For whole body perfusion of the mouse, the trachea was cannulated, the lungs inflated with 1 ml of air, and a midline incision of the chest was made to expose the heart and lungs. The left ventricle of the heart was punctured with a large bore needle connected to a reservoir 100 cm above the chest wall of the animal. In quick succession, the right atrium was cut to allow outflow and the reservoir valve was opened to allow perfusion of the whole body with clearing solution (heparinized saline). After the clearing tracheobronchial solution was passed (2–5 ml), the reservoir was switched to paraformaldehyde and the whole body perfusion fixed (~25–50 ml). Following fixation, the lymph nodes were taken from the lungs by blunt dissection, the heart and esophagus were removed, and the fixed lung volume determined by volume displacement (Scherle 1970).
Field-emission Scanning Microscopy
For SEM, sections of the lung were cut at 8 μm thickness, placed on carbon planchets, deparaffinized, and sputter coated. After coating, the specimens were examined with a Hitachi Model S-4800 field emission scanning electron microscope (FESEM) at 5–20 kV. Use of thin sections from paraffin-embedded tissue was found to be preferable to large, unevenly cut blocks because it provided a uniform thickness of organic material on the carbon planchet. The 8-μm sections were thick enough to convey 3-dimensional information but were also less likely to charge or undergo shifts when examined at the high magnifications necessary to study nanomaterials.
Embedding, Sectioning, and Staining for EDM
A number of steps must be taken to avoid contaminating particle sources in processing fixative preserved tissues for EDM slides. Typically, fixed tissue samples use an automated processor for paraffin embedding of multiple samples in the same batch. Separate batches may be run of high and low burden-level tissues to avoid potential cross contamination between the high levels of particles present in lung tissue and other samples or negative control tissues. However, to date, this source of contamination has not been observed based on clean air controls run concurrently with lung tissues. On the other hand, contamination by other processes is known to be an issue, such as silica particles from the ground glass edges in traditional slides and coverslips. Clean room prepared and laser cut slides and coverslips (Schott North America, Inc., Elmsford, NY 10523) must be used to prevent contamination by silica particles that are present in normal histology slides.
For examination by EDM, tissue sections are microtomed at 5 μm thickness and collected on laser cut slides. To enhance the contrast between tissue and MWCNT, sections are stained with Sirius Red. Sirius Red staining consists of immersion of the slides in 0.1% picrosirius solution (100 mg of Sirius Red F3BA in 100 ml of saturated aqueous picric acid, pH 2) for 1 hr followed by washing for 1 min in 0.01-N HCl. Sections are then briefly counterstained in freshly filtered Mayer’s hematoxylin for 2 min and destained as desired. At this stage, 1 of the 2 different methods have been found practical without introducing contaminating particles. In the xylene-Permount method, the slides are dehydrated in xylene as usual and mounted in Permount (Fisher Scientific Co., Pittsburgh, PA) with 5%, by volume xylene. Just before mounting, the xylene-Permount is centrifuged at 10,000× g for 10 min (a slight red precipitate of contaminating particles will be produced in the centrifuge tube). Alternatively, Canadian Balsam, which is dissolved in xylene, may be used. This method typically produces a few contaminating particles but has the advantage of being compatible with typical laboratory stains and is a permanent mount. In the second method, a water-soluble embedding medium (Prolong Gold, Fisher Scientific, Pittsburgh, PA) is used. For this method, sections need not be dehydrated and can be directly coverslipped after staining. This method has the least and sometimes zero contamination, but inconsistent preservation of staining has been found with different lots of Prolong Gold.
Microscopes/Photography, Alignment of the EDM Alignment, and Confirmation of Nanoparticle Identity
Microscope/Photography.
The optical microscopes consist of a transmitted light microscope (Olympus B63 with motorized condenser, controller, and reflected light system) and a CytoViva EDM (CytoViva, Auburn, AL 36830). The CytoViva EDM has a high signal-to-noise, dark-field-based illumination optics adapted to an Olympus BX41 microscope, which also includes a hyperspectral imaging camera with ENVI 4.8 analysis software and the CytoViva 3-D positioning and analysis software for serial section reconstruction. Both transmission light microscope and EDM were equipped with an Olympus DP73 digital camera with cellSens Dimension camera control and measurement software (Olympus America Inc., Center Valley, PA 18034). Images for both systems were taken at either high resolution 4,800 × 3,600 pixels or 2,400 × 1,800 pixels.
Alignment of the EDM.
Alignment of the EDM requires (1) centering the substage illumination in the field of view, (2) make the substage illumination coplanar with the above stage objective focal plane, and (3) placing the coplanar focal plane of the substage illumination optics and above stage objective focal plane in the tissue section. The process of alignment is difficult, as the field of view is generally dark (black) until some region of illuminated tissue is roughly illuminated. This alignment must be repeated for each individual slide. Alignment is generally done using the low magnification objective (10×). One or two drops of immersion oil are placed on the top lens of the substage illumination optics, and the slide for study is then placed on the stage with the tissue approximately centered under the 10× above stage objective. (It is helpful if the 10× above stage objective is roughly in a position of focus on the tissue section before starting.) The substage illumination optics are then slowly raised until the oil on the top lens makes slight contact with the underside of the tissue slide. At this point, some degree of illuminated tissue will be visible in the field of view, and the above stage optics are focused on the tissue. The substage optics are then adjusted to obtain as small and bright an illuminated field on the tissue as possible. The illuminated field is then centered using screws on the substage optics. The alignment mode then changes to the fine adjustment mode where the above stage optics is refocused. Fine iterative adjustments are made to the substage illumination optics and the above stage objective. The above stage is then switched to the 20 and 40 air objectives or the 60 or 100 oil objectives, and the sample is refocused for observation.
Confirmation of nanoparticle identity in tissue sections.
Due to the significant difference in image intensity between tissue and nanoparticles in EDM sections, the first step in verification of the nanoparticles identity in tissue sections is relatively easy. Specifically, if there are structures in the tissue section which are significantly greater in intensity than the adjacent tissue, these are counted as nanoparticles. In studies where animals are housed in filtered, barrier facilities, exogenous nanoparticle exposure is not likely to be an issue. However, sections from clean air–exposed or sham-exposed animals should be examined to exclude the possibility of an unexpected exposure of the experimental animals. We have not identified any native forms of secretory granules or pathologic precipitation that mimic nanoparticle light scattering in our studies, but this case needs to be considered as well. Generally, the problem is determining whether the nanoparticle is from a contamination source during processing or is the specific nanoparticle of the exposure. This problem is best resolved by starting with contamination-free slides from the clean air–exposed/sham-exposed animals. If EDM analysis of tissue sections from organs/regions is found to have high levels of nanoparticle accumulation, FESEM examination can then be used to provide confirmatory images of the nanoparticles. In addition to imaging the nanoparticles, it is possible to use the X-ray energy dispersion capability of the FESEM to verify the chemical identity of the nanoparticles.
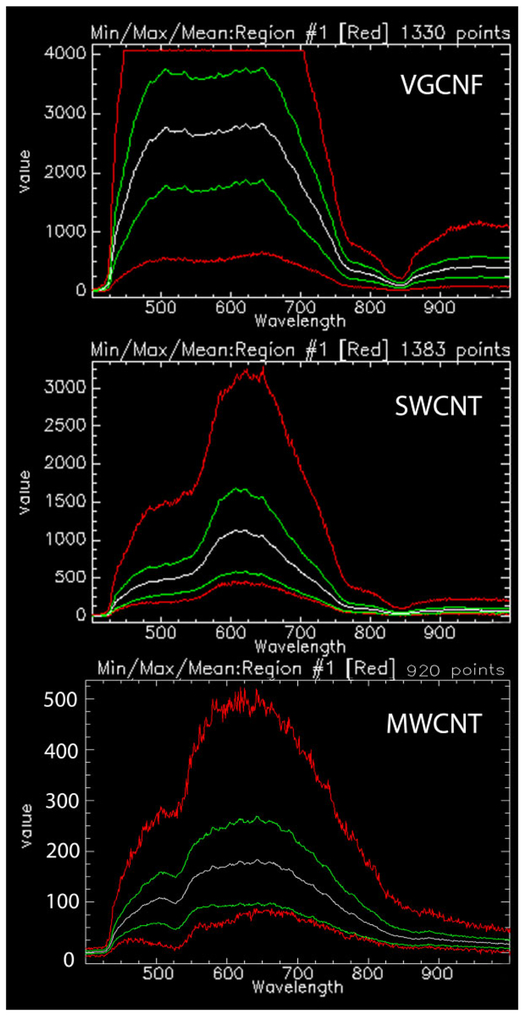
Identification of nanoparticles in tissue sections can also potentially be done with hyperspectral scanning. In hyperspectral scanning, the intensity of scattered light is determined for each pixel in the tissue section at wavelengths which typically range from 400 to 1,000 nm. A hyperspectral scan is similar to a “fingerprint” of the nanoparticles and has been used as a means of particle identification (Badireddy, Wiesner, and Liu 2012; Roth et al. 2015; Verebes et al. 2013). The hyperspectral scans of Figure 5 illustrate the differences, which can be visually identified in comparing scans between known nanoparticles. Comparison of VGCNF, SWCNT, and MWCNT in this image demonstrates that there are differences in the wavelength of peak-scattered light as well as the number and breadth of the peaks. Software to automate the process of identification may use a mapping technique based on a library of standard particle scans. For identification, the library is searched to find the nearest matching intensity profile to the spectral scan of the particle of interest. While this process of identification is still in development, some of the necessary elements for useful applications have been recently described (Roth et al. 2015; Dillon et al. 2017).
Figure 5.
Comparison of hyperspectral images of vapor grown carbon nanofiber (VGCNF), single-wall carbon nanotube, and multiwalled carbon nanotube. Graph shows screen image captures of the results for hyperspectral analysis of three related nanomaterials. Each image shows the intensity of scattered light for the pixels (points) of 20 to 30 nanoparticles versus wavelength from 400 to 1,000 nm. Multiple curves are shown for the scan to demonstrate the mean, range, and maximum and minimum at each wavelength. The white scan curve in each image is the mean of all pixels (points). The green curves are the 2 standard deviation range of pixel values. The red top and bottom curves of each nanoparticles scan correspond to the maximum and minimum pixels values encountered in the nanoparticles. The flat top of the VGCNF maximum scan (red curve) demonstrates that some pixels were saturated in that scan and would need to be repeated in normal operation. The three mean and range curves of these nanoparticle scans show significant differences in the peak wavelength of the scattered light and general shape, which can be used to identify each nanoparticle in a tissue section containing a mixture of the three nanomaterials.
Morphometric Measurements of EDM Images
To make morphometric measurements from the nanoparticle-exposed lungs and organs, a number of morphometric measurements may be applied. Fundamentally, these measurements are of the number, volume, and surface area of an object within a reference volume. These are typically referred to as number density, volume density, and surface area density. There are a wide range of methods for making these and other measurements, and only a brief description of the particle counting and volume density measurements which are most relevant to EDM studies is described here. General descriptions of morphometric methods may be found in standard references of the subject (Elias and Hyde 1983; Russ and Dehoff 2000; Weibel 1979). A complete description of various methods applied to the lungs can be found in the original description by Weibel (1963), general considerations of sampling issues in the study of the lungs (Gunderson 1977; Hyde, Tyler, and Plopper 2007), a detailed description of TEM methods for study of focal and diffuse injury in the lungs (Barry and Crapo 1985; Crapo et al. 1984), counting of alveolar number and measurement of alveolar region fibrillar collagen/elastin content (Mercer, Russell, and Crapo 1994a), and vertical section measurement of airway surface area and airway cell number in the lungs (Mercer et al. 1994b).
Counting of nanoparticles in tissue sections.
There are 2 principal methods for counting nanoparticles in tissue section. In the first method, sometimes referred to as the “D bar method,” counting of nanoparticles in single sections is done and the number per unit volume calculated from equation (2). For this method, sections of a known thickness (t) are prepared for the organs of interest, counts of nanoparticles per unit area of tissue section (Na) are taken, either historical or direct measures of the organ volumes (Vorgan) are made, and either a shape-based (Weibel 1979) or directly measured mean caliper diameter () of the nanoparticles is obtained (Loud et al. 1978; Woody, Woody, and Crapo 1980). The number of nanoparticles per unit volume (Nv) and the number per organ (Norgan) are then calculated as given in equations (2) and (3). This method is appropriate when counting of infrequent or rare nanoparticles, as is the case when counting nanoparticles transported from the lung to the extrapulmonary organs (Mercer et al. 2013b). It is also the most efficient method for determination of the number of cells in lungs based on counting of cell nuclei (Stone et al. 1992).
| (3) |
As demonstrated in equation (2), efforts to determine the number per unit volume from counts in a tissue section requires measurement of both the size of the object () and the section thickness (t) as well as counts of the object’s profile in sections. The second method, referred to as a dissector, is most applicable in determination of the number per unit volume in tissues where the structure to be counted is sufficiently uniform and densely distributed to be frequently sectioned in adjacent serial sections (Sterio 1984). The method essentially reduces the objects to be counted into 2 infinitely small points, a top point and a bottom point, located somewhere within the bounds of the 2 serial sections. Objects that are continuous in the 2 serial sections, that is, have neither a top nor bottom and are not counted. A top or bottom of an object between 2 serial sections is a point of zero size. In counting, identification of an object profile in one section and the object’s absence in the adjacent serial section is used to detect that somewhere between the 2 serial sections the top or bottom of the object occurs. Thus, counts of “tops” and “bottoms” made in a counting frame of area A in adjacent serial sections of thickness t provide 2, independent, direct measurements of the number of objects per unit volume that do not depend on the size of the object. For efficiency reasons, the counting is usually done in the larger volume of 3 to 5 serial sections rather than just 2 serial sections. One additional detail that should be used concerns how to count, in an unbiased fashion, structures which cross the bounding counting frame of each section. These rules, referred to as Gunderson’s unbiased counting rules, are relatively straightforward and described elsewhere (Gunderson 1977).
The dissector using a limited series of sections is simpler than the aforementioned method using counts in single sections and , as no assumptions or measurements of are needed. However, objects, which are rare or widely spaced in the tissue section, make it difficult, if not impossible, to produce an adequate number of top or bottom counts to achieve meaningful results in any technically achievable set of serial sections. This frequently occurs in attempts to apply the dissector to the lungs where the high proportion of air in the tissue section makes the dissector impractical and is also an issue when counting nanoparticles transported to extrapulmonary organs.
It should be noted that the dissector method is a general, unbiased selector of objects in a tissue. Once the cost of “selecting” the object or nanoparticle(s) is made in serial sections, other properties may be determined on the selection, such as the number/size of nanoparticles/fibers in the structure, which cell type/tissue region contains the object or the distance of the object from a boundary. This unbiased sampling strategy can be used to obtain the size distribution of objects such as the diameter, volume, and surface area distributions of alveoli at different levels of lung inflation and deflation (Mercer, Laco, and Crapo 1987).
Lung clearance determination from volume density measurement.
For lung clearance of nanoparticles, 3 basic measurements are needed. These are the fixed lung volume at each time point (day) postexposure (FLVday x), the volume density of the nanoparticles at each time point (day) postexposure (Vv day x Lung), and a chemical-based determination of the absolute lung burden at 1 day postexposure (LBday 1).
Point counting categories are typically subdivided into points over nanoparticles in the airway region, points over nanoparticles in the alveolar regions, and points over nanoparticles in the subpleural tissue region. Airway regions are defined as those containing airway tissue (airway epithelial cells-basement membrane and tissues of the bronchovascular cuff), airway lumen, and associated blood vessels greater than 25 μm. Alveolar regions are those containing alveolar tissue and alveolar air space. The subpleura tissue region includes nanoparticles in the subpleural tissue and nanoparticles in the visceral pleural surface. The subpleural tissue region includes the immediately subpleural alveolar interstitial-epithelium layer and subpleural lymphatics but does not include any portion of alveolar walls not directly in contact with the visceral pleural cells. Points in airway and alveolar regions are further subdivided into points over nanoparticles that are in the airspace, points over nanoparticles that are in tissue of the region, and points over nanoparticles that are partially or completely within macrophages.
For each time, a total is tabulated for all points over nanoparticles and divided by the total for all point categories at the time point to obtain the volume density of nanoparticles (Vvday n). To express the volume density results in terms of the weight of lung burden measured at day 1 postexposure, the conversion factor K is computed as given in equation (4) and applied to each subsequent day (day n) postexposure (equation 5).
| (4) |
| (5) |
The burden of nanoparticles in each compartment is then found by multiplying the total lung burden (LBday n) times the ratio of the points over nanoparticles in the compartment at that time (day) divided by the total points over nanoparticles on that time (day).
Statistics
Data were analyzed using analysis of variance (STATGRAF Version 7.1). Bartlett’s test was used to test for homogeneity of variances between groups. Statistical differences were determined using one-way analysis of variance with significance set at p ≤ .05. When significant F values were obtained, individual means were compared to control using Duncan’s multiple range test (Duncan 1955), and p < .05 was considered to be significant. Data are given as mean ± SE.
Results
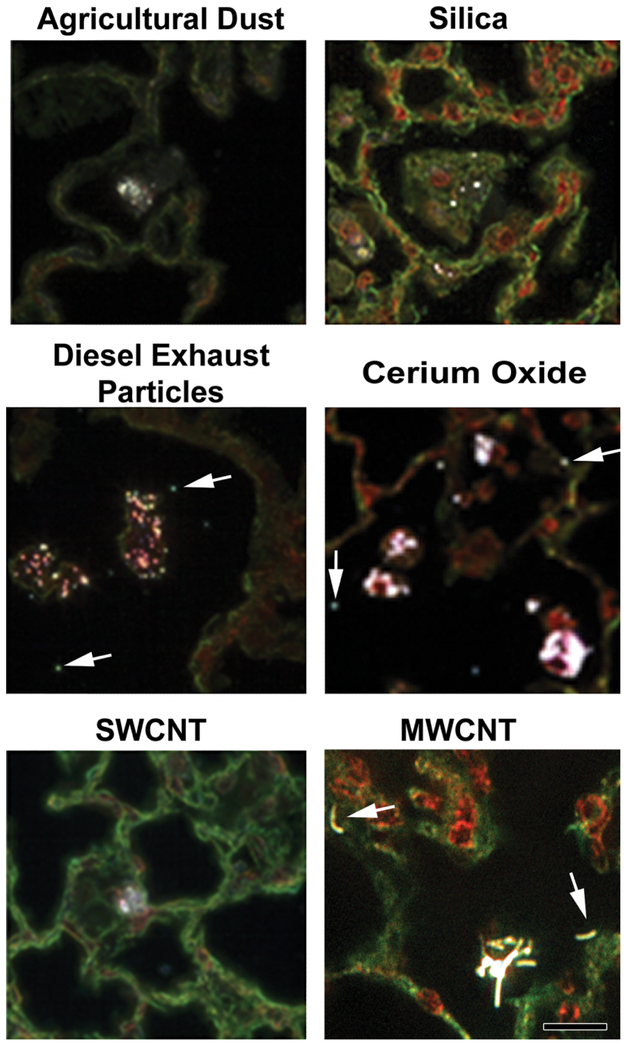
Representative EDM images of particles deposited in the lungs are shown in Figure 6. As illustrated in this figure, large micron-sized particles such as agricultural dust or silica are typically phagocytized by alveolar macrophages and easily visualized by EDM. Smaller nanoparticles such as DEP or cerium oxide generally are phagocytized into dense aggregations by alveolar macrophages, but numerous singlet and small clusters of free particles (indicated by arrows) are also detected by the EDM. EDM micrographs of SWCNT and MWCNT, in the bottom row of Figure 6, show carbon nanotubes in alveolar macrophages. Two cell-free MWCNT are indicated by arrows. The SWCNT micrograph does not show an example of a cell-free SWCNT. However, cell-free SWCNTs are present in SWCNT-exposed lungs, but the extent varies dependent on the dispersion SWCNT used in the exposure (Mercer et al. 2008).
Figure 6.
Examples of particles in the lungs imaged by enhanced dark-field microscopy (EDM). The top row shows pulmonary deposition from typical micron-sized particles (agricultural dust and silica). The second row shows the example images of diesel exhaust particles and cerium oxide (a nanoparticle used as a diesel fuel catalyst). The bottom row shows the images of single-wall carbon nanotube and multiwalled carbon nanotube (MWCNT). Arrows indicate particles outside of alveolar macrophages in the lungs (diesel exhaust particle, cerium oxide, and MWCNT). Particles are white in these EDM micrographs. Cell nuclei in these micrographs are red to brown, while nonnuclear tissue is green in these picrosirius and hematoxylin-stained sections. Calibration marker is 20 μm.
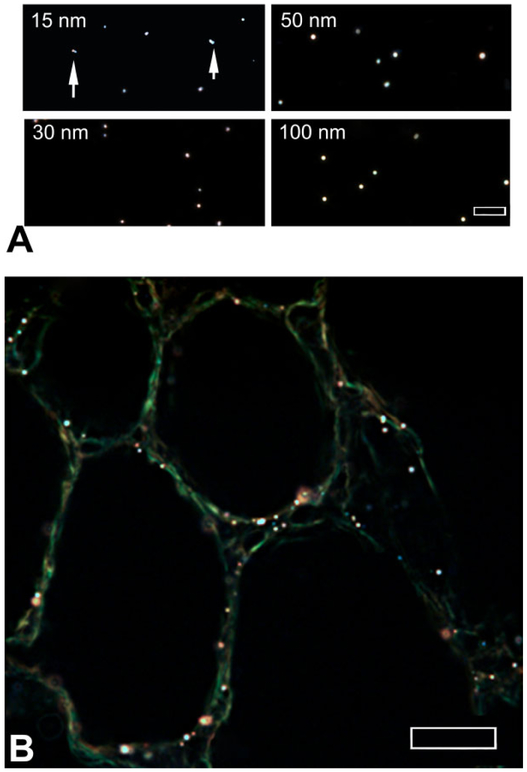
Colloidal gold nanoparticles of known sizes were examined to estimate the detection limits when using EDM. Figure 7A shows the examples of colloidal gold ranging from 15 to 100 nm in diameter, suspended in water, embedded, and cover-slipped. As shown in this figure, the images of colloidal gold particles (white spherical patches) are generally well defined. Particles whose edges are blurred were found to be located at a slightly different level of focus in the slide. Two cases of multiple 15-nm-diameter colloidal gold particles in contact with each other are shown by arrows. As illustrated in Figure 7B, the images of the 10-nm colloidal gold nanoparticles in lung tissue sections are less well defined but still detectable and distinct from the significantly dimmer alveolar tissue. The white to brown color of the colloidal gold nanoparticles in this image is slightly tinted compared to the image observed at the microscope. This illustrates a common problem associated with obtaining a white balance in the generally black images of tissue sections in EDM. A large white area of pixels is needed to set the correct white balance of these CCD images. Unfortunately, only the small, white nanoparticles embedded in tissue provide the white area of pixels needed for setting the white balance. Setting the white balance from these small groups of pixels frequently includes some coloration due to the adjacent tissue pixels.
Figure 7.
Enhanced dark-field microscopy (EDM) imaging of colloidal gold nanoparticles. (A) EDM images of 15-, 30-, 50-, and 100-nm colloidal gold nanoparticle standards are shown. Doublet nanoparticles of 15-nm colloidal gold are indicated by arrows. The EDM image of B is a lung tissue section from a mouse exposed to 10-nm colloidal gold nanoparticles (white to brown dots). Larger brown halos in (B) correspond to groups of colloidal gold that are slightly out of focus in the tissue section. Magnification bar is 5 μm in (A) and 10 μm in (B).
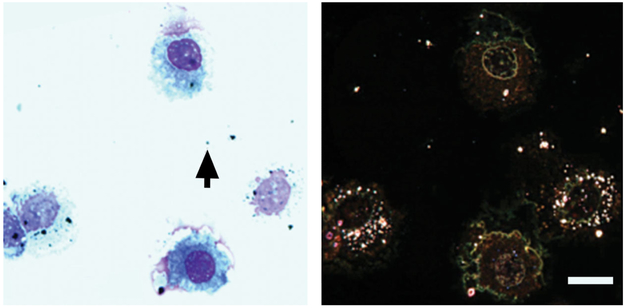
Observations illustrated in the preceding figures and images of other nanoparticles evaluated by our lab, but not shown, clearly demonstrate the utility of the EDM to detect nanoparticles in tissue sections. Figure 8 gives a direct side-by-side comparison of spherical silver, 20-nm-diameter, nanoparticles in a bronchioalveolar lavage sample from an exposed rat (Roberts et al. 2011) imaged by transmission light microscopy and EDM. The oil immersion image taken with a 100× objective from a transmission light microscope shows a small number (on the order of 10) of black particles in the image. These 10 or so large particles are also visible in the EDM. However, the EDM shows an additional (approximately 100) number of smaller nanoparticles in the image. This result demonstrates the increased sensitivity of EDM to detect nanoparticles and the potential for incorrect conclusions based on traditional light microscope observation of nanoparticles.
Figure 8.
Comparison of bronchioalveolar lavage (BAL) image from silver nanoparticles-exposed rats using a traditional light microscope (left) versus an enhanced dark-field microscopy (EDM; right). Silver nanoparticles in the traditional light microscope on the left are black particles. These nanoparticles appear as white to reddish brown particles in the EDM image on the right. The alveolar macrophages in the EDM image are loaded with silver nanoparticles. The majority of silver nanoparticles contained in the alveolar macrophages are not visible in the traditional light microscope image. Images are from BAL of rats 1 day postaspiration of silver nanoparticles (20 nm, NanoAmor, Inc.; Roberts et al. 2011). BAL images from sham-exposed rats (saline) were negative nanoparticles. The black arrow on the left image indicates the particle, which was used to set focus for both images.
The scattering of light from nanoparticles imaged by the EDM does not stop at the outer boundary of the nanoparticles. A halo of scattered light extends beyond the edges of the nanoparticles. This halo of scattered light is visualized at moderate settings of image gain and contrast as illustrated by the insert of a 2-μm particle in Figure 9. At higher settings of image gain and contrast, where the central core of the nanoparticles is saturated, nanoparticles less than approximately 100 nm will appear larger than their actual dimensions, as the transition between the nanoparticles edge and the outer halo is lost. For particles in the micron-sized region, the halo is relatively dim and thin, but for nanoparticles less than approximately 100 nm, the halo is brighter and larger relative to the core. This halo of scattered light enhances the ability of the EDM to detect small nanoparticles in tissue section but brings into question the range over which the EDM may be accurate for measuring particle dimensions. Figure 9 shows a graph of EDM, measured diameter versus the diameter of a series of particle size standards between 0.75 and 6 μm where the image gain and contrast are set such that the center of the particle is imaged below saturation. As demonstrated in the graph of Figure 9, when the EDM is appropriately adjusted to prevent image saturation, particle dimensions greater than approximately 1 μm can be accurately measured.
Figure 9.
Effect of scattered light halo on measurement of particle diameter by enhanced dark-field microscopy (EDM). Graph shows the particle diameter of polystyrene spheres versus the mean diameter measured by the EDM with sizes of 6 to 0.75 μm (R2 of .99). Insert is an overexposed EDM micrograph of a 2-μm-diameter polystyrene sphere with the outer scattered light halo. Measurements of physical dimensions require lowered settings of the brightness and contrast to eliminate interference by the outer scattered light halo of EDM. Below diameters of approximately 0.5 μm, measurements of particle diameter with an EDM are generally difficult and inaccurate, as the outer scattered light halo is difficult to separate from the particle edge.
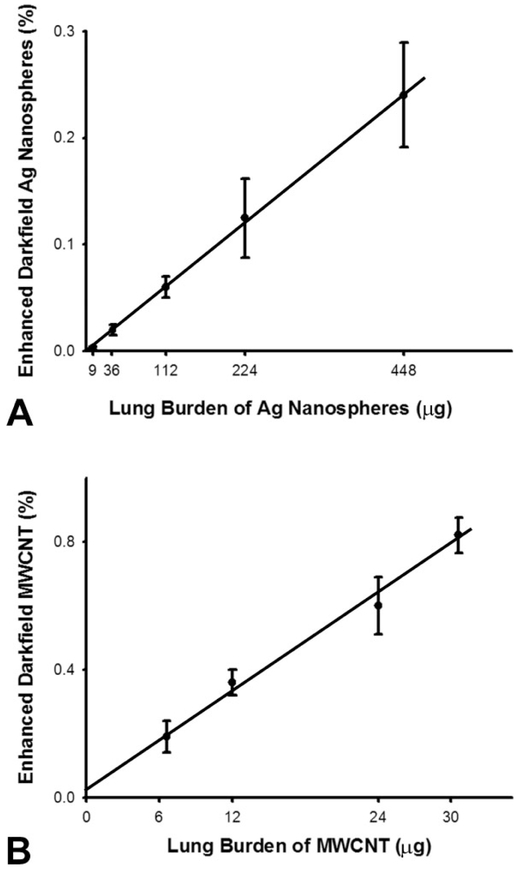
One of the goals for use of the EDM is to obtain various morphometric measurements of nanoparticle distribution, clearance, and potential transport outside the lungs. The percentage of volume, or volume density occupied by nanoparticles, is a basic measurement upon which these determinations are based. Figure 10 shows a direct comparison between chemical-based determinations of lung burden and EDM measurements of volume density for a spherical nanoparticle, silver nanospheres (Roberts et al. 2013), and a fiber-like nanoparticle, MWCNT (Porter et al. 2013). The results demonstrate that EDM measurements are directly proportional to the chemical measurements of lung burden for both spherical and fiber-like nanoparticles.
Figure 10.
Comparison of enhanced dark-field microscopy (EDM) measurement of volume density to lung burden for spherical (Ag) and fiber-like (multiwalled carbon nanotube [MWCNT]) nanomaterials. Upper graph (A) shows the total lung burden of elemental Ag present in lungs (X-axis) exposed to Ag nanospheres (20 nm) versus the EDM determined volume density in lungs at 1 day after intratracheal instillation. The lung burden of Ag nanospheres was determined by neutron activation analysis of Ag in the lungs. The lower graph (B) shows the chemically measured lung burden of MWCNT present in the lungs (X-axis) at 1 day after 1, 4, 8, and 10 days of acute inhalation exposure versus the EDM determined volume. The results demonstrate a direct linear relationship between lung burden and EDM determined volume density with near zero intercept and an R2 of greater than .99 for both. The Holmes effect correction (Weibel 1979) for overprojection of Ag nanospheres and MWCNT was applied.
As indicated in the legend of Figure 10, a correction for overprojection was applied to the volume density measurements of both particles. To calculate a volume density determination, in an ideal case, an infinitely thin tissue section is prepared, an overlay pattern of points is placed on an image of the section, and the percentage of volume occupied by the structure of interest is determined based on the fraction of points that overlay the structure of interest. In practice, an overestimation of the volume density can occur due to a tissue thickness effect referred to as the “Holmes effect” (Weibel 1979). Practical sections have a thickness in which the structure being measured projects onto the image where the points will be counted. The thicker the section, the greater the potential projection, and overestimation, will be. An EDM takes an optical section of the tissue due to the focusing of the substage illumination and above stage objective optics, which are adjusted to be coplanar during the alignment. The thickness of this optical tissue section for the CytoViva EDM is 60 nm (the typical optical section thickness of a traditional transmission light microscope with 100× high NA oil immersion objective is 200 nm). For micron dimension nanoparticle agglomerates and large cellular structures, such as cells and cell nuclei, the Holmes effect is not likely to be significant in the case of the EDM. On the other hand, singlet nanoparticles have one or more dimensions, which are on the same order of size as the optical tissue section thickness of the EDM, and thus, the Holmes effect must be considered. The Holmes effect can be neglected if preparation of tissue sections is sufficiently thin. Typically, if the section thickness is 10% or less than the diameter of the structure, the Holmes effect can be neglected. Alternatively, the results can be corrected based on additional morphometric measure of the degree of over projection where the correction factor can be calculated based on the section thickness and the shape/size of the nanoparticles (Weibel 1979).
Measurement of the lung burden of particles at different times after an exposure is a much simpler process than the corresponding morphometric analysis of volume density of particles to follow the clearance pattern. There are a number of reasons why this additional effort may be applied. The first is the basic consideration of the accuracy of chemical elements in the particles used to measure lung burden. Typically, lung clearance curves are based on exposures to physiologically low levels of exposure, which are appropriate to human health evaluations, and the curves of clearance are followed until the level of burden in the lungs is near zero to insure there are no chronic toxic effects from residual burden. Under these conditions, it is frequently the case that the initial postexposure lung burden (the highest burden in the clearance curve) is accurately measured by the chemical-based methods but may not be sufficiently accurate, as the lung clears the burden of particles below the level of detection for a given chemical assay or the chemical method is not able to distinguish between the particulate and the leached chemical element. Therefore, EDM becomes an important method for clearance measurements. Finally, the lung burden determined by chemical-based methods does not elucidate the dynamics of transport occurring in the lungs, as particles may be phagocytized by alveolar macrophages and transported up the mucocilliary escalator of the airways or enter into the alveolar interstitial space and transported to the lymph nodes. Unlike total lung burden determination, morphometric determination of nanoparticles lung burden components by EDM can be made for these individual components that reflect the dynamics of particle dispersion/aggregation in the lungs, macrophage phagocytosis, and clearance either through the lymphatics or airways.
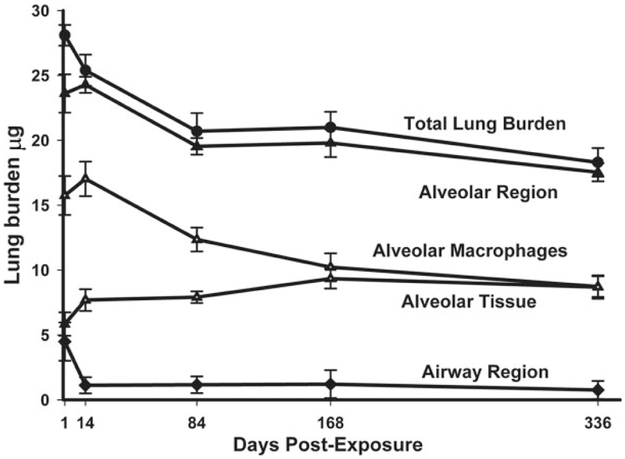
An example of these components and the clearance of total lung burden are shown in Figure 11 for up to 336 days after a 14-day inhalation exposure of mice. In this exposure, MWCNT in the airways accounted for 16% of the initial distribution with 84% in the alveolar region (including 1.2% of MWCNT in the subpleural tissue region). The MMAD of the inhaled MWCNT in this exposure was 1.5 μm, and the percentages of 16 and 84 in the airways and alveolar region are typical for what occurs for a spherical aerosol particle of that size range (Yeh, Phalen, and Raabe 1976). At 168 days after inhalation exposure, 4.2% of the initial lung burden was found in the airways and 95.8% of the initial lung burden remained in the alveolar region (including 4.8% in the subpleural tissue region). The airway to alveolar distribution of MWCNT at the chronic time point of 168 days is not typical of a persistent aerosol particle. Traditionally, micron-sized particles are rapidly cleared from the airways within the first 24 hr and are not found at appreciable levels at chronic time periods. For MWCNT, the airways have an initial rapid decline between 1 and 14 days postexposure but then have a nearly constant, low level of burden between day 14 and 168 days postexposure.
Figure 11.
Distribution of inhaled multiwalled carbon nanotube (MWCNT) in specific anatomic regions of the lungs. This image shows the changes in lung burden of MWCNT in different regions of the lungs determined from morphometry of enhanced dark-field microscopy images. The results demonstrate the slow clearance of MWCNT from the lungs. There was a rapid decline in the airway region over the first 14 days postexposure followed by a near constant, low level of burden for the rest of the postexposure period. The burden in alveolar macrophages slowly decreased over the study period, while a proportional increase was observed for MWCNT burden in alveolar tissue. Graph from Figure 3, Mercer et al. (2013a), Part Fibre Toxicol 10, 33.
As shown in the clearance curve components of Figure 11, alveolar macrophages initially contained nearly 3-fold the burden present in the alveolar tissue and had a high clearance rate, declining from 15.8 μg at 1 day postexposure to 10.2 μg at 168-days postexposure. Over the same period, the content of MWCNT in the alveolar tissue increased from 5.8 μg at 1 day postexposure to 9.5 μg at 168-days postexposure. The decline in alveolar macrophage burden with the nearly equal increase in alveolar tissue burden suggests that migration of MWCNT into the alveolar tissue was occurring. In a prior study (Mercer et al. 2013a), a more detailed analysis suggested that the larger agglomerates of MWCNT in the alveolar macrophages were dispersing into smaller structures down to singlet MWCNT, which were being incorporated into the alveolar tissues.
The alveolar region of the lungs does not contain anatomic lymphatics but is drained by fluid movement from the alveolar interstitial spaces to the pleural region and the tissues surrounding the terminal/respiratory airways. The incorporation of singlet MWCNT into the alveolar tissue and their subsequent movement to the lymphatics could produce an accumulation of MWCNT in the lymph nodes as has been observed for silica and other traditionally studied particles (Lauweryns and Baert 1974).
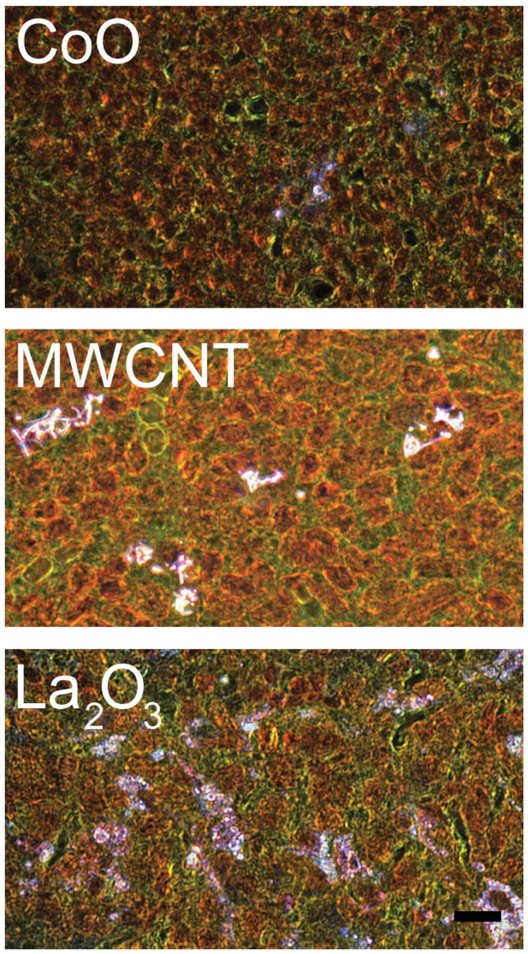
EDM of the tracheobronchial lymph nodes was used to study this potential pathway for a number of nanoparticle-exposed lungs. Our results have demonstrated a wide range in the degree to which nanoparticles are cleared from the lungs to the lymph nodes. In general, lymphatic migration of nanoparticles could be found for all nanoparticles that have been examined. For example with CoO, a low level of lymphatic migration was seen, and similar low levels of accumulation have been found for SWCNT (Shvedova et al. 2008). Others, such as MWCNT, demonstrated a progressive accumulation. By 336 days postexposure, the concentration of MWCNT per gram of tracheobronchial lymph nodes exceeded that in the lungs (Mercer et al. 2013b). A greater concentration in the lymph nodes is likely to produce adverse reactions and has been reported previously after exposure of mice by aspiration (Porter et al. 2010). As shown in the lower EDM micrograph of Figure 12, La2O3 at 56 days after exposure demonstrates a widely dispersed pattern in the tracheobronchial lymph nodes, which is nearly 50% of the day 1 postexposure lung burden (Sisler et al. 2016a). CeO2 and DEP and the combined exposure of CeO2 and DEP have been found in prior EDM-based studies to develop accumulation in the tracheobronchial lymph nodes (Ma et al. 2014). However, a substantial percentage of the lung burden remained chronically in the lungs with these two nanoparticles.
Figure 12.
Example enhanced dark-field microscopy (EDM) images of redistribution of nanoparticles from the lung to the tracheobronchial lymph nodes following inhalation. These micrographs illustrate the range of accumulation of nanoparticles in the tracheobronchial lymph nodes. Some nanoparticles demonstrate a low to moderate accumulation in the tracheobronchial lymph nodes as illustrated in the top EDM micrograph (A) from a mouse at 56 days after inhalation of CoO nanoparticles (Sisler et al. 2016a). The middle EDM micrograph (B), at 336 days after exposure by multiwalled carbon nanotube (MWCNT) inhalation, illustrates an intermediate level of accumulation that was equivalent to approximately 7% of the total 1 day postexposure lung burden (Mercer et al. 2013b). Other nanoparticles, such as La2O3 shown in (C,) have been found to demonstrate nearly complete transport of the lung burden to the tracheobronchial lymph nodes by 56 days postexposure (Sisler et al. 2016a). Nanoparticles in these figures are bright white, cell nuclei are brownish red, and other tissue elements are green. Calibration marker is 10 μm.
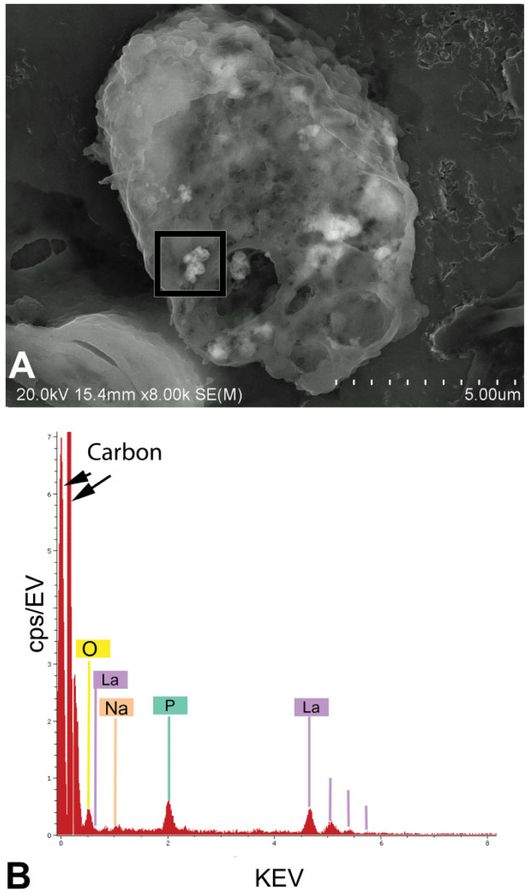
Figure 13 illustrates the use of FESEM to confirm the identity of nanoparticles detected by EDM. The upper micrograph (A) shows a cluster of La2O3 nanoparticles in an alveolar macrophage 1 day after the inhalation exposure. The image in the lower panel (B) is the corresponding FESEM X-ray energy analysis of the cluster, which demonstrates the presence of La2O3 for the tissue section mounted on a pure carbon planchet. The elemental peaks in the X-ray energy analysis confirm the presence of lanthanum particles that were detected by EDM in lungs and lymph nodes. A peak for phosphate (green labeled peak P) was also detected in the lungs and lymph nodes. This peak demonstrates the early chemical modification of deposited lanthanum oxide from a water-soluble form (Zhang et al. 2012) with potential rapid clearance from the body to a water insoluble form (LaPO4), which is persistent and accumulates in the lymph nodes (Sisler et al. 2016a).
Figure 13.
High magnification field-emission scanning electron microscope (FESEM) image and X-ray analysis of La2O3 in alveolar macrophage of exposed lung. The upper FESEM image (A) shows small clusters of La2O3 nanospheres in an alveolar macrophage of the lungs. The lower image (B) shows the X-ray analysis of a particle region outlined by the black box in (A). Peaks indicated by lines in (B) confirm the presence of lanthanum particles that were detected by enhanced dark-field microscopy in lungs and lymph nodes. An additional unexpected element, the green labeled peak (P for phosphate), was also detected. As demonstrated in our prior study of aerosol exposures (Sisler et al. 2016a), La2O3 a water-soluble nanoparticle is transformed in the lungs to insoluble LaPO. The clusters of La2O3 nanospheres in the alveolar macrophage, approximately 10, appear slightly lighter than the adjacent cytoplasm of alveolar macrophage in the FESEM micrograph.
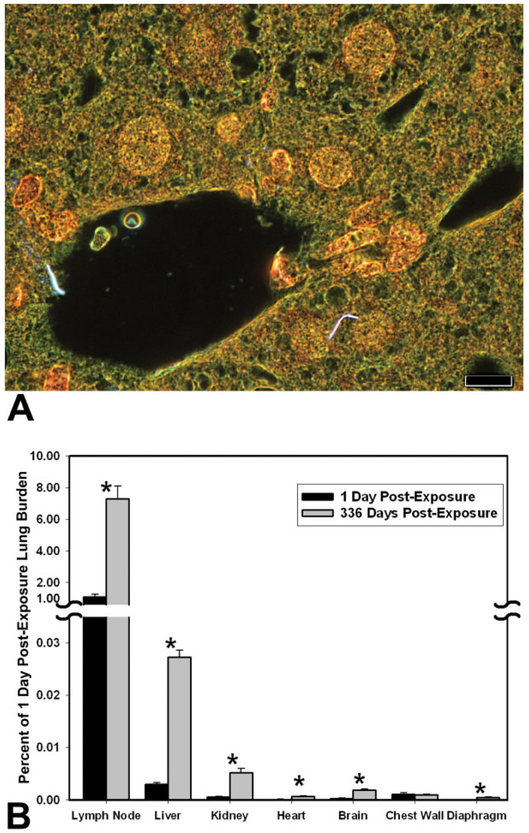
Figure 14 is an example of the results from using EDM to detect and quantify the extrapulmonary transport of nanoparticles, in this case MWCNT, to organs outside the lungs. The study of MWCNT extrapulmonary transport, which was described in detail elsewhere (Mercer et al. 2013b), used morphometry of MWCNT fibers counts in tissue sections from tracheobronchial lymph nodes, diaphragm, chest wall, and extrapulmonary organs to determine the organ burden at 1 and 336 days after inhalation exposure. The micrograph of Figure 14A shows two singlet MWCNT of the liver at 336 days after a 12-day inhalation exposure. Tissue sections of the liver contained on average 8 and 65 fibers per section at 1 and 336 days after the inhalation exposure, respectively. At 1 day postexposure, the content of MWCNT fibers in the tracheobronchial lymph nodes was principally in the form of singlets or a few fibers per MWCNT structure and accounted for 1.08% of the lung burden 1 day postexposure. At 336 days after exposure, the tracheobronchial lymph node had foci of dense accumulations with a substantially increased total accumulation which was equal to 7.34% of the lung burden 1 day postexposure. The high level of MWCNT burden delivered to the tracheobronchial lymph nodes was approximately 300 times greater than the burden delivered to the liver, which had the highest burden observed in extrapulmonary organs. Total MWCNT burden for diaphragm, chest wall, and extrapulmonary organs was 0.009% and 0.037% of lung burden at 1 day and 336 days, respectively, after exposure. Over the 336 days postexposure period, there was a 6- to 7-fold increase in the burden of MWCNT in extrapulmonary organs.
Figure 14.
Transport of inhaled multiwalled carbon nanotube (MWCNT) to extrapulmonary tissue determined by enhanced dark-field microscopy (EDM) after a 12-day inhalation exposure. Top image (A) is an example EDM micrograph of a liver section with two MWCNT singlets in the field of view. Singlet MWCNT fibers in this figure are bright white, cell nuclei are brownish red, and other tissue elements are green. With rare exceptions, MWCNT fibers detected in extrapulmonary organs were singlets. Normal (transmitted) light was blended into the field and contrast adjusted to make the tissue histology of the organ visible in this photograph. The lower graph (B) gives the distribution of MWCNT as a percent of initial lung burden. This was determined based on the measurements of MWCNT counts at 1 day and 336 days postexposure. Results are expressed as a percentage of the lung burden present 1 day after the end of a 12-day inhalation exposure. Categories of extrapulmonary tissues are ordered relative to MWCNT concentration in the respective tissue. Asterisks indicate significantly different between day 1 and 336 days postexposure, p < .05. Magnification bar is 10 μm. Graph in (B) from Figure 5, Mercer et al. (2013b), Part Fibre Toxicol 10, 38.
Discussion
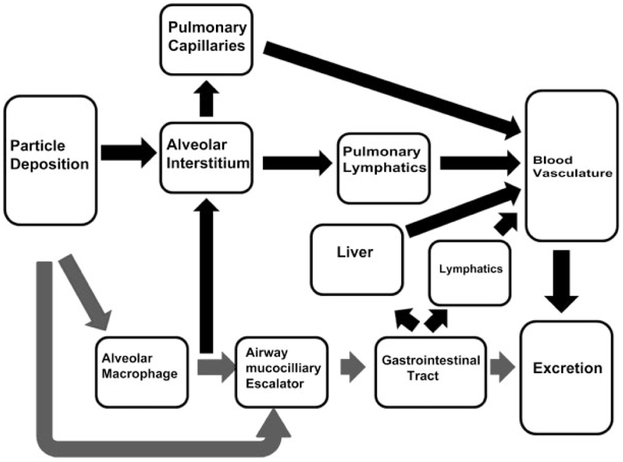
As shown in Figure 14B, after nearly a year postexposure, approximately 1% of the initial postexposure lung burden redistributed to extrapulmonary organs. Given this relatively low quantity, a number of physiological routes to account for this accumulation are possible. An illustration of potential routes following deposition in the lungs is illustrated in Figure 15. In that figure, the main route of deposition, alveolar macrophage phagocytosis/airway deposition, and transport by the mucociliary escalator to the gastrointestinal tract and excretion is shown by the gray-shaded arrows. We note that all of the potential routes are not illustrated in Figure 15. For instance, phagocytosis of MWCNT by circulating monocytes/macrophages and neutrophils which transiently passage into the alveolar airspace via the circulation may provide, over this chronic period, sufficient transport to account for accumulation elsewhere in the body. However, no observation of MWCNT-loaded circulating cells in the capillary bed of extrapulmonary organs was found in this study. On the other hand, individual or singlet MWCNT in capillary lumen of the extrapulmonary organs was a frequent observation. The lacteal lymphatics and gut-associated lymphoid tissue (GALT) are another potential (Florence et al. 1995; Alexander et al. 2010) but undemonstrated pathway. GALT is known to provide a high transport of dietary lipid from the gut to the blood (Dixon 2010) and may offer an efficient, high flow transport pathway for nanoparticles as well.
Figure 15.
Illustration of potential pathways and target organs for nanoparticles passage, potential accumulation, and excretion following deposition in the lungs. The principal route for normal processing of particles consisting of particle deposition in the airways and alveolar region, alveolar macrophage phagocytosis, transport of airway-deposited particles, and alveolar region–phagocytosed particles by the mucociliary escalator to the GI tract and ultimate excretion is shown by the gray-shaded arrows. Dark arrows show other potential pathways which result in entry into the general circulation. These pathways include (1) transepithelial transport across the alveolar epithelium through the interstitium/endothelium into the pulmonary capillaries, (2) transepithelial transport into the interstitium or phagocytosis by alveolar macrophages and macrophage mediated transport through the alveolar interstitium to the collecting lymphatics in the bronchovascular cuff to the lymph nodes, (3) potential transport via lacteals and gut-associated lymphoid tissue, and (4) absorption by the GI tract to the hepatic circulation where the nanoparticles may directly accumulate in the liver by passage through the hepatic sinusoids or pass into the general circulation.
The nearly exclusive transport of singlet MWCNT, as opposed to aggregates to extrapulmonary organs, suggests that large agglomerate transport systems such as the potential chylomicron-like transport of GALT or the phagocytic transport in the circulation by macrophages is not a significant route. Alternatively, MWCNT cleared from the lungs via the macrophage-mucociliary escalator may be reabsorbed by the gastrointestinal tract. It is possible that these MWCNT could follow hepatic transport to the liver and potentially pass across the fenestrated endothelial cells of the hepatic sinusoid into the liver. In whole-body inhalation exposures, which was the exposure method in this study, intestinal absorption of MWCNT ingested during preening of fur would increase the burden of this potential pathway during the exposure period. A subsequent study of the small intestine from this study did identify MWCNT in the lumen with low burdens at 1 and 336 days roughly equivalent to that of the diaphragm. No MWCNT was observed in associated lymphatics. Specific attempts were made to identify MWCNT in the hepatic sinusoids of the liver, but none was detected.
The tracheobronchial or pulmonary lymphatics are a major route for fluid exchange and particle redistribution from the lungs. Macrophage-mediated transport through the lymphatic network has been shown to be important in particulate clearance from the lungs (Harmsen et al. 1985). In addition, macrophage-independent lymphatic clearance of some nanoparticles is suggested by measurements demonstrating very rapid translocation to lung-associated lymph nodes (Choi et al. 2010). The high lymphatic burdens observed initially and at 336 days postexposure (Figure 14) indicate that the transport of MWCNT through the lymphatics and ultimately into the venous circulation may be a major route for the observed systemic delivery of MWCNT. Consistent with this role, dilation of peribronchiolar lymphatics was noted in the chronic and acute inhalation studies (Mercer et al. 2013a; Porter et al. 2013). The results of these observations suggest that the peribronchiolar lymphatics are a likely route for transport of MWCNT to extrapulmonary organs, but additional studies targeted specifically at that issues will need to be done to conclusive demonstrate the route or routes by which MWCNT is transported.
Conclusion
The nanoparticle’s ability to scatter light and thus provide a means for detection in tissue sections at dimensions well below that obtained by traditional microscopy made measurement possible. With care in preparation, the detection limit of EDM is on the order of a single nanoparticle per tissue section. This limit of detection allows the simultaneous evaluation of the lung burden of nanoparticles, which may number in the hundreds of billions of nanoparticles and the potential detection of much lower numbers of particles transported to organs outside the lungs. Such limits in EDM analysis of sections are only achieved with avoidance of contamination, which is the greatest challenge with the technique. This is particularly important in low-level detection of nanoparticles, where correctly identifying contaminating nanoparticle can easily take more time than detecting nanoparticles of interest.
The use of EDM to detect nanoparticles was a key factor in the measurement of nanoparticles over the wide range of burdens encountered during clearance of the inhaled MWCNT. EDM measurements ranged from 1,320 million MWCNT in the lung to single particles in tissue sections of extrapulmonary organs. These results have demonstrated that:
EDM has greater resolution of small particles than transmission light microscopy.
EDM has a greater field of view than TEM.
EDM requires significantly less sample preparation than TEM.
Hyperspectal analysis of EDM has the potential to confirm the identity of particles in a mixed exposures.
EDM can visualize nanoparticles in air/cells/tissue compartments of the lungs.
EDM is useful in determining the distribution of deposited particles, lung clearance measurements, and in identification of nanoparticles in extrapulmonary tissues.
Acknowledgments
Funding
The author(s) received no financial support for the research, authorship, and/or publication of this article.
Footnotes
The findings and conclusions in this report are those of the authors and do not necessarily represent the views of the National Institute for Occupational Safety and Health (NIOSH). Mention of any company or product does not constitute endorsement by NIOSH.
Declaration of Conflicting Interests
The author(s) declared no potential conflicts of interest with respect to the research, authorship, and/or publication of this article.
References
- Alexander JS, Ganta VC, Jordan PA, and Witte MH (2010). Gastrointestinal lymphatics in health and disease. Pathophysiology 17, 315–35. [DOI] [PMC free article] [PubMed] [Google Scholar]
- Badireddy AR, Wiesner MR, and Liu J (2012). Detection, characterization, and abundance of engineered nanoparticles in complex waters by hyperspectral imagery with enhanced darkfield microscopy. Environ Sci Technol 46, 10081–88. [DOI] [PubMed] [Google Scholar]
- Barry BE, and Crapo JD (1985). Application of morphometric methods to study diffuse and focal injury in the lung caused by toxic agents. Crit Rev Toxicol 14, 1–32. [DOI] [PubMed] [Google Scholar]
- Barry BE, Mercer RR, Miller FJ, and Crapo JD (1988). Effects of inhalation of 0.25 ppm ozone on the terminal bronchioles of juvenile and adult rats. Exp Lung Res 14, 225–45. [DOI] [PubMed] [Google Scholar]
- Chen BT, Schwegler-Berry D, McKinney W, Stone S, Cumpston JL, Friend S, Porter DW, Castranova V, and Frazer DG (2012). Multi-walled carbon nanotubes: Sampling criteria and aerosol characterization. Inhal Toxicol 24, 798–820. [DOI] [PMC free article] [PubMed] [Google Scholar]
- Choi HS, Ashitate Y, Lee JH, Kim SH, Matsui A, Insin N, Bawendi MG, et al. (2010). Rapid translocation of nanoparticles from the lung airspaces to the body. Nat Biotechnol 28, 1300–03. [DOI] [PMC free article] [PubMed] [Google Scholar]
- Crapo JD, Barry BE, Chang LY, and Mercer RR (1984). Alterations in lung structure caused by inhalation of oxidants. J Toxicol Environ Health 13, 301–21. [DOI] [PubMed] [Google Scholar]
- Dillon JC, Bezerra L, Del Pilar Sosa Pena M, Neu-Baker NM, and Brenner SA (2017). Hyperspectral data influenced by sample matrix: The importance of building relevant reference spectral libraries to map materials of interest. Microsc Res Tech 80, 462–70. [DOI] [PubMed] [Google Scholar]
- Dixon JB (2010). Mechanisms of chylomicron uptake into lacteals. Ann N Y Acad Sci 1207, E52–57. [DOI] [PMC free article] [PubMed] [Google Scholar]
- Duncan DB (1955). Multiple range and multiple F tests. Biometrics 11, 1–42. [Google Scholar]
- Elias H, and Hyde D (1983). A Guide to Practical Stereology. New York: S. Karger. [Google Scholar]
- Florence AT, Hillery AM, Hussain N, and Jani PU (1995). Factors affecting the oral uptake and translocation of polystyrene nanoparticles: Histological and analytical evidence. J Drug Target 3, 65–70. [DOI] [PubMed] [Google Scholar]
- Gunderson HJG (1977). Notes on the estimation of the numerical density of arbitrary profiles: The edge effect. J Microsc 111, 219–23. [Google Scholar]
- Harmsen AG, Muggenburg BA, Snipes MB, and Bice DE (1985). The role of macrophages in particle translocation from lungs to lymph nodes. Science 230, 1277–80. [DOI] [PubMed] [Google Scholar]
- Hillard JE (1962). The counting and sizing of particles in transmission microscopy. Trans Met Soc AIME 234, 906–17. [Google Scholar]
- Hyde DM, Tyler NK, and Plopper CG (2007). Morphometry of the respiratory tract: Avoiding the sampling, size, orientation, and reference traps. Toxicol Pathol 35, 41–48. [DOI] [PubMed] [Google Scholar]
- Lauweryns JM, and Baert JH (1974). The role of the pulmonary lymphatics in the defenses of the distal lung: Morphological and experimental studies of the transport mechanisms of intratracheally instillated particles. Ann N Y Acad Sci 221, 244–75. [DOI] [PubMed] [Google Scholar]
- Loud AV, Anversa P, Giacomelli F, and Wiener J (1978). Absolute morphometric study of myocardial hypertrophy in experimental hypertension. I. Determination of myocyte size. Lab Invest 38, 586–96. [PubMed] [Google Scholar]
- Ma X, Lu JQ, Brock RS, Jacobs KM, Yang P, and Hu XH (2003). Determination of complex refractive index of polystyrene microspheres from 370 to 1610 nm. Phys Med Biol 48, 4165–72. [DOI] [PubMed] [Google Scholar]
- Ma J, Mercer RR, Barger M, Schwegler-Berry D, Cohen JM, Demokritou P, and Castranova V (2015). Effects of amorphous silica coating on cerium oxide nanoparticles induced pulmonary responses. Toxicol Appl Pharmacol 288, 63–73. [DOI] [PMC free article] [PubMed] [Google Scholar]
- Ma JY, Young SH, Mercer RR, Barger M, Schwegler-Berry D, Ma JK, and Castranova V (2014). Interactive effects of cerium oxide and diesel exhaust nanoparticles on inducing pulmonary fibrosis. Toxicol Appl Pharmacol 278, 135–47. [DOI] [PMC free article] [PubMed] [Google Scholar]
- McKinney W, Jackson M, Sager TM, Reynolds JS, Chen BT, Afshari A, Krajnak K, et al. (2012). Pulmonary and cardiovascular responses of rats to inhalation of a commercial antimicrobial spray containing titanium dioxide nanoparticles. Inhal Toxicol 24, 447–57. [DOI] [PMC free article] [PubMed] [Google Scholar]
- Mercer RR, Hubbs AF, Scabilloni JF, Wang L, Battelli LA, Schwegler-Berry D, Castranova V, and Porter DW (2010). Distribution and persistence of pleural penetrations by multi-walled carbon nanotubes. Part Fibre Toxicol 7, 28. [DOI] [PMC free article] [PubMed] [Google Scholar]
- Mercer RR, Laco JM, and Crapo JD (1987). Three-dimensional reconstruction of alveoli in the rat lung for pressure-volume relationships. J Appl Physiol 62, 1480–87. [DOI] [PubMed] [Google Scholar]
- Mercer RR, Russell ML, and Crapo JD (1994a). Alveolar septal structure in different species. J Appl Physiol 77, 1060–66. [DOI] [PubMed] [Google Scholar]
- Mercer RR, Russell ML, Roggli VL, and Crapo JD (1994b). Cell number and distribution in human and rat airways. Am J Respir Cell Mol Biol 10, 613–24. [DOI] [PubMed] [Google Scholar]
- Mercer RR, Scabilloni JF, Hubbs AF, Battelli LA, McKinney W, Friend S, Wolfarth MG, et al. (2013a). Distribution and fibrotic response following inhalation exposure to multi-walled carbon nanotubes. Part Fibre Toxicol 10, 33. [DOI] [PMC free article] [PubMed] [Google Scholar]
- Mercer RR, Scabilloni JF, Hubbs AF, Wang L, Battelli LA, McKinney W, Castranova V, and Porter DW (2013b). Extrapulmonary transport of MWCNT following inhalation exposure. Part Fibre Toxicol 10, 38. [DOI] [PMC free article] [PubMed] [Google Scholar]
- Mercer RR, Scabilloni J, Wang L, Kisin E, Murray AR, Schwegler-Berry D, Shvedova AA, and Castranova V (2008). Alteration of deposition pattern and pulmonary response as a result of improved dispersion of aspirated single-walled carbon nanotubes in a mouse model. Am J Physiol Lung Cell Mol Physiol 294, L87–97. [DOI] [PubMed] [Google Scholar]
- Porter DW, Hubbs AF, Chen BT, McKinney W, Mercer RR, Wolfarth MG, Battelli L, et al. (2013). Acute pulmonary dose-responses to inhaled multi-walled carbon nanotubes. Nanotoxicology 7, 1179–94. [DOI] [PMC free article] [PubMed] [Google Scholar]
- Porter DW, Hubbs AF, Mercer R, Robinson VA, Ramsey D, McLaurin J, Khan A, et al. (2004). Progression of lung inflammation and damage in rats after cessation of silica inhalation. Toxicol Sci 79, 370–80. [DOI] [PubMed] [Google Scholar]
- Porter DW, Hubbs AF, Mercer RR, Wu N, Wolfarth MG, Sriram K, Leonard S, et al. (2010). Mouse pulmonary dose- and time course-responses induced by exposure to multi-walled carbon nanotubes. Toxicology 269, 136–47. [DOI] [PubMed] [Google Scholar]
- Porter DW, Orandle M, Mercer RR, Wu N, Zheng P, Chen BT, Holian A, et al. (2017). Lung bioactivity of vapor grown carbon nanofibers. NanoImpact 6, 1–10. [Google Scholar]
- Roberts JR, Chapman RS, oung S-H, Kenyon A, Schwegler-Berrry D, Stefaniak AB, Chen BT, and Antonini JM (2011). Pulmonary toxicity following intratracheal instillation of dispersed silver nanoparticles in rats. Toxicologist 120, 377–78. [Google Scholar]
- Roberts JR, McKinney W, Kan H, Krajnak K, Frazer DG, Thomas TA, Waugh S, et al. (2013). Pulmonary and cardiovascular responses of rats to inhalation of silver nanoparticles. J Toxicol Environ Health A 76, 651–68. [DOI] [PubMed] [Google Scholar]
- Roberts JR, Mercer RR, Stefaniak AB, Seehra MS, Geddam UK, Chaudhuri IS, Kyrlidis A, et al. (2016). Evaluation of pulmonary and systemic toxicity following lung exposure to graphite nanoplates: A member of the graphene-based nanomaterial family. Part Fibre Toxicol 13, 34. [DOI] [PMC free article] [PubMed] [Google Scholar]
- Roth GA, Sosa Pena Mdel P, Neu-Baker NM, Tahiliani S, and Brenner SA (2015). Identification of metal oxide nanoparticles in histological samples by enhanced darkfield microscopy and hyperspectral mapping. J Vis Exp, 106, e53317. [DOI] [PMC free article] [PubMed] [Google Scholar]
- Russ JC, and Dehoff RT (2000). Practical Stereolgoy. New York: Springer Science+Business Media. [Google Scholar]
- Scherle W (1970). A simple method for volumetry of organs in quantitative stereology. Mikroskopie 26, 57–60. [PubMed] [Google Scholar]
- Shvedova AA, Kisin E, Murray AR, Johnson VJ, Gorelik O, Arepalli S, Hubbs AF, et al. (2008). Inhalation vs. aspiration of single-walled carbon nanotubes in C57BL/6 mice: Inflammation, fibrosis, oxidative stress, and mutagenesis. Am J Physiol Lung Cell Mol Physiol 295, L552–65. [DOI] [PMC free article] [PubMed] [Google Scholar]
- Sisler JD, Li R, McKinney W, Mercer RR, Ji Z, Xia T, Wang X, et al. (2016a). Differential pulmonary effects of CoO and La2O3 metal oxide nanoparticle responses during aerosolized inhalation in mice. Part Fibre Toxicol 13, 42. [DOI] [PMC free article] [PubMed] [Google Scholar]
- Sisler JD, Sandra VP, Shaffer J, Mihalchik AL, Chrisholm WP, Andrew ME, Schwegler-Berry D, et al. (2016b). Toxicological assessment of CoO and La2O3 metal oxide nanoparticles in human small airway epithelial cells. Toxicol Sci 150, 418–28. [DOI] [PMC free article] [PubMed] [Google Scholar]
- Sterio DC (1984). The unbiased estimation of number and sizes of arbitrary particles using the disector. J Microsc 134, 127–36. [DOI] [PubMed] [Google Scholar]
- Stone KC, Mercer RR, Gehr P, Stockstill B, and Crapo JD (1992). Allometric relationships of cell numbers and size in the mammalian lung. Am J Respir Cell Mol Biol 6, 235–43. [DOI] [PubMed] [Google Scholar]
- Vallyathan V, Pack D, Leonard S, Lawson R, Schenker M, and Castranova V (2007). Comparative in vitro toxicity of grape- and citrus-farm dusts. J Toxicol Environ Health A 70, 95–106. [DOI] [PubMed] [Google Scholar]
- van de Hulst JC (1957). Light Scattering by Small Particles. New York: John Wiley. [Google Scholar]
- Verebes GS, Melchiorre M, Garcia-Leis A, Ferreri C, Marzetti C, and Torreggiani A (2013). Hyperspectral enhanced dark field microscopy for imaging blood cells. J Biophotonics 6, 960–67. [DOI] [PubMed] [Google Scholar]
- Wang T (2004). Light scattering study of single wall carbon nanotube (SWNT) dispersions In School of Polymer, Textile and Fiber Engineering, pp. 1–57. Georgia Institute of Technology; https://smartech.gatech.edu/bitstream/handle/1853/5200/wangtong200405mast.pdf [Google Scholar]
- Weibel ER (1963). Morphometry of the Human Lung. New York: Springer-Verlag. [Google Scholar]
- Weibel ER (1979). Stereological Methods. London, UK: Academic Press. [Google Scholar]
- Woody D, Woody E, and Crapo JD (1980). Determination of the mean caliper diameter of lung nuclei by a method which is independent of shape assumptions. J Microsc 118, 421–27. [DOI] [PubMed] [Google Scholar]
- Yeh HC, Phalen RF, and Raabe OG (1976). Factors influencing the deposition of inhaled particles. Environ Health Perspect 15, 147–56. [DOI] [PMC free article] [PubMed] [Google Scholar]
- Zhang H, Ji Z, Xia T, Meng H, Low-Kam C, Liu R, Pokhrel S, et al. (2012). Use of metal oxide nanoparticle band gap to develop a predictive paradigm for oxidative stress and acute pulmonary inflammation. ACS Nano 6, 4349–68. [DOI] [PMC free article] [PubMed] [Google Scholar]


