

ABSTRACT
DNA methylation status is closely associated with diverse diseases, and is generally more stable than gene expression, thus abnormal DNA methylation could be important biomarkers for tumor diagnosis, treatment and prognosis. However, the signatures regarding DNA methylation changes for pan-cancer diagnosis and prognosis are less explored. Here we systematically analyzed the genome-wide DNA methylation patterns in diverse TCGA cancers with machine learning. We identified seven CpG sites that could effectively discriminate tumor samples from adjacent normal tissue samples for 12 main cancers of TCGA (1216 samples, AUC > 0.99). Those seven potential diagnostic biomarkers were further validated in the other 9 different TCGA cancers and 4 independent datasets (AUC > 0.92). Three out of the seven CpG sites were correlated with cell division, DNA replication and cell cycle. We also identified 12 CpG sites that can effectively distinguish 26 different cancers (7605 samples), and the result was repeatable in independent datasets as well as two disparate tumors with metastases (micro-average AUC > 0.89). Furthermore, a series of potential signatures that could significantly predict the prognosis of tumor patients for 7 different cancer were identified via survival analysis (p-value < 1e-4). Collectively, DNA methylation patterns vary greatly between tumor and adjacent normal tissues, as well as among different types of cancers. Our identified signatures may aid the decision of clinical diagnosis and prognosis for pan-cancer and the potential cancer-specific biomarkers could be used to predict the primary site of metastatic breast and prostate cancers.
KEYWORDS: DNA methylation, cancer diagnosis, prognosis, survival analysis, machine learning, pan-cancer
Introduction
DNA methylation (DNAm) is one of the most commonly occurring epigenetic events involving the reversible addition of a methyl group primarily to cytosines in the context of CpG dinucleotides, without changing genomic DNA sequences. In general, DNA methylation status is more reliable than gene expression in cancer diagnosis [1]. Over the past few years, it has been proved that aberrant DNAm plays a key role in diverse diseases [2–4], especially cancers [5]. It is generally believed that the promoter regions of tumor suppressor genes (TSGs) are hypermethylated and repressed, whereas oncogenes are hypomethylated and abnormally active in cancers cells [6]. Furthermore, aberrant methylation could be used as biomarker for clinical decisions, diagnosis and prognosis of different cancers [7–9]. For the patients presenting with metastases or with unknown primary origin, DNA methylation markers can also be used to predict the origin of tumors [10].
Previous DNAm studies mainly focused on the promoter regions and CpG islands; however, DNAm changes in the non-islands regions, such as shores (regions of relatively low CpG density that up to 2 kb distance from traditional CpG islands) and gene bodies may also play important roles in gene expression regulation [11,12]. Moreover, tissue-specific gene expression is also associated with the DNAm differences in CpG island shores among different tissues [13]. Some other studies have shown that DNAm outside of CpG islands and shores could be associated with gene expression as well [14]. Although several studies investigated the DNA methylation profile of human pan-cancer [15,16], no biomarkers were identified for the diagnosis and prognosis of pan-cancer. Thus, it is necessary to comprehensively explore the DNAm patterns of both island and non-island regions in pan-cancer and identify the potentially effective signatures for the diagnosis and prognosis of pan-cancer.
Here we first conducted differentially methylated CpG sites (DMCs) calling at single CpG site resolution. Seven informative CpG sites that can significantly distinguish tumor samples from normal samples in 12 main TCGA (The Cancer Genome Atlas) cancers were identified by using feature selection and machine learning algorithms. The good performance of logistic regression model on training and validation DNAm datasets demonstrated the robustness and efficiency of our seven-CpGs-based classifier. Moreover, we detected 12 CpG sites that showed good performance in distinguishing 26 cancer types, which were also repeatable in 6 independent datasets. Importantly, those 12 CpGs are potentially applicable to predict the primary site of metastatic breast and prostate cancers. Additionally, we successfully built probe-based prognostic model for effectively classifying the tumor samples into high risk and low risk (corresponding to shorter and longer overall survival time, respectively) based on partial hazard in 7 distinct cancers.
Results
Methylation profiles of different cancers vary tremendously
To comprehensively investigate the aberrant methylation status across the whole genome, we screened the differentially methylated CpG sites (DMCs) of diverse TCGA cancers by comparing corresponding cancer samples with paired normal samples. The number of hypermethylated (DNAm beta values of tumor samples are significantly higher than that of normal samples) and hypomethylated (DNAm beta values of tumor are significantly lower than that of normal) CpG sites vary greatly among 18 different cancer types (Figure 1(a)) (no significant correlation was observed between the count of DMCs and number of samples in those cancers, Pearson’s p-value > 0.05). Esophageal carcinoma (ESCA) has the largest count of hypermethylated CpG sites, whereas pheochromocytoma and paraganglioma (PCPG) possesses the least. Moreover, cervical squamous cell carcinoma and endocervical adenocarcinoma (CESC) has the least count of hypomethylated CpG sites, while liver hepatocellular carcinoma (LIHC) possesses the highest number of hypomethylated CpG sites (Figure 1(a) and Supplementary Table 1). The number of DMCs located in the gene body regions is far more than that of other genomic regions (TSS1500, TSS200, 5'UTR, 1stExon and 3'UTR), which is reasonable since the length of gene body regions is generally longer than other types of regions. We also found that the proportion of DMCs in OpenSea regions is the largest in each type of genomic regions compared to that of other non-CpG island regions (S_Shelf, S_Shore, Island, N_Shore and N_Shelf) (Figure 1(b)),
Figure 1.
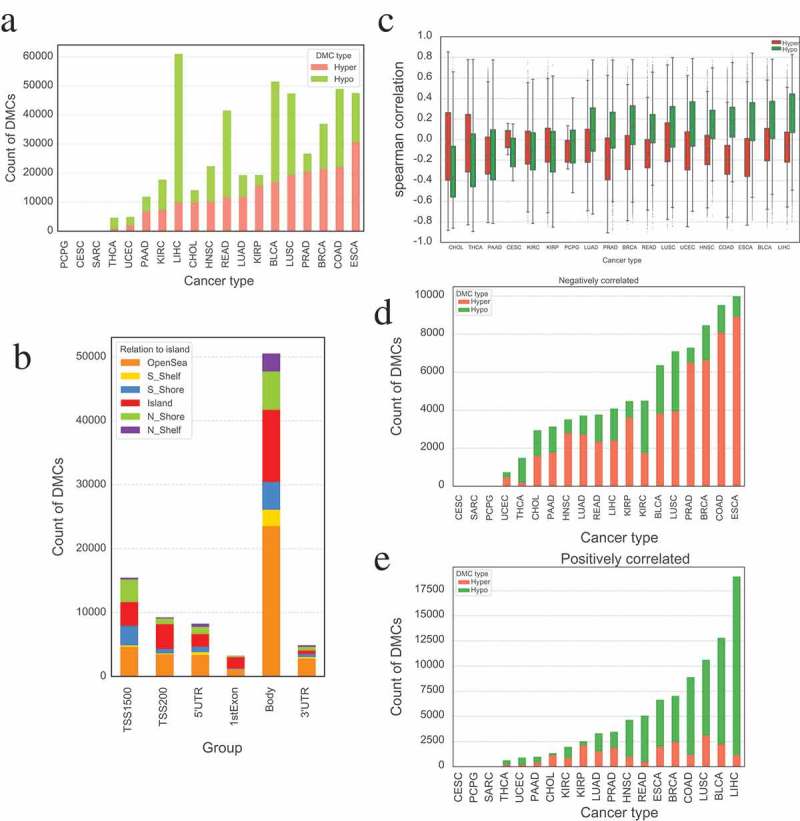
Statistics of differentially methylated probes in different cancers. (a) Countplot of differentially methylated probes in different cancer types. (b) The distribution of differentially methylated probes based on relation to island in different groups. DMCs located at gene body is far more than that of elsewhere, and OpenSea holds a large proportion DMCs between different relations to island. (c) Boxplot of Spearman’s correlation between DNAm of DMCs and expression of their corresponding genes among different cancer types. The aberrant DNAm in different tumors may have different functions. (d) Count of DMCs that are significantly negatively correlated with the expression of their corresponding gene in different cancers. (e) Count of DMCs that are significantly positively correlated with the expression of their corresponding gene in different cancers.
We then performed Spearman’s correlation analysis between the methylation level of DMCs and expression of corresponding gene for each cancer. The resulting Spearman’s correlations are significantly different between hypermethylated and hypomethylated probes (paired t-test, p-value = 0.014). For example, in cholangiocarcinoma (CHOL), thyroid carcinoma (THCA), kidney renal clear cell carcinoma (KIRC), and kidney renal papillary cell carcinoma (KIRP), the hypermethylated probes tend to have stronger correlations than hypomethylated probes (p-value < 0.01, independent student’s t-test), but an opposite phenomenon was observed in most of the other cancer types (Figure 1(c)). Furthermore, the hypermethylated CpG sites are inclined to negatively correlate with the expression of corresponding genes in almost all tumor types. Surprisingly, the methylation level of most hypomethylated CpG sites is positively correlated with the expression of corresponding genes in some cancers (such as LIHC, BLCA (bladder urothelial carcinoma), etc.) but are negatively correlated with the expression of relevant genes in others (e.g., CHOL, THCA, etc.). But no significant difference was observed for the correlation between DNAm of DMCs and their corresponding gene expression in different genomic regions as well as in distinct groups of CpG and non-CpG islands (Supplementary Figure S1). In addition, we compared the count distribution of hypermethylated and hypomethylated DMCs that are significantly positively (Spearmen’s correlation > 0 and p-value ≤0.05) or negatively (Spearmen’s correlation < 0 and p-value ≤0.05) correlated with their corresponding gene expression in different cancers. Interestingly, the count of negatively correlated DMCs that are hypermethylated in tumor is more than that of hypomethylated DMCs in most cancers (Figure 1(d)), whereas the count of positively correlated hypomethylated DMCs is far more than that of hypermethylated DMCs (Figure 1(e)). Thus besides DNA methylation, other factors can also regulate gene expression. Our findings indicate that DNAm patterns vary greatly in different cancers and aberrant DNAm may play different roles in disparate tumors.
Training and validation datasets of various cancers demonstrate our CpG sites-based diagnostic model
To identify the representative CpG sites that can differentiate tumor from normal samples across different tumor types, we only used those TCGA samples with at least 10 tumor-normal pairs, including 12 distinct cancers and 1216 samples (See Supplementary Table 2). After feature selection of recursive feature elimination with XGBoost [17], we obtained 738 probes with feature important score > 0 (see Supplementary Table 3) involving 311 genes. Those genes were significantly enriched in the biological processes of positive regulation of transcription from RNA polymerase II promoter and transcription from RNA polymerase II promoter (FDR < 0.05), which are highly correlated with the function of DNA methylation. The top seven probes (cg10995381, cg27019093, cg04396850, cg25351606, cg02064267, cg20300343 and cg13974761) were selected for further model construction. We performed unsupervised hierarchical clustering based on the methylation level of the 7 CpG sites across 1216 samples of 12 cancer types. Strikingly, those samples were clearly classified into two different clusters that separately contained the tumor samples and normal samples by the 7 CpG sites (Figure 2(a)). Accordingly, the result indicates that the DNA methylation level of those 7 CpG sites is potentially effective signatures to distinguish different tumor from normal tissues.
Figure 2.
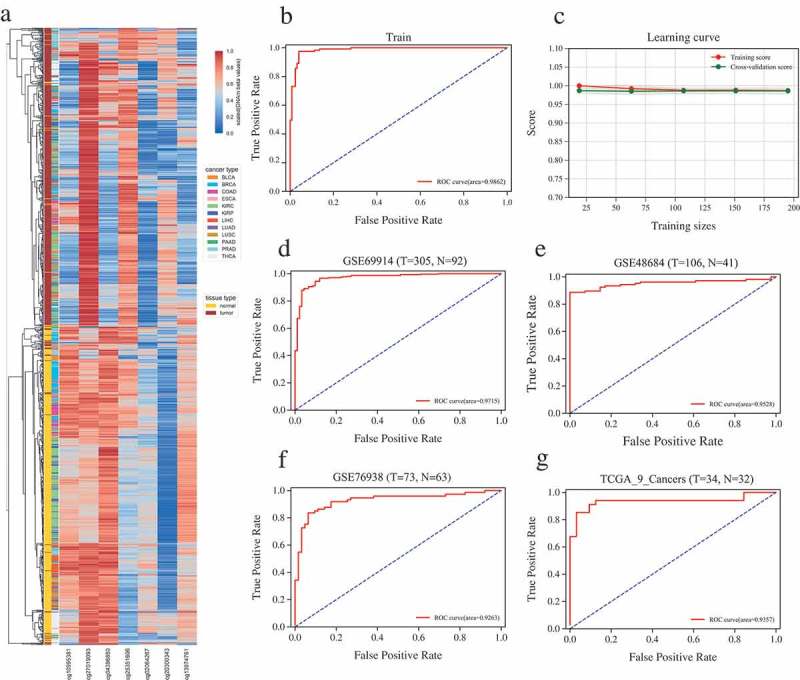
Construction and validation of the probes-based diagnostic model. (a) Unsupervised hierarchical clustering and heatmap for the methylation profile of the seven probes across all samples of 12 cancers. Left color bars mark the tissue and cancer types. (b) ROC curve of training showing the high sensitivity and specificity in discriminating different cancer types from corresponding normal tissues. (c) Learning curve of 5-fold cross validation in training (logistic regression model constructed with the selected seven CpGs). (d, e, f) ROC curve for the validation datasets of GSE69914 (breast cancer), GSE48684 (colorectal cancer) and GSE76938 (prostate cancer). (g) ROC curve for the independent validation dataset of the remaining 9 TCGA cancers not including in the training set. T and N indicate the numbers of tumor and normal samples, respectively.
Next, a logistic regression model constructed based on the selected seven features was implemented to train the 1216 samples involving 12 different cancer types. Remarkably, this logistic regression model achieved a Receiver Operating Characteristic (ROC) curve with an Area Under Curve (AUC) of 0.986 in training set (Figure 2(b)), and 0.979 for the mean score of 5 fold cross validation (Figure 2(c)), indicating that this model is able to effectively discriminate tumor samples from normal ones. Then, we performed independent validation using the public Gene Expression Omnibus (GEO) datasets of breast cancer (GSE69914 [18]), colorectal cancer (GSE48684 [19]) and prostate cancer (GSE76938 [20]). The AUC for those three independent datasets are 0.97, 0.95 and 0.93 (Figure 2(d,e,f)), respectively. In order to further estimate the reproducibility and validity of our feature selection method and diagnostic model, we then used the rest 9 different cancers not included in the training set as an independent validation dataset (Supplementary Table 4). Although the number of paired tumor-normal samples < 10 for all those 9 cancers, the seven-CpG sites-based model still performed well in those 9 TCGA cancers with AUC of 0.94 (Figure 2(g)). Consequently, the seven-probes-based model can effectively separate tumor samples from adjacent normal samples with high accuracy, and those 7 CpG sites are potential biomarkers for pan-cancer diagnosis.
Then we explored the functions of those seven CpG sites. Interestingly, probe cg10995381 locates in the gene body and openSea of MTRR (5-methyltetrahydrofolate-homocysteine methyltransferase reductase), and is hypomethylated in 10 out of 12 cancer types (Table 1), down-regulation of MTRR has been reported to be associated with ovarian cancer [21]. Probe cg27019093 is in the gene body and openSea of UBE2G1 (ubiquitin conjugating enzyme E2 G1) and hypermethylated in 5 cancers. Moreover, probe cg04396850 locates in the promoter region (upstream of 100 ~ 233 bp) of the long intergenic noncoding RNA LINC00944 and is hypomethylated in 11 out of 12 cancer types. Specifically, LINC00944 has been confirmed to participate in the process of liver metastasis in colorectal cancer [22]. Furthermore, cg13974761 is in the region of openSea and 1.5kb upstream of transcription starting site (TSS) of LCE2A (late cornified envelope 2A), and cg13974761 is positively correlated with the expression of LCE2A in 7 cancers (mean Spearman’s correlation coefficient is 0.13, p-value < 0.05). But cg25351606, cg02064267 and cg20300343 could not be mapped to any genes. The nearest genes of cg25351606 is SIM1 (single-minded family bHLH transcription factor 1), and the aberrant methylation of SIM1 is associated with cancers and could be a promising biomarker for lung adenocarcinoma [23].
Table 1.
Information of the 7 probes used in diagnostic model.
| Probe | Chr | Position | Strand | #DM cancer | Gene symbol | Relatioon to island | Group |
|---|---|---|---|---|---|---|---|
| cg10995381 | chr5 | 7877198 | - | 10 | MTRR | OpenSea | Body |
| cg27019093 | chr17 | 4235082 | + | 5 | UBE2G1 | OpenSea | Body |
| cg04396850 | chr12 | 127256977 | + | 11 | OpenSea | ||
| cg25351606 | chr6 | 100917427 | + | 8 | Island | ||
| cg02064267 | chr10 | 112220471 | + | 6 | OpenSea | ||
| cg20300343 | chr1 | 149719461 | + | 10 | Island | ||
| cg13974761 | chr1 | 152670598 | - | 7 | LCE2A | OpenSea | TSS1500 |
To further annotate the function of the above seven CpG sites, we first selected the genes whose expression level was significantly correlated with the DNA methylation level of those 7 CpG sites (|Spearman’s correlation| ≥ 0.5 and p-value <0.05), since genes may be functionally related with the CpGs whose methylation level is correlated with those gene expression level [24]. Then Gene Ontology (GO) and KEGG pathway enrichment analyzes were performed for those genes (see Materials and methods). We found that the genes that their expression level is significantly correlated with probes of cg04396850, cg25351606, cg20300343 and cg20994118 are enriched in cell division, mitotic nuclear division, sister chromatid cohesion, cell cycle and DNA replication (Figure 3), which is highly associated with the characteristics of tumor biogenesis.
Figure 3.
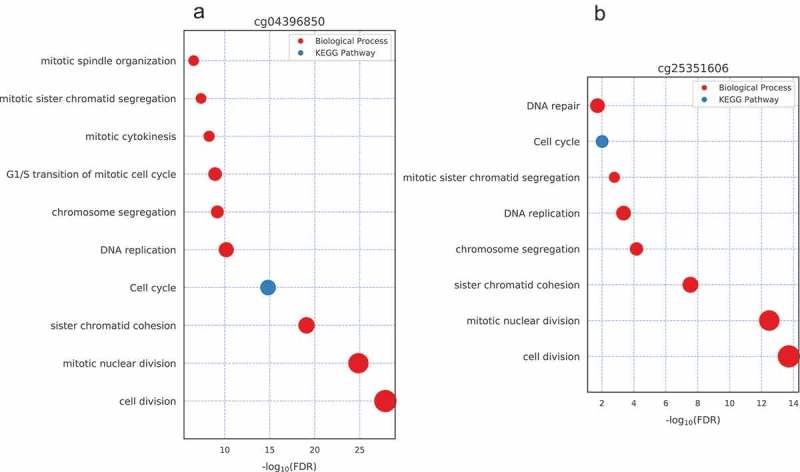
Biological process and KEGG pathway enrichment analysis result for probe cg04396850 and cg25351606. The size of the dots indicates the number of enriched gene count.
Tumor-specific classifier effectively distinguishes distinct cancers
One of the most important applications in cancer diagnosis is to determine which cancer the patient has and/or track the origin of a tumor for those patients with metastasis since different cancer origins need different treatment strategies. We then tried to build a probe-based tumor specific classifier to efficiently distinguish one cancer type from others (see Materials and Methods).
To this end, we first merged the methylation profile of 26 distinct cancer types including a total of 7605 tumor samples (see Supplementary Table 5, which contains the number of samples in each cancer). The probes with low methylation variance (standard deviation (SD) < 0.2) across 26 cancer types were removed. We selected the top 20 most significantly differentially methylated probes between one cancer and the rest cancers for each cancer type, and obtained a total of 515 unique probes for further analysis (See Materials and Methods). The unsupervised hierarchical clustering heatmap showed that those top 515 significantly differentially methylated probes can separate each cancer type from the others very well (Supplementary Figure S2). Principal component analysis and canonical correlation analysis based on those 515 probes across 26 cancer types also demonstrated that these probes can be used to effectively distinguish different cancer types (Supplementary Figure S3). We further screened out the top 12 CpG sites (Supplementary Table 6) as the final features by performing feature selection with recursive feature elimination. Unsupervised hierarchical clustering of those 12 probes in 7605 tumor samples of 26 cancers revealed that those 12 probes were complementary in discriminating each tumor from others (Figure 4(a)). The micro-average AUC of classifier based on those 12 selected CpG sites reaches to 0.98 (Figure 4(b)) (See Materials and Methods).
Figure 4.
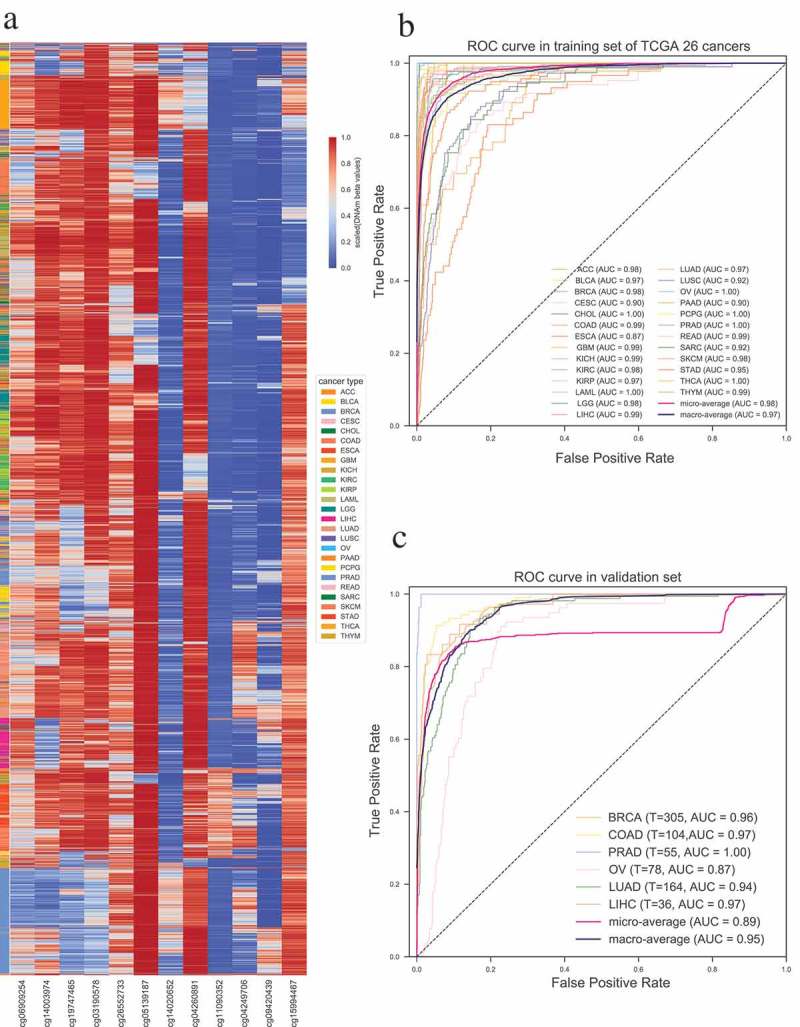
Construction and validation of the probe-based tumor specific classifier. (a) Unsupervised hierarchical clustering and heatmap for the methylation profile of the selected 12 probes across 7605 tumor samples of 26 cancers. (b) ROC curve of multiclass tumor specific classifier shows the high sensitivity and specificity of our classifier in predicting different cancers. (c) ROC curve in six independent validation datasets of different cancers. T indicates the number of tumor samples used in each dataset.
To prove the reproducibility and validity of our 12 CpGs-based tumor specific classifier, we performed validation on GEO datasets of breast cancer (GSE69914), colorectal cancer (GSE48684), prostate cancer (GSE73549 [25]), ovarian cancer (GSE65820 [26]), lung adenocarcinoma (GSE66836 [27]) and hepatocellular carcinomas (GSE89852 [28]). As expected, our model performed greatly in the validation datasets and achieved macro-average AUC > 0.95 (Figure 4(c)). The result further indicates that our identified signatures could be applicable to distinguish different cancers from each other.
In order to further testify whether our 12 CpGs-based tumor specific classifier can be applied to predict the origin of tumor with metastases, we performed validation on GEO datasets of breast cancer with metastases to lymph node (GSE58999 [29]), and prostate cancer with metastasis to bone or lymph node (combining GSE73549 [25] and GSE38240 [30], 26 metastatic samples in total). Our model also performed well on those three datasets, and successfully predicted the origin of tumor with AUC of 0.7 and 0.99 for metastatic breast cancer and metastatic prostate cancer respectively (Figure 5(a)). Accordingly, the methylation level of these 12 CpGs can effectively distinguish metastatic tumors from normal tissues clearly (Figure 5(b)) and can be applied to predict the primary site of tumors with metastasis.
Figure 5.
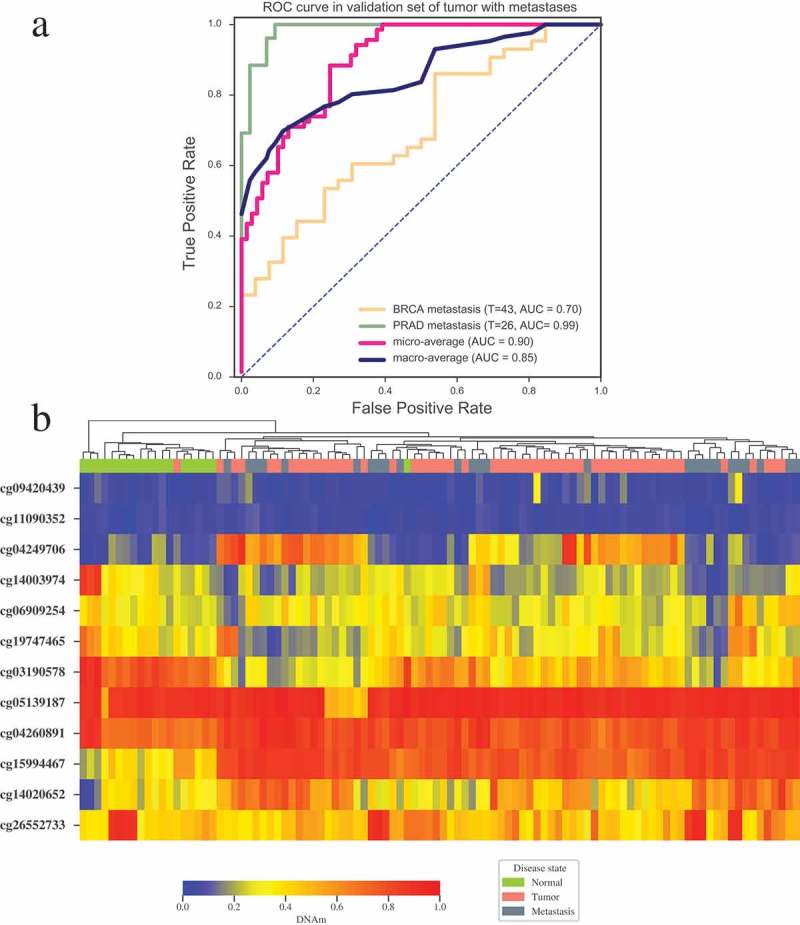
Validation of tumor specific classifier in tumors with metastases. (a) ROC curve of multiclass tumor specific classifier in metastatic breast cancer (GSE58999) and metastatic prostate cancer (GSE73549 and GSE38240). (b) Unsupervised clustering of the DNA methylation level for the 12 CpGs in the samples of normal prostate, prostate tumor and prostate tumor with metastases (GSE73549 and GSE38240). Annotations of the column on the heatmap indicate disease states of patients. Average linkage and Bray-Curtis distance were implemented in clustering. T indicates the numbers of tumor samples with metastasis used in each dataset.
Prognostic model successfully divides patients into high-risk and low-risk groups
To build an effective model for the prognosis of different cancers, we further carried out a series of feature selection with stringent criteria in 28 cancers (Figure 6(a), see Materials and methods). After filtering, only several potential signatures were detected in each of 7 different cancers including BLCA, BRCA (breast invasive carcinoma), HNSC (head and neck squamous cell carcinoma), LIHC, LUAD (lung adenocarcinoma), THCA, UCEC (uterine corpus endometrial carcinoma). The potential signatures identified in each of those 7 cancers were totally different (Supplementary Table 7). Then those identified signatures were separately integrated into a single cox proportional hazards model. Z-scores of partial hazard were calculated for better visualization. We found that the patients with lower Z-score generally has better outcome than those with higher risk scores (Figure 6(b-h) lower panel). All the patients were divided into high-risk or low-risk groups using the median partial hazard as the cutoff. Compared with the patients in low-risk group, the patients of high-risk group had significantly shorter overall survival in all of 7 cancers (Figure 6(b-h) upper panel, P-value < 0.01).
Figure 6.
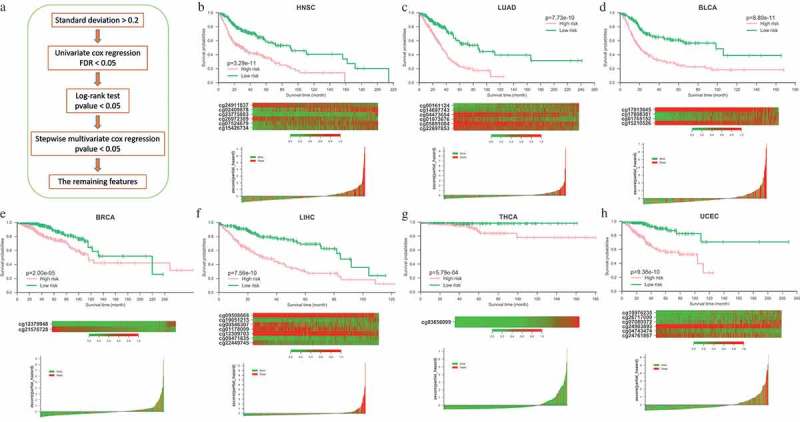
Construction of the probe-based prognostic classifier. (a) Flowchart of the feature selection pipeline for prognostic classifier. (b-h) Prognostic classifier results in 7 cancer types. Lower panel: Z-scores distribution of the prognostic classifier and patient survival status. Middle panel: heatmap shows the methylation of the CpGs used in the prognostic classifier of patients. Upper panel: Kaplan-Meier survival analysis for the patients in each of the 7 cancers. The patients were divided into low-risk and high-risk groups using the median cutoff value of the partial hazard. p-value were calculated by the log-rank test.
We found that most of those probes identified in 7 cancers are located in non-island regions. Moreover, some genes of those CpG sites located have been reported to be associated with the prognosis of various cancers (such as SHANK2 [31], LTBP1 [32], GRIA4 [33], OSR2 [33], PHLDB2 [34], TBX2 [35–37] and GPR37 [38]). Currently, no qualified independent dataset is available for systematically estimating the reproducibility and validity of the probe-based prognostic classifier, thus a further verification of this prognostic model would be necessary in the future.
Discussion
Most of previous cancer researches based on Infinium 450K Methylation Array data mainly focused on the abnormal methylation of CpG islands of gene promoters, but the majority of DMCs between tumor and its adjacent normal samples are located in the gene body and non-CpG regions, as well as the intergenic regions. Those DMCs that are not in promoter regions may also play an important role in tumorigenesis and could be useful in tumor classification. Interestingly, we found that the genes of the frequently hypermethylated DMCs (hypermethylated in at least 7 cancers) are significantly enriched in the biological processes of positive regulation of transcription from RNA polymerase II promoter, transcription from RNA polymerase II promoter, chemical synaptic transmission, and so on. While the genes of frequently hypomethylated DMCs (hypomethylated in at least 8 cancers) are mainly enriched in detection of chemical stimulus involved in sensory perception of smell, olfactory transduction, and G-protein coupled receptor signaling pathway (Supplementary Figure S4).
We identified seven CpG sites that can effectively distinguish tumor from normal samples by building a diagnostic model based on their DNAm level for TCGA pan-cancer. Intriguingly, the genes whose transcriptional level correlated with DNAm level of the 7 probes are mainly enriched in the biological processes that are very important in maintaining the growth and proliferation of tumor cells. Two recent studies also detected potential DNA methylation biomarkers for cancer diagnosis, but they only trained the model within one cancer type [20] or four common cancers [9]. Therefore, the signatures identified in these two previous studies may not be widely applicable to other cancers. Our seven-probes-based model exhibited great performance in both training and validation datasets, which is promising for pan-cancer diagnosis, not limited to a specific cancer type.
Conclusions
The potential biomarkers identified by us could be applicable in terms of clinical decision, prognosis and overall survival prediction through examining the methylation profile of those CpG sites in patients. In addition, the markers for tumor-specific classifier could be used to predict the origin of tumor with metastases or with unknown primary origin. Taken together, we identified potential diagnostic and prognostic biomarkers based on the methylation changes of CpG sites in diverse TCGA cancers, which has the potential to be applicable for human pan-cancer.
Materials and methods
Data source
Gene expression data
We downloaded the RNA-Seq HiSeqV2 level 3 expression data from UCSC Xena (http://xena.ucsc.edu), which had already been log2(x + 1) transformed. Then zeroes were substituted by the minimum positive value in the dataset.
DNA methylation data
The level 3 DNA methylation (Methylation450k) data were downloaded from UCSC Xena and further processed as bellow: i) the probes mapped to the sex chromosomes were removed; ii) the samples with missing data (i.e., NAs) in more than 30% of the probes were excluded; iii) the probes with missing data in more than 30% of the samples were discarded as well; iv) the rest of the probes with NAs were imputed using the EMimpute_array algorithm of LSimpute software [39]; v) BMIQ was employed to correct for the type II probe bias [40]; and vi) the β values less than 0 were set to 0 and values greater than 1 were set to 1.
Detection of batch effect
We used Mbatch (http://bioinformatics.mdanderson.org/tcgambatch) to detect the potential batch effects among the data samples and found that the data we used don't show significant effects (data not shown), which is consistent with previous TCGA works [41–44]. According to previous study [45], batch effects correction algorithms may lead to loss of important biological variation in the data, together with the technical variation, we used the uncorrected data for subsequent identification and analysis.
Clinical data and blacklisted samples
Clinical matrix was downloaded from UCSC Xena (version 2016-04-27). Blacklisted samples are the samples that are reported to be misclassified and should be excluded in subsequent analyzes. We mapped all the sampleIDs we used to the blacklisted samples reported on broad institute website and found that only one sample should be excluded. Thus, we ignored the bias produced by misclassified samples.
Independent validation dataset
Validation datasets were downloaded from GEO (Gene Expression Omnibus, https://www.ncbi.nlm.nih.gov/geo/). GSE69914, GSE76938 and GSE48684 were for diagnostic model, GSE69914, GSE48684, GSE73549, GSE65820, GSE66836 and GSE89852 were for tumor-specific classifier. The validation datasets for tumor with metastases were GSE58999, GSE73549 and GSE38240.
Definition of differentially methylated probes between tumor and normal samples
\We first defined β-difference as the difference between mean β value of tumor and normal samples. Then tumor-normal paired t-test (normal distribution of the data was confirmed by using the normaltest function in Python package Scipy [46]) was performed and the p-value was adjusted by Benjamini/Hochberg method. The probes (CpGs) were defined as DMCs if they met the following criteria of |β-difference| > 0.2 and a false discovery rate (FDR) corrected p-value (Benjamini/Hochberg) < 0.05 [47].
Definition of differentially methylated probes between different cancer types
Similar with the definition of DMCs, but the β-difference and false discovery rate (independent Student’s test, Benjamini-Hochberg method for p-value correction) were between one cancer against the rest of cancers. The probes with |β-difference| > 0.3 and FDR < 0.01 were considered as differentially methylated.
Gene ontology enrichment analysis and pathway enrichment analyzes
Gene Ontology (GO) biological process and KEGG pathway enrichment analyzes were performed using the web-based gene annotation tool, DAVID [48,49]. Terms with FDR ≤ 0.05 were considered as significant.
Feature selection with XGBoost
Extreme Gradient Boosting (XGBoost) [17,50] was used to calculate feature important score and perform feature selection. Recursive feature elimination was performed during feature selection. That is, in each iteration, the features with the minimum score were removed. Then feature important scores for the remained features were calculated again for the iteration. For constructing the diagnostic model, we first filtered out the probes that differentially methylated in less than 5 cancer types, then aforementioned feature selection method was performed on the remaining probes.
Machine learning algorithm
Python package sklearn [51] was used for machine learning training, logistic regression based on the selected seven features was used to construct the tumor-normal diagnostic model. One-vs-the-rest classifier (OneVsRestClassifier, also known as one-vs-all classifier) is a multiclass classifier function of sklearn package. In this study, OneVsRestClassifier with estimator of logistic regression (LogisticRegression function in sklearn) was employed to train the tumor specific multiclass classifier. We randomly split the full dataset into training and test sets with 4:1 ratio in both tumor-normal diagnostic model and tissue-specific classifier.
Unsupervised hierarchical clustering
Python package seaborn was used to perform unsupervised hierarchical clustering and heatmap with average linkage and correlation as the similarity metric.
Statistical analysis
All statistical analyzes were performed with Python3.5.2 on anaconda3-4.0.0. Python package Scipy was used to perform Student’s t-test.
Construction of prognostic model
The following stringent feature selection pipeline was used for constructing the prognostic model. 1) Standard deviation (SD) across all tumor samples of 26 cancers should be > 0.2. 2) FDR (Benjamini/Hochberg method) for every probe was calculated via univariate cox regression in each cancer, the probes with FDR < 0.05 were remained for further filtration. 3) Log-rank test p-value of every probe for overall survival time among tumor samples should be < 0.05. 4) Multivariate cox regression was performed for the remained probes, and then stepwise regression was conducted, the probes of multivariate cox regression p-value > 0.05 were removed from the feature set in each iteration. Finally, the remaining probes were used to fit the prognostic classifier. Python package lifelines (http://lifelines.readthedocs.io/en/latest/index.html) and cox’s proportional hazard model were implemented in cox regression analysis.
Funding Statement
This work was supported by the National High Technology Research and Development Program of China (2015AA020108), National Key Research and Development Program of China (2016YFC0902100), National Science Foundation of China (31671377, 31771460, 91629103) and Shanghai 111 Project (B14019).
Authors’ contributions
T.S., G.C. and W.D. designed the study and wrote the manuscript. W.D. conducted the data analysis. W.D., G.C. and T.S. revised and finalized the manuscript. All authors read and approved the final manuscript.
Availability of data and materials
All data used in this study are available in TCGA Data Portal (https://tcga-data.nci.nih.gov) and GEO (https://www.ncbi.nlm.nih.gov/geo/) with accession numbers of GSE69914, GSE76938, GSE48684, GSE73549, GSE65820, GSE66836, GSE89852, GSE58999 and GSE38240.
Disclosure statement
No potential conflict of interest was reported by the authors.
Supplementary material
Supplemental data for this article can be accessed here.
References
- [1].Paziewska A, Dabrowska M, Goryca K, et al. DNA methylation status is more reliable than gene expression at detecting cancer in prostate biopsy. Br J Cancer. 2014. August 12;111(4):781–789. PubMed PMID: 24937670; PubMed Central PMCID: PMCPMC4134497. [DOI] [PMC free article] [PubMed] [Google Scholar]
- [2].Wu D, Gong C, Su C.. Genome-wide analysis of differential DNA methylation in Silver-Russell syndrome. Sci China Life Sci. 2017. July;60(7):692–699. PubMed PMID: 28624953. [DOI] [PubMed] [Google Scholar]
- [3].Chen G, Shi T, Shi L. Characterizing and annotating the genome using RNA-seq data. Sci China Life Sci. 2017. February;60(2):116–125. PubMed PMID: 27294835. [DOI] [PubMed] [Google Scholar]
- [4].Liu M, Shi T. Ten years of achievements in biological and medical sciences. Sci China Life Sci. 2017. February;60(2):111–115. PubMed PMID: 28215028. [DOI] [PubMed] [Google Scholar]
- [5].Wang J, Han X, Sun Y. DNA methylation signatures in circulating cell-free DNA as biomarkers for the early detection of cancer. Sci China Life Sci. 2017. April;60(4):356–362. PubMed PMID: 28063009. [DOI] [PubMed] [Google Scholar]
- [6].Lin RK, Wang YC. Dysregulated transcriptional and post-translational control of DNA methyltransferases in cancer. Cell Biosci. 2014;4:46 PubMed PMID: 25949795; PubMed Central PMCID: PMC4422219. [DOI] [PMC free article] [PubMed] [Google Scholar]
- [7].Rajaraman P, Anderson BO, Basu P, et al. Recommendations for screening and early detection of common cancers in India. Lancet Oncol. 2015;16(7):e352–e361. [DOI] [PubMed] [Google Scholar]
- [8].Wei JH, Haddad A, Wu KJ, et al. A CpG-methylation-based assay to predict survival in clear cell renal cell carcinoma. Nat Commun. 2015. October 30;6:8699 PubMed PMID: 26515236; PubMed Central PMCID: PMCPMC4846314. [DOI] [PMC free article] [PubMed] [Google Scholar]
- [9].Hao X, Luo H, Krawczyk M, et al. DNA methylation markers for diagnosis and prognosis of common cancers. Proc Natl Acad Sci U S A. 2017 Jul 11;114(28):7414–7419. PubMed PMID: 28652331. [DOI] [PMC free article] [PubMed] [Google Scholar]
- [10].Tang W, Wan S, Yang Z, et al. Tumor origin detection with tissue-specific miRNA and DNA methylation markers. Bioinformatics. 2017. September 28 PubMed PMID: 29028927 DOI: 10.1093/bioinformatics/btx622 [DOI] [PubMed] [Google Scholar]
- [11].Ji H, Ehrlich LI, Seita J, et al. Comprehensive methylome map of lineage commitment from haematopoietic progenitors. Nature. 2010. September 16;467(7313):338–342. PubMed PMID: 20720541; PubMed Central PMCID: PMC2956609. [DOI] [PMC free article] [PubMed] [Google Scholar]
- [12].Rao X, Evans J, Chae H, et al. CpG island shore methylation regulates caveolin-1 expression in breast cancer. Oncogene. 2013. September 19;32(38):4519–4528. PubMed PMID: 23128390; PubMed Central PMCID: PMC3787796. [DOI] [PMC free article] [PubMed] [Google Scholar]
- [13].Irizarry RA, Ladd-Acosta C, Wen B, et al. The human colon cancer methylome shows similar hypo- and hypermethylation at conserved tissue-specific CpG island shores. Nat Genet. 2009. February;41(2):178–186. PubMed PMID: 19151715; PubMed Central PMCID: PMC2729128. [DOI] [PMC free article] [PubMed] [Google Scholar]
- [14].Jjingo D, Conley AB, Yi SV, et al. On the presence and role of human gene-body DNA methylation. Oncotarget. 2012. April;3(4):462–474. PubMed PMID: 22577155; PubMed Central PMCID: PMC3380580. [DOI] [PMC free article] [PubMed] [Google Scholar]
- [15].Gevaert O, Tibshirani R, Plevritis SK. Pancancer analysis of DNA methylation-driven genes using MethylMix. Genome Biol. 2015. January 29;16:17 PubMed PMID: 25631659; PubMed Central PMCID: PMC4365533. [DOI] [PMC free article] [PubMed] [Google Scholar]
- [16].Yang X, Gao L, Zhang S. Comparative pan-cancer DNA methylation analysis reveals cancer common and specific patterns. Brief Bioinform. 2017. September 1;18(5):761–773. PubMed PMID: 27436122. [DOI] [PubMed] [Google Scholar]
- [17].Chen T, Guestrin C, editors. Xgboost: A scalable tree boosting system. Proceedings of the 22nd acm sigkdd international conference on knowledge discovery and data mining ACM; San Francisco, CA: University of Washington; 2016. [Google Scholar]
- [18].Teschendorff AE, Gao Y, Jones A, et al. DNA methylation outliers in normal breast tissue identify field defects that are enriched in cancer. Nat Commun. 2016. January 29;7:10478 PubMed PMID: 26823093; PubMed Central PMCID: PMCPMC4740178. [DOI] [PMC free article] [PubMed] [Google Scholar]
- [19].Luo Y, Wong CJ, Kaz AM, et al. Differences in DNA methylation signatures reveal multiple pathways of progression from adenoma to colorectal cancer. Gastroenterology. 2014. August;147(2):418–29 e8. PubMed PMID: 24793120; PubMed Central PMCID: PMCPMC4107146. [DOI] [PMC free article] [PubMed] [Google Scholar]
- [20].Kirby MK, Ramaker RC, Roberts BS, et al. Genome-wide DNA methylation measurements in prostate tissues uncovers novel prostate cancer diagnostic biomarkers and transcription factor binding patterns. BMC Cancer. 2017. April 17;17(1):273 PubMed PMID: 28412973; PubMed Central PMCID: PMC5392915. [DOI] [PMC free article] [PubMed] [Google Scholar]
- [21].Chen J, Wang Q, Zhang W, et al. [Biological effect of down-regulating of MTRR gene on cisplatin-resistant ovarian cancer SKOV3 cells in vitro and in vivo studies]. Zhonghua Fu Chan Ke Za Zhi. 2016. February;51(2):126–134. PubMed PMID: 26917482. [DOI] [PubMed] [Google Scholar]
- [22].Chen D, Sun Q, Cheng X, et al. Genome-wide analysis of long noncoding RNA (lncRNA) expression in colorectal cancer tissues from patients with liver metastasis. Cancer Med. 2016. July;5(7):1629–1639. PubMed PMID: 27165481; PubMed Central PMCID: PMCPMC4867661. [DOI] [PMC free article] [PubMed] [Google Scholar]
- [23].Daugaard I, Dominguez D, Kjeldsen TE, et al. Identification and validation of candidate epigenetic biomarkers in lung adenocarcinoma. Sci Rep. 2016. October 26;6:35807 PubMed PMID: 27782156; PubMed Central PMCID: PMCPMC5080630 concerning MS-HRM technology. [DOI] [PMC free article] [PubMed] [Google Scholar]
- [24].Fleischer T, Tekpli X, Mathelier A, et al. DNA methylation at enhancers identifies distinct breast cancer lineages. Nat Commun. 2017. November 09;8(1):1379 PubMed PMID: 29123100. [DOI] [PMC free article] [PubMed] [Google Scholar]
- [25].Mundbjerg K, Chopra S, Alemozaffar M, et al. Identifying aggressive prostate cancer foci using a DNA methylation classifier. Genome Biol. 2017. January 12;18(1):3 PubMed PMID: 28081708; PubMed Central PMCID: PMCPMC5234101. [DOI] [PMC free article] [PubMed] [Google Scholar]
- [26].Patch AM, Christie EL, Etemadmoghadam D, et al. Whole-genome characterization of chemoresistant ovarian cancer. Nature. 2015. May 28;521(7553):489–494. PubMed PMID: 26017449. [DOI] [PubMed] [Google Scholar]
- [27].Bjaanaes MM, Fleischer T, Halvorsen AR, et al. Genome-wide DNA methylation analyses in lung adenocarcinomas: association with EGFR, KRAS and TP53 mutation status, gene expression and prognosis. Mol Oncol. 2016. February;10(2):330–343. PubMed PMID: 26601720. [DOI] [PMC free article] [PubMed] [Google Scholar]
- [28].Kuramoto J, Arai E, Tian Y, et al. Genome-wide DNA methylation analysis during non-alcoholic steatohepatitis-related multistage hepatocarcinogenesis: comparison with hepatitis virus-related carcinogenesis. Carcinogenesis. 2017. March 01;38(3):261–270. PubMed PMID: 28426876. [DOI] [PMC free article] [PubMed] [Google Scholar]
- [29].Reyngold M, Turcan S, Giri D, et al. Remodeling of the methylation landscape in breast cancer metastasis. PloS one. 2014;9(8):e103896 PubMed PMID: 25083786; PubMed Central PMCID: PMC4118917. [DOI] [PMC free article] [PubMed] [Google Scholar]
- [30].Aryee MJ, Liu W, Engelmann JC, et al. DNA methylation alterations exhibit intraindividual stability and interindividual heterogeneity in prostate cancer metastases. Sci Transl Med. 2013. January 23;5(169):169ra10 PubMed PMID: 23345608; PubMed Central PMCID: PMC3577373. [DOI] [PMC free article] [PubMed] [Google Scholar]
- [31].Qin HD, Liao XY, Chen YB, et al. Genomic characterization of esophageal squamous cell carcinoma reveals critical genes underlying tumorigenesis and poor prognosis. Am J Hum Genet. 2016. April 07;98(4):709–727. PubMed PMID: 27058444; PubMed Central PMCID: PMCPMC4833434. [DOI] [PMC free article] [PubMed] [Google Scholar]
- [32].Holmila R, Sklias A, Muller DC, et al. Targeted deep sequencing of plasma circulating cell-free DNA reveals Vimentin and Fibulin 1 as potential epigenetic biomarkers for hepatocellular carcinoma. PloS one. 2017;12(3):e0174265 PubMed PMID: 28333958; PubMed Central PMCID: PMCPMC5363871. [DOI] [PMC free article] [PubMed] [Google Scholar]
- [33].Kostareli E, Holzinger D, Bogatyrova O, et al. HPV-related methylation signature predicts survival in oropharyngeal squamous cell carcinomas. J Clin Invest. 2013. June;123(6):2488–2501. PubMed PMID: 23635773; PubMed Central PMCID: PMC3668826. [DOI] [PMC free article] [PubMed] [Google Scholar]
- [34].Hoshino I, Akutsu Y, Murakami K, et al. Histone demethylase LSD1 inhibitors prevent cell growth by regulating gene expression in esophageal squamous cell carcinoma cells. Ann Surg Oncol. 2016. January;23(1):312–320. PubMed PMID: 25791791. [DOI] [PubMed] [Google Scholar]
- [35].Yi F, Du J, Ni W, et al. Tbx2 confers poor prognosis in glioblastoma and promotes temozolomide resistance with change of mitochondrial dynamics. Onco Targets Ther. 2017;10:1059–1069. PubMed PMID: 28260920; PubMed Central PMCID: PMCPMC5325101. [DOI] [PMC free article] [PubMed] [Google Scholar]
- [36].Kandimalla R, van Tilborg AA, Kompier LC, et al. Genome-wide analysis of CpG island methylation in bladder cancer identified TBX2, TBX3, GATA2, and ZIC4 as pTa-specific prognostic markers. Eur Urol. 2012. June;61(6):1245–1256. PubMed PMID: 22284968. [DOI] [PubMed] [Google Scholar]
- [37].Hu B, Mu HP, Zhang YQ, et al. Prognostic significance of TBX2 expression in non-small cell lung cancer. J Mol Histol. 2014. August;45(4):421–426. PubMed PMID: 24531749. [DOI] [PubMed] [Google Scholar]
- [38].Liu F, Zhu C, Huang X, et al. A low level of GPR37 is associated with human hepatocellular carcinoma progression and poor patient survival. Pathol Res Pract. 2014. December;210(12):885–892. PubMed PMID: 25169131. [DOI] [PubMed] [Google Scholar]
- [39].Bo TH, Dysvik B, Jonassen I. LSimpute: accurate estimation of missing values in microarray data with least squares methods. Nucleic Acids Res. 2004. February 20;32(3):e34 PubMed PMID: 14978222; PubMed Central PMCID: PMC374359. [DOI] [PMC free article] [PubMed] [Google Scholar]
- [40].Teschendorff AE, Marabita F, Lechner M, et al. A beta-mixture quantile normalization method for correcting probe design bias in Illumina Infinium 450 k DNA methylation data. Bioinformatics. 2013. January 15;29(2):189–196. PubMed PMID: 23175756; PubMed Central PMCID: PMC3546795. [DOI] [PMC free article] [PubMed] [Google Scholar]
- [41].Cancer Genome Atlas N Comprehensive genomic characterization of head and neck squamous cell carcinomas. Nature. 2015. January 29;517(7536):576–582. PubMed PMID: 25631445; PubMed Central PMCID: PMC4311405. [DOI] [PMC free article] [PubMed] [Google Scholar]
- [42].Cancer Genome Atlas Research N Comprehensive molecular characterization of urothelial bladder carcinoma. Nature. 2014. March 20;507(7492):315–322. PubMed PMID: 24476821; PubMed Central PMCID: PMC3962515. [DOI] [PMC free article] [PubMed] [Google Scholar]
- [43].Cancer Genome Atlas Research N, Kandoth C, Schultz N, et al. Integrated genomic characterization of endometrial carcinoma. Nature. 2013. May 2;497(7447):67–73. PubMed PMID: 23636398; PubMed Central PMCID: PMC3704730. [DOI] [PMC free article] [PubMed] [Google Scholar]
- [44].Hoadley KA, Yau C, Wolf DM, et al. Multiplatform analysis of 12 cancer types reveals molecular classification within and across tissues of origin. Cell. 2014. August 14;158(4):929–944. PubMed PMID: 25109877; PubMed Central PMCID: PMC4152462. [DOI] [PMC free article] [PubMed] [Google Scholar]
- [45].Zhang H, Deng Y, Zhang Y, et al. Cooperative genomic alteration network reveals molecular classification across 12 major cancer types. Nucleic Acids Res. 2017. January 25;45(2):567–582. PubMed PMID: 27899621; PubMed Central PMCID: PMC5314758. [DOI] [PMC free article] [PubMed] [Google Scholar]
- [46].Jones E, Oliphant T, Peterson P. {SciPy}: open source scientific tools for {Python}. 2014. https://www.scipy.org [Google Scholar]
- [47].Naumov VA, Generozov EV, Zaharjevskaya NB, et al. Genome-scale analysis of DNA methylation in colorectal cancer using Infinium HumanMethylation450 BeadChips. Epigenetics. 2013. September;8(9):921–934. PubMed PMID: 23867710; PubMed Central PMCID: PMCPMC3883769. [DOI] [PMC free article] [PubMed] [Google Scholar]
- [48].da Huang W, Sherman BT, Lempicki RA. Systematic and integrative analysis of large gene lists using DAVID bioinformatics resources. Nat Protoc. 2009;4(1):44–57. PubMed PMID: 19131956. [DOI] [PubMed] [Google Scholar]
- [49].da Huang W, Sherman BT, Lempicki RA. Bioinformatics enrichment tools: paths toward the comprehensive functional analysis of large gene lists. Nucleic Acids Res. 2009. January;37(1):1–13. PubMed PMID: 19033363; PubMed Central PMCID: PMCPMC2615629. [DOI] [PMC free article] [PubMed] [Google Scholar]
- [50].Friedman JH. Greedy function approximation: A gradient boosting machine. Ann Stat. 2001. October;29(5):1189–1232. PubMed PMID: WOS:000173361700001; English. [Google Scholar]
- [51].Pedregosa F, Varoquaux G, Gramfort A, et al. Scikit-learn: machine learning in Python. J Mach Learn Res. 2011;12(Oct):2825–2830. [Google Scholar]
Associated Data
This section collects any data citations, data availability statements, or supplementary materials included in this article.
Supplementary Materials
Data Availability Statement
All data used in this study are available in TCGA Data Portal (https://tcga-data.nci.nih.gov) and GEO (https://www.ncbi.nlm.nih.gov/geo/) with accession numbers of GSE69914, GSE76938, GSE48684, GSE73549, GSE65820, GSE66836, GSE89852, GSE58999 and GSE38240.