

Supplemental Digital Content is available in the text
Keywords: early gastric cancer, invasion, meta-analysis, Miniprobe endoscopic ultrasonography
Abstract
Background:
Recently, some studies assessed the clinical utility of miniprobe endoscopic ultrasonography for prediction of invasion depth of early gastric cancer (GC). However, the results remain inconsistent.
Objectives:
We conducted a meta-analysis to assess the clinical utility of miniprobe endoscopic ultrasonography for diagnostic of invasion depth of early GC.
Methods:
We systematically searched several online electronic databases including PubMed, China National Knowledge Infrastructure, Web of Science, Embase, and Wanfang from initial library to July 20, 2018, identifying the study about miniprobe endoscopic ultrasonography for diagnostic of invasion depth of early GC. Bivariate mixed effects models were used to calculate the sensitivity, specificity, positive likelihood ratio (PLR), negative likelihood ratio (NLR), diagnostic odds ratio (DOR) with theirs 95% confidence intervals (CIs).
Results:
Nineteen studies with 3401 patients were included in the meta-analysis. The bivariate mixed effect model indicated that the overall diagnostic sensitivity was 0.86 (95%CI: 0.79–0.91) and the specificity was 0.73 (95%CI: 0.66–0.78). The area under the curve was 0.84 (95%CI: 0.81–0.87). We also estimated the other pooled parameters as follows: the pooled PLR was 3.13 (95%CI: 2.55–3.84), the pooled NLR was 0.19 (95%CI: 0.13–0.28), the diagnostic score was 2.78 (95%CI: 2.33–3.23), and the diagnostic odds ratio was 16.1 (95%CI: 10.23–25.36). Subgroup analysis indicated that ethnicity may be the decisive factor on heterogeneity.
Conclusions:
The present study indicated that the miniprobe endoscopic ultrasonography had a moderate diagnostic ability for invasion depth of early GC. The diagnostic utility was influenced by ethnicity. Further research is required to confirm the present findings and explore the potential factors of heterogeneity.
1. Introduction
Gastric cancer (GC) is one of the most common malignant tumors of the digestive system in the world, growing at nearly 800,000 new cases every year, and is in the fourth place in the global incidence of malignant tumors, according to World Health Organization statistics.[1] According to geographical location, stomach cancer occurs mainly in Asia, Africa and South America, and other developing countries. In Asian countries, for example, China, Japan, and South Korea, new GC cases of each year accounts for two-thirds of global cases.[2] With the application of improved surgical techniques and chemotherapy and other technical means, the mortality rate of GC has decreased, but the 5-year survival rate of GC is still poor.[3,4] Early identification and diagnostic of progress of GC is very important.
Many medical research and clinical practice have proved that the prognosis of GC was associated with the clinical stages, early GC 5-year survival rate was above 90%, and 5-year survival rate is only 10% or so of advanced GC.[5,6] At present, the developed countries such as Japan in the early diagnosis of GC is as high as 50%, and less than 10% in China, the middle-late GC was more than 90%, many patients with obvious symptoms during middle-late, lost the best period of treatment, which call lead to poor prognosis.[7,8] Therefore, further study of the cause of GC, to take effective preventive measures, positive development and promotion GC early diagnosis technology and the treatment of precancerous lesions have very important implications. Clinical practices used to mainly count on gastroscopy and X-ray barium swallow opacification to give the examination, yet these means have limitations. In contrast, it has distinctive features of its own to employ endoscopic ultrasonography as the imagological means of carcinoma of stomach. GC's pathological changes begin from the mucous layer and gradually intrudes into the submucous, muscular layer, and placenta percreta and till the gastric wall. The increases in depth to some degree, and other layers disappear eventually. Five-stratum structure of gastric wall provides the structural base for the invasion depth diagnosis of GC through endoscopic ultrasonography. Recently, some studies assessed the clinical utility of miniprobe endoscopic ultrasonography for prediction of invasion depth of early GC. However, the results still remain inconsistent. We conducted a comprehensive analysis to evaluate the clinical utility of miniprobe endoscopic ultrasonography for prediction of invasion depth of early GC.
2. Materials and methods
This meta-analysis was in accordance with the Preferred Reporting Items for Systematic Reviews and Meta-Analyses (PRISMA) and Cochrane Handbook for Systematic Reviews of diagnostic test (Supplementary material 1). This meta-analysis also followed the PICOS guidelines. For this study: Patients(P): people with GC; Itervention(I): miniprobe endosopy ultrasonography; Comparison/control(C): pathology; Outcomes (O): early invasion; Study (S): screening test.
2.1. Literature search
We systematically searched several online electronic databases including PubMed, China National Knowledge Infrastructure, Web of Science, Embase, Wanfang, Weipu, OVID, and Google Scholar from initial library to December 20, 2018. The following medical subject heading terms and keywords were used: “endoscopy ultrasonography” OR “miniprobe endosopy ultrasonography” OR “EUS”, “GC” OR “gastric carcinoma” OR “stomach cancer” OR “gastric tumor” OR “GC”; “sensitivity” OR “specificity” OR “receiver operating characteristic curve” OR “ROC”; “invasion depth”; “early stage”. The specific strategy for each database was presented in the Supplementary material 1. We placed language restriction in Chinese and English. The relevant references list of reviews was also reviewed for potentially study. The corresponding author would be contacted if full-text cannot be achieved. We also manually search some journals and data in the library to obtain study data including grey literature as possible as we can.
2.2. Criteria for inclusion and exclusion
Two investigators independently screened the studies according to the criteria. Any disagreements would be resolved by consensus. The included studies had to meet the following criteria:
-
(1)
study evaluated the diagnostic ability of miniprobe endoscopic ultrasonography for invasion depth of early GC
-
(2)
the types of GC were confirmed by pathology examination;
-
(3)
study must provide data for further analysis, including true positive (TP), false positive (FP), false negative (FN), and true negative (TN).
Exclusion criteria: studies without sufficient data or did not focus on GC were excluded. Reviews, case reports, comments, letter, and non-human being studies were also excluded. For duplicates, the latest or the largest sample size 1 was used.
2.3. Data extraction
The standard excel sheet was used to extract dad from each included study. Two investigators independently conducted the data extraction process. The inconsistent data would be checked. For each included study, the following information was extracted: surname of the first author, year of publication, country, machine type, MHz, golden standard, study design, mean age of study population, 4 folds data (TP, FP, FN, TN), sample size, sensitivity, and specificity of each study. For missing data, we would try to contact author by e-mail.
2.4. Assessment of quality
According to the recommendation of Cochrane handbook for systematic reviews of diagnostic test, the quality assessment of diagnostic accuracy studies version 2 was used to assess the quality of each included study.[9] This scale assessed the quality of study from risk of bias and applicability concerns. The domain of risk of bias included four sub-items: patient selection, index test, reference standard, flow and timing while the applicability concerns consisted of three sub-items: patient selection, index test and reference standard. Each item had 3 options: yes, no, and unclear. Study with high risk of bias for ≥1 item was considered to be at high concern whereas study with yes for all items were considered to be at low concern; Otherwise they were considered to be at unclear risk of bias or unclear concern.
2.5. Statistical analysis
Threshold effect was firstly examined by Spearman coefficient between sensitivity and specificity before the bivariate random effect model was conducted.[10] No significant threshold effect was found (r = 0.425, P = .070) for present study. Heterogeneity was evaluated by I2 statistic and Q test. I2 > 50% indicated the existence of heterogeneity.[11,12] Accordingly, the summary receiver operating characteristic curve (SROC) was fitted. The bivariate mixed effects models were used to calculate the sensitivity, specificity, positive likelihood ratio (PLR), negative likelihood ratio (NLR), diagnostic odds ratio (DOR) with theirs 95% confidence interval (CI).[13] Subgroup analysis was conducted in difference country, publication year and sample size. The funnel plot was used to evaluate the publication bias, and Begg and Egger tests were also conducted.[14] The following guidelines have been suggested for interpretation of intermediate AUROC values: low (0.5 >= AUC <= 0.7), moderate (0.7 >= AUC <= 0.9), or high (0.9 >= AUC <= 1) accuracy.[15] All analyses were completed on Stata 14.0 platform (Corp, College Station TX). The quality of study was achieved on Review Manager 5.3 (The Nordic Cochrane Centre, The Cochrane Collaboration, 2014). P < 0.05 was considered as significant level.
2.6. Ethical approval
Since meta-analysis belonged to secondary analysis based on the studies published previously, the patients’ informed consent and the ethical approval were not necessary.
3. Results
3.1. Study selection
The Figure 1 presented the process of literature search and selection. We initially obtained 341 studies identified through database searching. Eighty-five duplicates records were excluded. Two hundred fifty-six studies were screened via scanning title and abstract. One hundred eighty-two records were excluded because of types of reviews, duplicates and unrelated topic. Seventy-four records were assessed for eligibility via full-text. Fifty-five records were excluded because of variety of reasons including 12 studies with unrelated to diagnostic value, 8 records with insufficient data, 8 duplicates, 16 case reports, and 11 reviews, comments or letters. Finally, 19 studies with enough data were included in the meta-analysis (Supplementary material 2).
Figure 1.
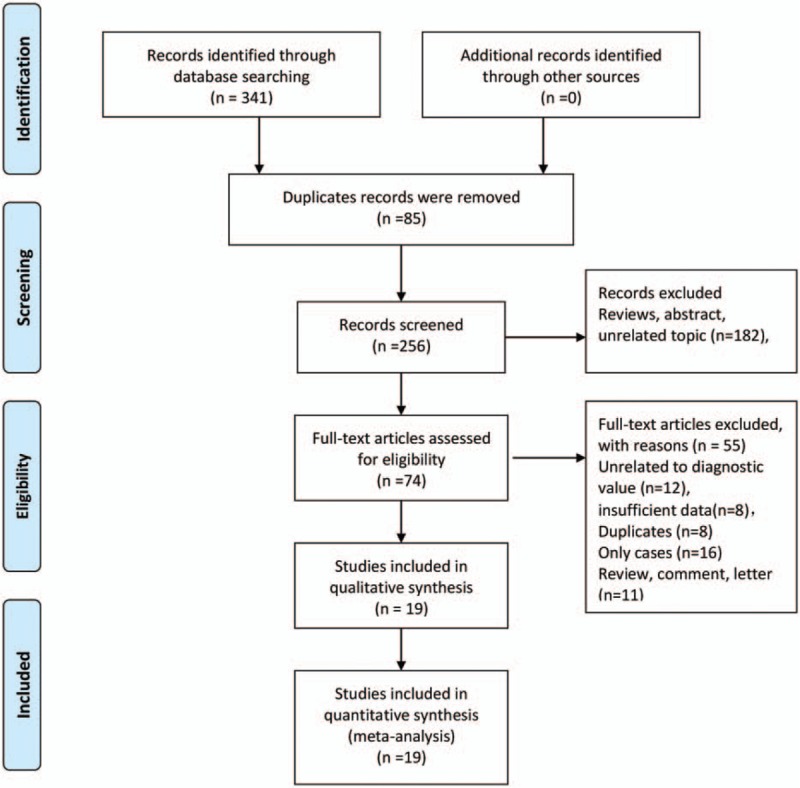
Flow chart of study selection.
3.2. General characteristic of included studies
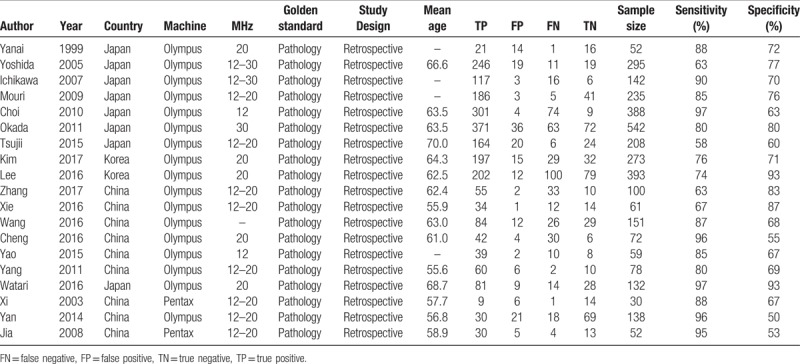
The Table 1 summarized the general characteristics of included in the meta-analysis. Nineteen studies consisted of 3401 patients, and the sample size range from 30 to 542. The mean age fallen into range of 55.6 to 70.0. These studies were published from 1999 to 2017. Eight studies were from Japan, 9 studies were from China and 2 studies were from Korea. All patients were confirmed by pathology examination, and all studies were based on retrospective design. Most of study conducted the ultrasonography diagnostic by using Olympus (n = 17), and 2 studies used the Pentax. The MHz range of examination were from 12 to 30 MHz. The sensitivity of individual study ranges from 63% to 97%, and the specificity were from 53% to 93%.
Table 1.
General characteristics of studies included in the meta-analysis.
3.3. Assessment of quality
The Figures 2 and 3 presented the risk of bias and applicability concerns graph (review authors’ judgements about each domain presented as percentages across included studies) and (Risk of bias and applicability concerns summary: review authors’ judgements about each domain for each included study). Four studies give unclear description about index text that results were interpreted without knowledge of result of the reference standard. One study was considered as unclear risk in reference standard. One study was scored unclear risk and 1 study was considered as high risk in flow and timing, which means the patient flow could have introduced bias. For applicability concerns, 2 studies were treated as unclear concerns in patients’ selection, 1 study had unclear index test, and 1 study had high concerns in index test. Five studies indicated unclear concerns in reference standard. In brief, the whole quality of included studies was quite high.
Figure 2.
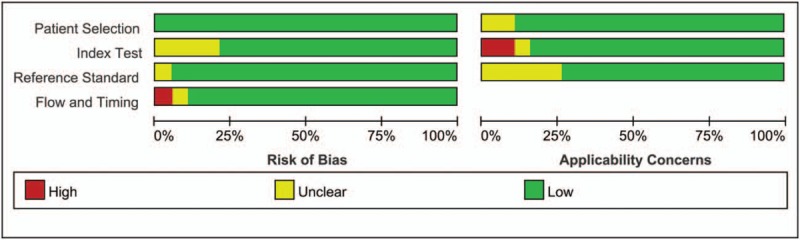
Risk of bias and applicability concerns graph: review authors’ judgements about each domain presented as percentages across included studies.
Figure 3.
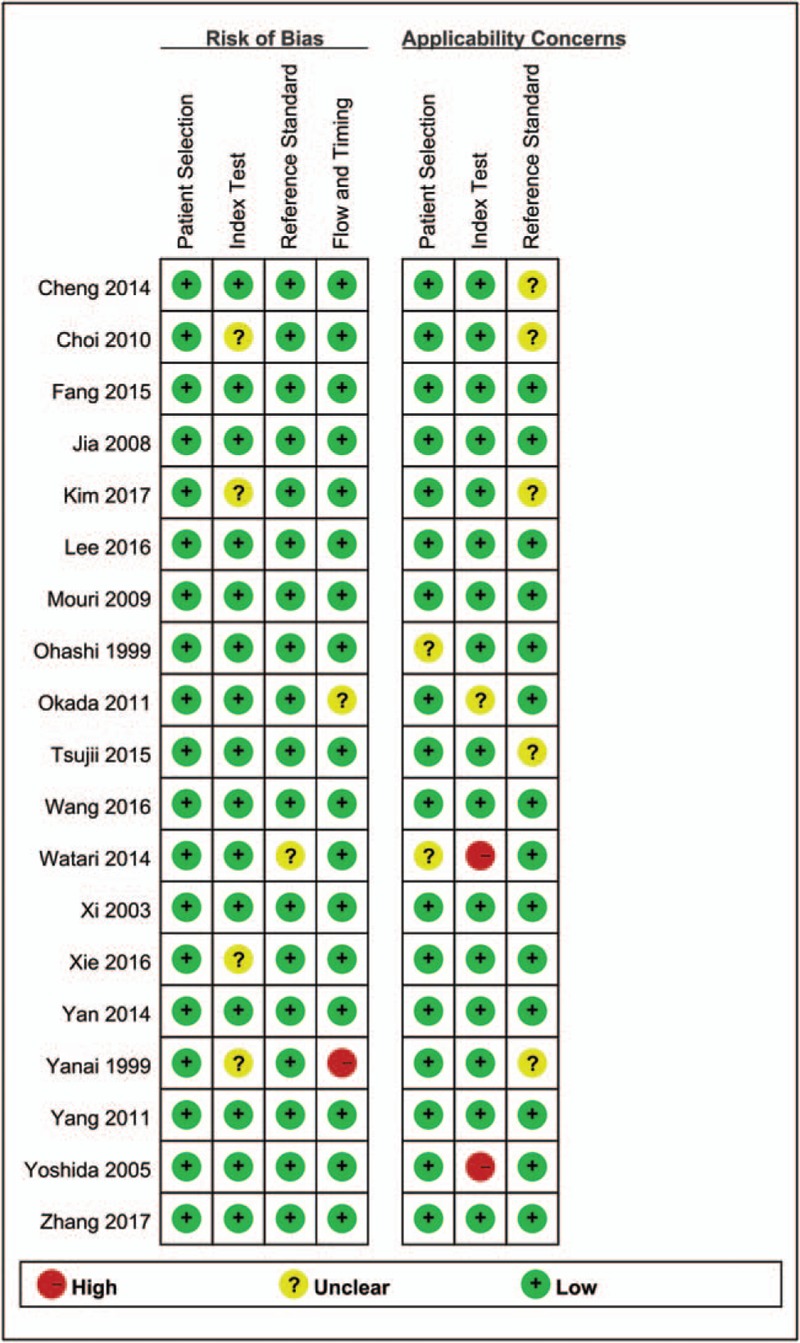
Risk of bias and applicability concerns summary: review authors’ judgements about each domain for each included study.
3.4. Pooled results
The heterogeneity within studies were high (I2 > 50%, P < .05) The bivariate mixed effect model indicated that the overall diagnostic sensitivity was 0.86 (95%CI: 0.79–0.91, Fig. 4A) and the specificity was 0.73 (95%CI: 0.66–0.78, Fig. 4B). The Figure 5 showed the SROC curve of miniprobe endoscopic ultrasonography for prediction of invasion depth of early GC. The area under the curve was 0.84 (95%CI: 0.81–0.87), which means the diagnostic ability of miniprobe endoscopic ultrasonography was moderate according to the diagnostic accuracy criteria. We also estimated the other overall pooled parameters as follows: the pooled PLR was 3.13 (95%CI: 2.55–3.84), the pooled NLR was 0.19 (95%CI: 0.13–0.28), the diagnostic score was 2.78 (95%CI: 2.33–3.23), and the diagnostic odds ratio was 16.1(95%CI: 10.23–25.36). The Figure 6A presented the Fagan plot. The results showed that the post-probability was 44% when the pre-test probability was 20% with a PLR value of 3. The post-probability was 5% when the pre-test probability was 20% with a NLR value of 5. According to the criteria (Left upper quadrant: LRP > 10, LRN < 0.1: Exclusion & Confirmation; Right upper quadrant: RLRP > 10, LRN > 0.1: Confirmation Only; Left lower quadrant: LRP < 10, LRN < 0.1: Exclusion Only; Right lower quadrant: LRP < 10, LRN > 0.1: No Exclusion or Confirmation). The diagnostic ability of miniprobe endoscopic ultrasonography was moderate (Fig. 6B).
Figure 4.
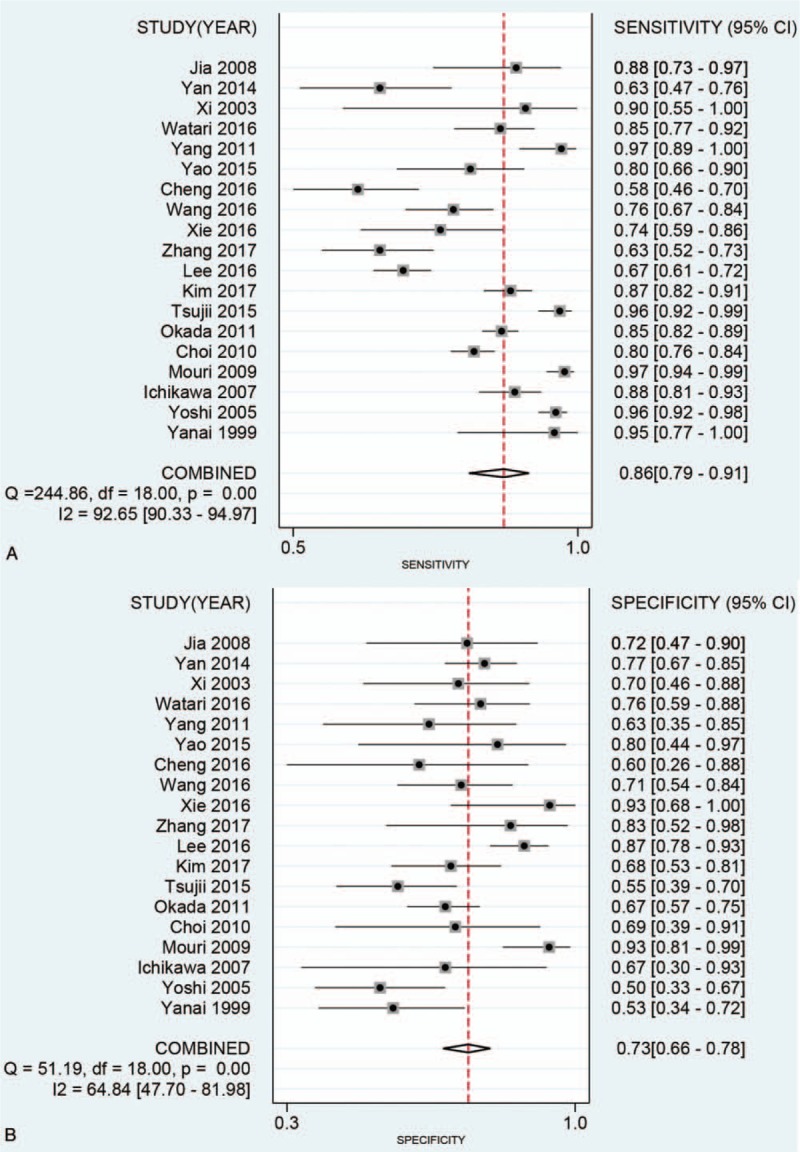
Forest plot for pooled sensitivity (A) and specificity (B) of miniprobe endoscopic ultrasonography for prediction of invasion depth of early gastric cancer.
Figure 5.
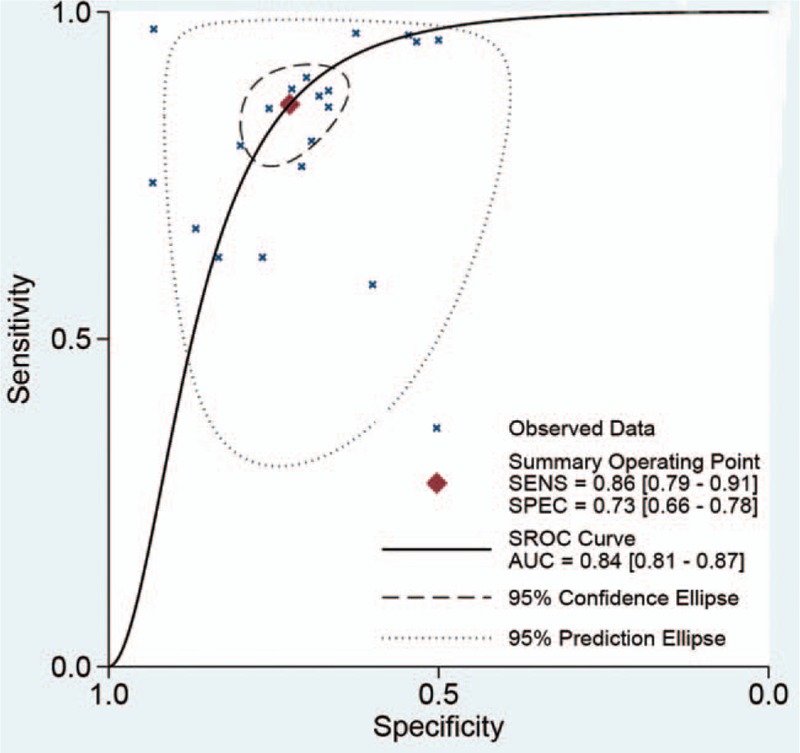
The SROC curve of miniprobe endoscopic ultrasonography for prediction of invasion depth of early gastric cancer.
Figure 6.

Fagan diagram (A) and Likelihood ratio scatter gram (B) evaluating the overall diagnostic value of miniprobe endoscopic ultrasonography for prediction of invasion depth of early gastric cancer.
3.5. Subgroup analysis
We also conducted subgroup analysis in different country (China vs other country), and sample size setting (≤100 vs >100). The pooled sensitivity, specificity, PLR, NLR, and AUC was as follows: China (0.78, 0.74, 3.00, 0.30, and 0.78), Japan and Korea (0.90, 0.71, 3.07, 0.14, and 0.88). There was significant difference between pooled data in ethnicity group, with significant AUC (0.78, 95CI%: 0.74–0.82 vs 0.88, 95%CI: 0.85–0.90), between China and Japan and Korea. It suggested that ethnicity may be the decisive factor on heterogeneity. For sample size, the pooled sensitivity, specificity, PLR, NLR was 0.76 (95%CI:0.71–0.80), 0.69 (95%CI: 0.61–0.77), 2.52 (95%CI:1.89–3.36), 0.26 (95%CI:0.15–0.44) for ≤100 and 0.87 (95%CI:0.79–0.92), 0.73 (95%CI: 0.64–0.80), 3.17 (95%CI:2.41–4.16), 0.17 (95%CI:0.11–0.28) for >100. There was no big difference between pooled data in different sample size setting, with similar sensitivity and specificity and AUC between ≤100 vs >100 (AUC:0.81, 95%CI: 0.77–0.84 vs 0.85, 95%CI:0.82–0.88), suggesting that the sample size was not the source of heterogeneity within studies. We also conducted subgroup in different publication year, before 2012 (sensitivity: 0.92, specificity: 0.68, PLR: 2.91, NNLR: 0.12, AUC: 0.89, 95%CI: 0.86–0.91), after 2012 (sensitivity:0.77, specificity: 0.77, PLR: 3.32, NNLR: 0.31, AUC: 0.83, 95%CI: 0.79–0.86). Slight significant difference was found in AUC between before 2012 and after 2012. The publication could be another factor of heterogeneity.
3.6. Sensitivity analysis and publication bias
Sensitivity analysis was conducted in overall diagnostic ability. We conducted sensitivity analysis by omitting one study each time and pooled the rest of data. The results indicated that the pooled estimations were stable (Fig. 7). The publication bias was evaluated by a Funnel plot. The funnel plot is slightly asymmetrical, which means there may be publication bias (Fig. 8). But the Egger and Begg test did not indicate publication bias (Z = 0.800, P = .441; t = 1.100, P = .287).
Figure 7.
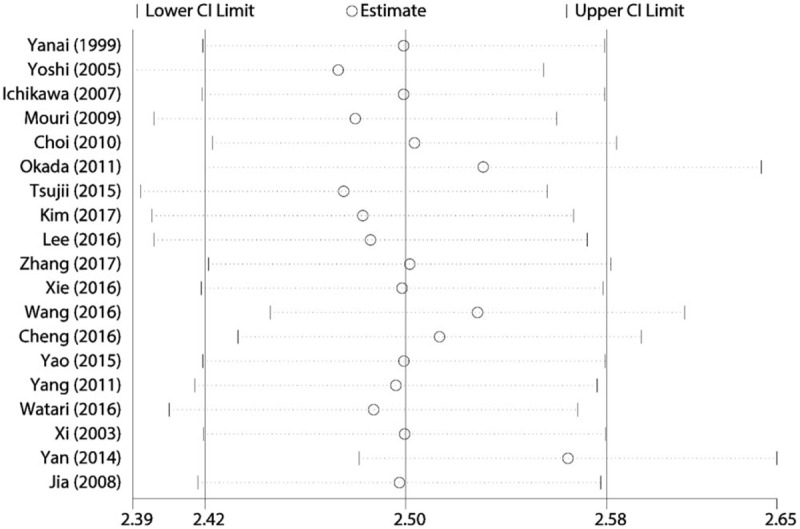
Sensitivity analysis for pooled results.
Figure 8.
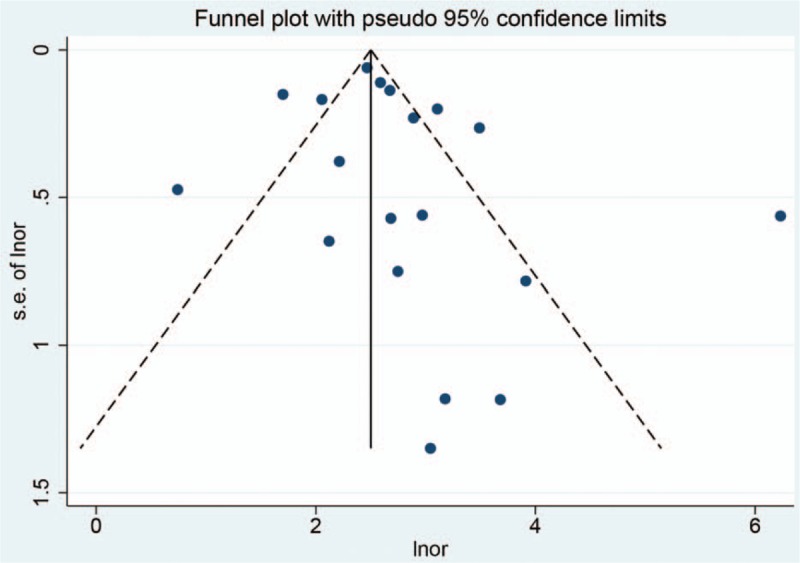
Funnel plot for publication bias.
4. Discussion
GC is one of the most common gastrointestinal cancer with high rates of cancer-related mortality in all kinds of cancer worldwide.[16] Due to the lack of specific clinical presentations or radiographic features, most early GC patients are delayed diagnostic.[17] Despite the considerable improvement in cancer diagnostic and comprehensive therapy, patients with advanced GC still have poor prognosis. As is well-known that invasion and metastasis are the great challenge of curing malignant tumors.[18,19] Therefore, it is the key for GC to early identification and diagnostic for early treatment. It was reported that the 5-year overall and disease-specific survival rates were 97.1% and 100%, respectively when patients received endoscopic mucosal resection or endoscopic submucosal dissection under some conditions.[20] Some pathology features of early GC such as lesions size, presence or absence of ulcers, differentiation could be assessed by endoscopic gross morphology, indigo carmine staining, and ME-NBI.[21] However, at present, it is limited that judgement of invasion depth is mostly based on the general morphological characteristic of lesions.[22,23] Although many recent studies have been conducted to diagnosis the gastric mucosal surface structure and vascular characteristics under ME-NBI, it is still cannot be accurately determined for invasion depth of early GC.
In this meta-analysis, we found that miniprobe endoscopic ultrasonography achieved the overall sensitivity of 0.86 (95%CI: 0.79–0.91) and specificity of 0.73 (95%CI: 0.66–0.78, and AUC of 0.84 (95%CI: 0.81–0.87). These results mean that the diagnostic ability of miniprobe endoscopic ultrasonography may not be high enough as expected. However, the present diagnostic ability was higher than radial EUS. Choi et al reported that the overall accuracy of endoscopy ultrasonography staging was 67.4% and the conventional endoscopy staging was 73.7%. The accuracy of miniprobe EUS was high than radial EUC (79.5% vs 59.6%). There was no significant difference between miniprobe EUS and conventional endoscopy.[24] Yoshida evaluated the diagnostic ability of high-frequency ultrasound probe sonography in staging submucosal invasion of early GC and found that the depth of early GC was accurately determined in 90% of cases.[25] But this study was limited in its diagnostic ability with respect to minimal submucosal invasion and the presence of ulcers. Another study with 142 patients with early GC evaluated the diagnostic accuracy of three miniature probes of different frequency in vertical margins. The results indicated that the accuracies of the early GC invasion depths of the m+sm1 group were 81.0%, 86.0%, and 92.3% as measured by the 12-, 20- and 30-MHz probes, respectively.[26] Thus, it can be seen that appropriate varying in frequency may change the diagnostic accuracy. The present study did not report the pooled results of varying frequency because the study usually did not conduct such a subgroup analysis. But we found that the diagnostic accuracy was significant different in different ethnicity. The diagnostic accuracy in Japan and Korea was significantly higher than that in the Chinese population. As you know, all machine of EUS was made in Japan, this may have potential bias, which need to be confirmed in the future study. We also found that publication year could affect the diagnostic accuracy. The latter study reported higher diagnostic ability than early-stage. We assumed that this is just statistically different. It may be associated with improving technic. Previous study also reported that the overall accuracy rates in invasion depth staging of early GC were 63% for endoscopy and 71% for endoscopic ultrasonography. No statistically significant differences were observed in overall accuracy. It may endoscopic ultrasonography was limited to the mucosa on histological examination.[27] This finding was different in Yoshida report. They found that the diagnostic was limited in minimal submucosal invasion. Considering the small sample size of Yanai study (n = 52), we supported the Yoshida results (n = 295).
One of the strengths is that almost of all studies used the same type of diagnostic machine, which gets rid out of the effects of examination machine. The other strength is that the present followed the PRISMA guidelines to conduct this meta-analysis. This make these findings more readable. Several study limitations should be addressed. First, although great efforts have been made to obtain relevant studies, some data unpublished online cannot be achieved. Second, the present study only consisted of the East Asian population without Caucasian and African population. Moreover, we found that ethnicity could affect diagnostic accuracy of miniprobe endoscopic, which should be cautious in other population setting. Third, the heterogeneity within studies was high. We only conduct subgroup analysis in population, sample size and publication year. There may be some unreported factors that affect the overall estimation. Finally, clinical practice usually depends on many examinations to confirm the diagnostic. Our results provide some important support for clinical diagnostic of invasion depth of early GC.
In conclusion, the present study indicated that the miniprobe endoscopic ultrasonography had moderate diagnostic value for prediction of invasion depth of early GC: The diagnostic utility was influenced ethnicity, indicating that it may play an important role with combination of biomarkers. Miniprobe endoscopic ultrasonography achieved highest diagnostic accuracy for invasion depth of GC in Japan and Korea. Further research is required to confirm the present findings and explore the potential factor of heterogeneity.
Author contributions
Conceptualization: Mingchi Luo.
Investigation: Lifeng Li.
Methodology: Lifeng Li.
Software: Lifeng Li.
Supervision: Mingchi Luo.
Writing – review & editing: Mingchi Luo.
Supplementary Material
Footnotes
Abbreviations: AUC = area under the curve, CI = confidence interval, FN = false negative, FP = false positive, GC = gastric cancer, NLR = negative likelihood ratio, PLR = positive likelihood ratio, PRISAMA = Preferred Reporting Items for Systematic Reviews and Meta-Analyses, TN = true negative, TP = true positive.
All authors wish to declare that they have no conflict of interests in this study or its publication, financial or otherwise.
Supplemental Digital Content is available for this article.
References
- [1].Van Cutsem E, Sagaert X, Topal B, et al. Gastric cancer. Lancet 2016;388:2654–64. [DOI] [PubMed] [Google Scholar]
- [2].Torre LA, Bray F, Siegel RL, et al. Global cancer statistics, 2012. CA Cancer J Clin 2015;65:87–108. [DOI] [PubMed] [Google Scholar]
- [3].Gambardella V, Cervantes A. Precision medicine in the adjuvant treatment of gastric cancer. Lancet Oncol 2018;19:583–4. [DOI] [PubMed] [Google Scholar]
- [4].Ministrini S, Solaini L, Cipollari C, et al. Surgical treatment of hepatic metastases from gastric cancer. Updates Surg 2018;70:273–8. [DOI] [PubMed] [Google Scholar]
- [5].Machlowska J, Maciejewski R, Sitarz R. The pattern of signatures in gastric cancer prognosis. Int J Mol Sci 2018;19. [DOI] [PMC free article] [PubMed] [Google Scholar]
- [6].Becker KF, Keller G, Hoefler H. The use of molecular biology in diagnosis and prognosis of gastric cancer. Surg Oncol 2000;9:5–11. [DOI] [PubMed] [Google Scholar]
- [7].Irino T, Sano T, Hiki N, et al. Diagnostic staging laparoscopy in gastric cancer: a prospective cohort at a cancer institute in Japan. Surg Endosc 2018;32:268–75. [DOI] [PubMed] [Google Scholar]
- [8].Koessler T, Roth A, Cacheux W. Early gastric cancer: epidemiology, diagnostic and management. Rev Med Suisse 2014;10:1118–22. [PubMed] [Google Scholar]
- [9].Whiting PF, Rutjes AW, Westwood ME, et al. QUADAS-2: a revised tool for the quality assessment of diagnostic accuracy studies. Ann Intern Med 2011;155:529–36. [DOI] [PubMed] [Google Scholar]
- [10].Chu H, Cole SR. Bivariate meta-analysis of sensitivity and specificity with sparse data: a generalized linear mixed model approach. J Clin Epidemiol 2006;59:1331–3. [DOI] [PubMed] [Google Scholar]
- [11].Dinnes J, Deeks J, Kirby J, et al. A methodological review of how heterogeneity has been examined in systematic reviews of diagnostic test accuracy. Health Technol Assess 2005;9:1–13. [DOI] [PubMed] [Google Scholar]
- [12].Higgins JP, Thompson SG, Deeks JJ, et al. Measuring inconsistency in meta-analyses. BMJ 2003;327:557–60. [DOI] [PMC free article] [PubMed] [Google Scholar]
- [13].Reitsma JB, Glas AS, Rutjes AW, et al. Bivariate analysis of sensitivity and specificity produces informative summary measures in diagnostic reviews. J Clin Epidemiol 2005;58:982–90. [DOI] [PubMed] [Google Scholar]
- [14].Deeks JJ, Macaskill P, Irwig L. The performance of tests of publication bias and other sample size effects in systematic reviews of diagnostic test accuracy was assessed. J Clin Epidemiol 2005;58:882–93. [DOI] [PubMed] [Google Scholar]
- [15].Swets JA. Measuring the accuracy of diagnostic systems. Science 1988;240:1285–93. [DOI] [PubMed] [Google Scholar]
- [16].Sitarz R, Skierucha M, Mielko J, et al. Gastric cancer: epidemiology, prevention, classification, and treatment. Cancer Manag Res 2018;10:239–48. [DOI] [PMC free article] [PubMed] [Google Scholar]
- [17].Ang TL, Fock KM. Clinical epidemiology of gastric cancer. Singapore Med J 2014;55:621–8. [DOI] [PMC free article] [PubMed] [Google Scholar]
- [18].Zhao X, Li X, Yuan H. microRNAs in gastric cancer invasion and metastasis. Front Biosci (Landmark Ed) 2013;18:803–10. [DOI] [PubMed] [Google Scholar]
- [19].Takao S, Shimazu H, Maenohara S, et al. Tumorigenicity, invasion, and metastasis of human gastric cancer in nude mice. J Cancer Res Clin Oncol 1991;117:533–8. [DOI] [PMC free article] [PubMed] [Google Scholar]
- [20].Isomoto H, Shikuwa S, Yamaguchi N, et al. Endoscopic submucosal dissection for early gastric cancer: a large-scale feasibility study. Gut 2009;58:331–6. [DOI] [PubMed] [Google Scholar]
- [21].Zhang JB, Shi QY. Diagnostic value of magnifying endoscopy combined with narrow-band imaging for early gastric cancer with various degree of differentiation. Acad J Chin PLA Med School 2017;38:37–40. [Google Scholar]
- [22].Yamada S, Doyama H, Yao K, et al. An efficient diagnostic strategy for small, depressed early gastric cancer with magnifying narrow-band imaging: a post-hoc analysis of a prospective randomized controlled trial. Gastrointest Endosc 2014;79:55–63. [DOI] [PubMed] [Google Scholar]
- [23].Nagahama T, Yao K, Maki S, et al. Usefulness of magnifying endoscopy with narrow-band imaging for determining the horizontal extent of early gastric cancer when there is an unclear margin by chromoendoscopy (with video). Gastrointest Endosc 2011;74:1259–67. [DOI] [PubMed] [Google Scholar]
- [24].Choi J, Kim SG, Im JP, et al. Comparison of endoscopic ultrasonography and conventional endoscopy for prediction of depth of tumor invasion in early gastric cancer. Endoscopy 2010;42:705–13. [DOI] [PubMed] [Google Scholar]
- [25].Yoshida S, Tanaka S, Kunihiro K, et al. Diagnostic ability of high-frequency ultrasound probe sonography in staging early gastric cancer, especially for submucosal invasion. Abdom Imaging 2005;30:518–23. [DOI] [PubMed] [Google Scholar]
- [26].Ichikawa T, Kudo M, Matsui S, et al. Endoscopic ultrasonography with three miniature probes of different frequency is an accurate diagnostic tool for endoscopic submucosal dissection. Hepatogastroenterology 2007;54:325–8. [PubMed] [Google Scholar]
- [27].Yanai H, Noguchi T, Mizumachi S, et al. A blind comparison of the effectiveness of endoscopic ultrasonography and endoscopy in staging early gastric cancer. Gut 1999;44:361–5. [DOI] [PMC free article] [PubMed] [Google Scholar]
Associated Data
This section collects any data citations, data availability statements, or supplementary materials included in this article.