Abstract
This study aimed to identify modules associated with breast cancer (BC) development by constructing a gene co-expression network, and mining hub genes that may serve as markers of invasive breast cancer (IBC).
We downloaded 2 gene expression datasets from the Gene Expression Omnibus (GEO) database, and used weighted gene co-expression network analysis (WGCNA) to dynamically study the changes of co-expression genes in normal breast tissues, ductal carcinoma in situ (DCIS) tissues, and IBC tissues. Modules that highly correlated with BC development were carried out functional enrichment analysis for annotation, visualization, and integration discovery. The hub genes detected by WGCNA were also confirmed using the Oncomine dataset.
We detected 17 transcriptional modules in total and 4 — namely tan, greenyellow, turquoise, and brown — were highly correlated with BC development. The functions of these 4 modules mainly concerned cell migration (tan module, P = 3.03 × 10⁻⁴), the cell cycle (greenyellow module, P = 3.08 × 10⁻¹³), cell–cell adhesion (turquoise module, P = .002), and the extracellular exosome (brown module, P = 1.38 × 10⁻²²). WGCNA also mined the hub genes, which were highly correlated with the genes in the same module and with BC development. The Oncomine database confirmed that the expressions levels of 6 hub genes were significantly higher in BC tissues than in normal tissues, with fold changes larger than 2 (all P < .05). Apart from the 2 well-known genes EPCAM and MELK, during the development of BC, KRT8, KRT19, KPNA2, and ECT2 also play key roles, and may be used as new targets for the detection or treatment of BC.
In summary, our study demonstrated that hub genes such as EPCAM and MELK are highly correlated with breast cancer development. However, KRT8, KRT19, KPNA2, and ECT2 may also have potential as diagnostic and prognostic biomarkers of IBC.
Keywords: annotation, breast cancer development, gene expression profiling, gene ontology, KEGG, Oncomine, WGCNA
1. Introduction
Breast cancer (BC) is the most common cancer in females worldwide,[1,2] and is the leading cause of mortality in women.[3] It is therefore a huge burden for both patients and society. BC is a multifactorial disease caused by complex inherited and environmental factors.[4] One of the most common causes is genetic mutation. Numerous genetic alterations influence human breast carcinogenesis by affecting cell growth, proliferation, differentiation, apoptosis, and invasion.[5] However, although BC has been extensively researched in recent years, and numerous biomarkers have proved to be effectual for the diagnosis and management of BC, it remains one of the leading causes of cancer death.[3] Therefore, the mechanism underlying the development of BC is intricate, and further research is required to discover the genes involved in BC pathogenesis to develop novel therapeutic targets for treating the disease. Though Santpere et al described genes that change in DCIS and basal-like tumors with respect to normal breast,[6] the dynamic change of co-expression network from normal breast tissue to ductal carcinoma in situ (DCIS), and subsequently to all subtypes of invasive breast cancer (IBC), are still unclear.
Recent developments in oligonucleotide microarray and sequencing technologies have enabled the rapid monitoring of gene expression in various tissues, and have provided an excellent tool and platform for cancer research.[7,8] Owing to the accurate determination of tumor phenotypes, expression-based classification offers insight into the molecular aspects of tumor progression, recurrence, and differentiation.[9,10] facilitating the discovery of new biomarkers. Traditional differentially expressed genes (DEGs) network analysis can be used to identify differentially expressed genes in cancer patients compared to normal people. However, such analysis conventionally treats thousands of genes independently, and ignores the high interconnection of the transcriptome. Moreover, it encompasses different expression profiles of thousands of genes driven by a wide range of factors, so it is difficult to determine which genes play a key role in the development of BC.
Scale-free networks differ significantly from random networks. The most notable characteristic of a scale-free network is the relative commonness of vertices with a degree that greatly exceeds the average. The highest-degree nodes are often called "hubs”, and are thought to serve specific purposes in their networks. WGCNA is based solely on a scale-free network that is used to determine the relationships between genes, thereby enabling the identification of modules (clusters) of highly correlated genes,[11] and the hub gene in each module. Thus, WGCNA is ideal for the identification of gene modules and key genes that contribute to phenotypic traits. For example, Colin et al identified 11 gene co-expression clusters from large-scale BC data using WGCNA, and suggested that UBE2S indicates a poor prognosis for BC.[12] Therefore, in the current study, we aimed to use the WGCNA algorithm to identify highly correlated gene modules that are associated with BC development, then detected the hub genes (network-centric genes), to uncover new biomarkers proved to be effectual for the diagnosis and treatment of breast cancer.
2. Materials and methods
Statistical computations were performed using R statistical software (version 3.5) with related packages or our customized functions.
2.1. Microarray data
The microarray gene expression profiles were downloaded from the GEO (www.ncbi.nlm.nih.gov/geo) database with accession numbers GSE15852 and GSE92697. A total of 112 samples were included in the dataset (42 IBC, 27 DCIS, and 43 normal breast samples). The 2 series have good consistency after adjusting the batch effects. Microarray annotation information (HG-U133A Annotations) was used to match a total of 22,283 microarray probes with the corresponding genes. Probes with more than one gene were eliminated, and the average values were calculated for those genes corresponding to more than one probe. Therefore, 12,709 unique genes representing the expression profiles were used for analysis. The data of this study are derived from gene databases, so ethical approval is not applicable.
2.2. Co-expression module detection
We initially used the flashClust tool in the R language to carry out cluster analysis of the samples with the appropriate threshold value to detect and remove the outliers. The gradient method was used to test the independence and the average degree of connectivity of the various modules with different power values (the power values ranged from 1 to 20). Once the appropriate power value had been determined when the degree of independence was 0.8, the module construction proceeded with the WGCNA algorithm. Modules were identified as gene sets with high topological overlap.[13] The minimum number of genes was set at 30 to ensure high reliability. Subsequently, the information pertaining to the corresponding genes in each module was extracted.
2.3. Module and clinical trait association analysis
The WGCNA algorithm utilizes module eigengenes (MEs) to assess the potential correlation of gene modules with clinical traits. In the present study, the MEs were defined as the first principal components calculated using principal component analysis, which summarizes the expression patterns of the module genes into a single characteristic expression profile. The expression patterns of modules associated with the kinds of samples were then calculated using gene significance (GS) and module significance (MS). The GS of a gene was defined as the correlation coefficients for different kinds of samples, whereas MS was indexed as the average GS for all the genes in the module.
2.4. Functional annotation of module
Functional annotation of the modules was performed on the basis of analysis of their gene composition. Gene ontology (GO) terms and Kyoto Encyclopedia of Genes and Genomes (KEGG) pathways were performed to explore the biological functions of selected genes in the modules that had high correlation with BC development using the DAVID bioinformatics tool (version 6.7, https://david.nciferf.gov/). A P value ≤ .05 after correction was used as the threshold. The top 4 records of the 3 GO sub-vocabularies ("cellular component”, CC; "biological process”, BP; "molecular function”, MF) and KEGG pathways were extracted.
2.5. Association analysis and hub genes
The kME — which is the distance from the expression profile of a gene to that of the module eigengene — was determined as the Pearson correlation coefficient between each individual gene and the ME. Thus, kME quantifies how close a gene is to a module, that is, it measures the module membership of a gene. The hub genes are those genes with high network connectivity in a particular group. Furthermore, the hub genes of modules are also highly associated with the corresponding clinical traits of the modules. Thus, genes with the highest kME and highest GS in the module were informally referred to as intramodular hub genes.
2.6. Validation the hub genes by Oncomine database
Oncomine (https://www.oncomine.org/resource/login.html) is a cancer microarray database that allows researchers to mine web-based data on genome-wide expression in various types of human cancers and the corresponding normal tissues.[14,15] The database is constantly updated to provide users with the most advanced data and tools available. Therefore, we used Oncomine because it is powerful tool that provides a better understanding of the molecular mechanisms underlying BC development, and the validation of new targets and biomarkers.
3. Results
3.1. Identification of gene co-expression modules
The dataset and samples were described in the methods. WGCNA is memory consumption. Therefore, a weighted gene co-expression network was constructed from the 4236 most varied genes (the top 1/3 of the 12,709 genes) which included almost all the differentially expressed genes among groups. The flashClust tools package was used to perform the cluster analysis, and 4 outlier samples were subsequently detected and removed (Fig. 1A). The most critical parameter in WGCNA analysis is the power value, which mainly affects the independence and the average degree of connectivity of the co-expression modules. Figure 1B shows that when the power value was equal to 5, our data predicted a gene co-expression network that exhibited scale-free topology with inherent modular features.
Figure 1.
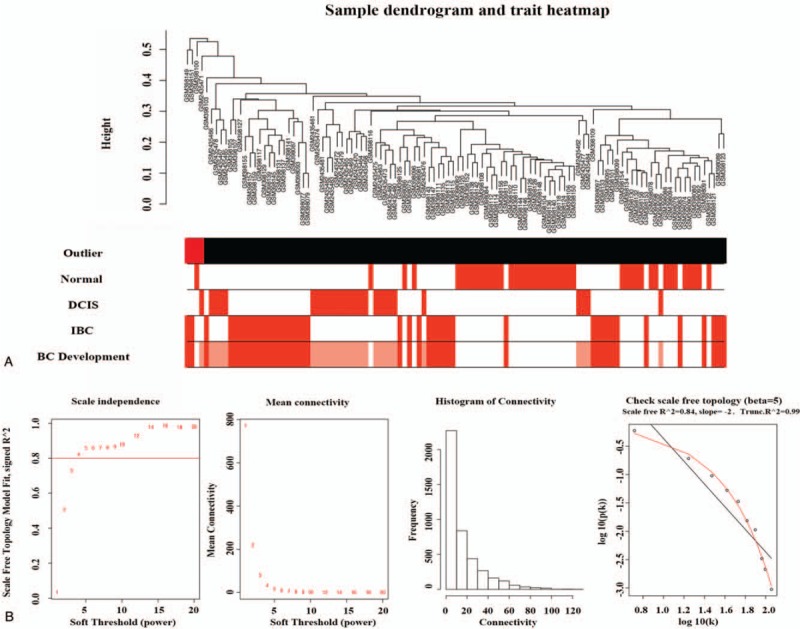
(A) Cluster tree of normal, DCIS and IBC samples. The first color-band underneath the tree indicates which arrays appear to be outlying (colored red). The other color bands color-code the sample traits. The BC development in Figure 1 means the dynamic changes of gene expression from normal to DCIS and then to IBC. (B) Analysis of network topology for various soft-thresholding powers. BC = breast cancer, DCIS = ductal carcinoma in situ, IBC = invasive breast cancer.
We then calculated the topological overlap measure (TOM) for each gene pair. Hierarchical clustering based on TOM dissimilarity measure (1-TOM) stability revealed 17 modules (Fig. 2A). Each module contained a group of coordinately expressed genes with high TOM, and was potentially involved in shared biological processes. To distinguish the modules individually, each module was assigned a unique color, and the corresponding numbers of genes in these modules are shown in Figure 2B. The background color is grey and represents the 463 genes not assigned to any module. The entire gene expression network is representation in the heatmap plot shown in Figure 3A and the multi-dimensional scaling plot shown in Figure 3B.
Figure 2.
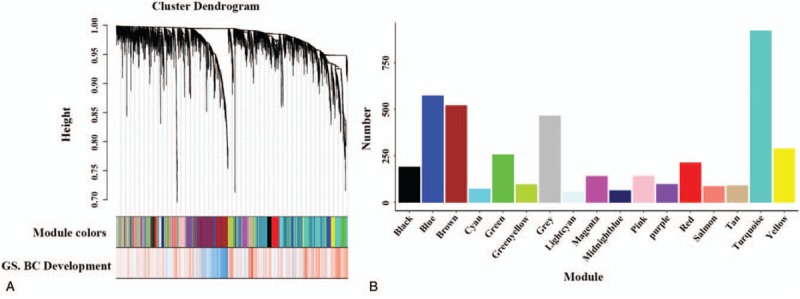
(A) Hierarchical cluster tree of the 4236 genes. The first band shows the assigned module colors and the second color band represents the gene significance measure: “red” indicates a high positive correlation with BC development. (B) The number of genes in the 17 modules. BC = breast cancer.
Figure 3.
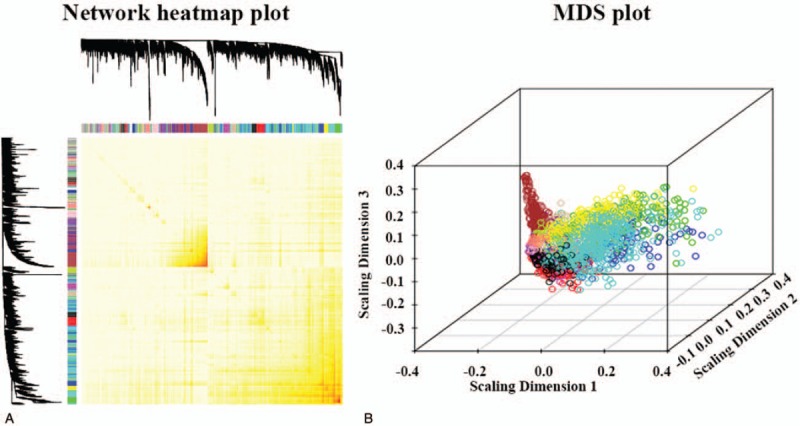
(A) Heatmap plot representing the gene network. The heatmap depicts the topological overlap matrix among all genes in the analysis. (B) Multi-dimensional scaling (MDS) plots representing the entire gene expression network. Each gene is represented by a dot, where the color of the dot corresponds to the gene module to which that gene belongs.
3.2. Association of modules with clinical traits
Interaction analysis of co-expression modules associated with tumor characteristics identified correlation between module eigengenes (MEs) and tumor characteristics (Fig. 4A). The eigengene of the tan module (88 genes) had significant correlation with BC development (cor = .71, P = 8 × 10⁻¹⁸), whereas the eigengene of the brown module (519 genes) had the highest negative correlation (cor = −.6, P = 4 × 10⁻¹¹). Furthermore, the eigengenes of greenyellow (94 genes) and turquoise (920 genes) modules were also highly correlated with BC development (cor = .47, P = 4 × 10⁻⁷ and cor = .44, P = 2 × 10⁻⁶, respectively). Figure 4B shows a hierarchical clustering dendrogram of the eigengenes (the top panel) as well as eigengene adjacency network (the bottom panel), which also confirmed that the eigengene of the tan module is the highest one that correlated with BC development. The dynamic changes of MS from normal tissue to DCIS, and then to IBC, were shown in Figure 5. Tan module shows the highest MS in IBC patients and the lowest in normal patient. However, the brown module exhibited exactly opposite results.
Figure 4.
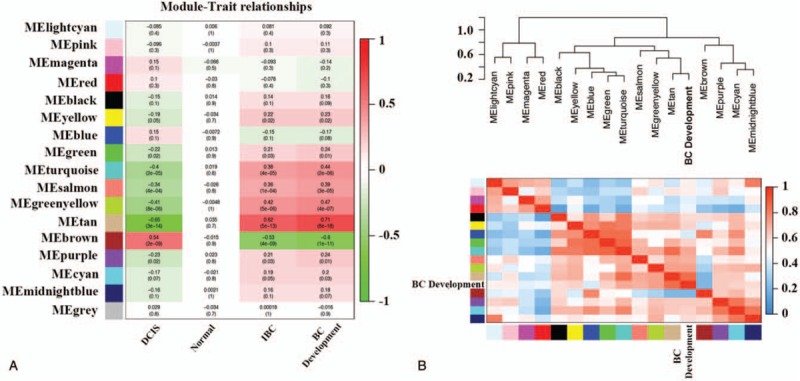
(A) Pearson correlation coefficient matrix among module eigengenes (MEs), and breast cancer characteristics. Each cell reports the correlation (and P-value) between module eigengenes (rows) and traits (columns). (B) Eigengene network representing the relationships among the modules and the sample traits. BC = breast cancer, MEs = module eigengenes.
Figure 5.
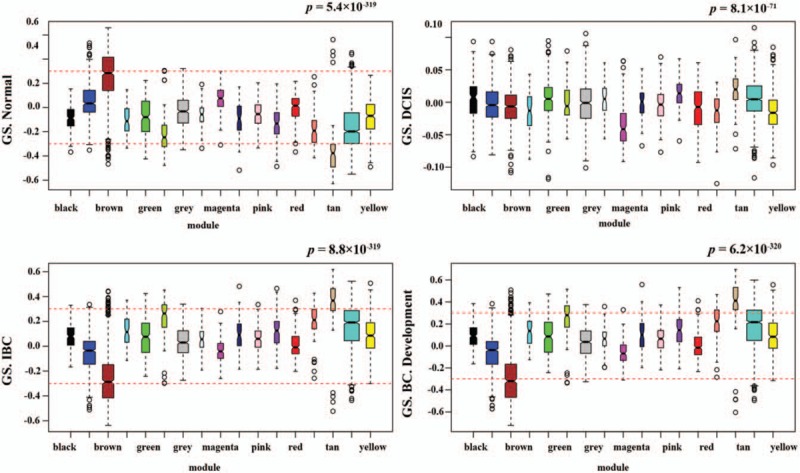
GS Score for all modules corresponding to normal, DCIS, IBC samples and BC development. BC = breast cancer, DCIS = ductal carcinoma in situ, GS = gene significance, IBC = invasive breast cancer.
3.3. Functional enrichment analysis of genes in modules of interest
Because the tan, greenyellow, turquoise, and brown modules were all highly correlated with BC development, we conducted GO and KEGG enrichment analysis to obtain further biological insight into each module. For the tan module, which had strong positive correlation with BC development, the genes were mainly enriched in GO: 0016477 (cell migration). For the brown module, which had strong negative correlation with BC development, the genes were mainly enriched in GO: 0007155 (cell adhesion). Categories related to GO: 0070062 (the cell cycle) and GO: 0070062 (cell–cell adhesion) were significantly over-represented in the remaining 2 modules, namely the greenyellow and turquoise co-expression modules, respectively. The complete information relating to the significant biological GO terms and KEGG pathways for these 4 modules is shown in Figure 6.
Figure 6.
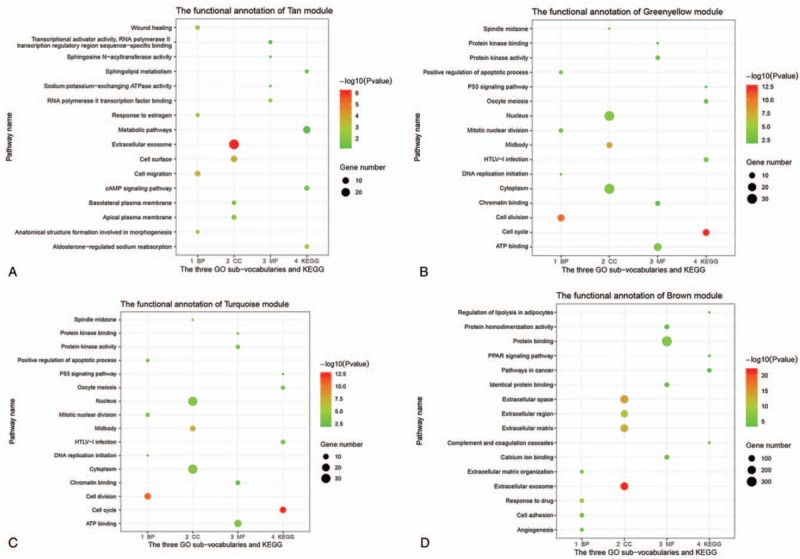
GO analysis and KEGG pathway enrichment analysis for genes in tan (A), brown (B), turquoise (C), and greenyellow (D) modules. GO = gene ontology, KEGG = Kyoto Encyclopedia of Genes and Genomes.
3.4. Module visualization and hub genes
First, we created a scatterplot of GS of BC development versus Module Membership in the 17 modules (Fig. 7). We found that the tan, greenyellow, turquoise, and brown modules all contained genes with the highest GS for BC development and highest intramodular connectivity, which suggests that the intramodular hub genes of these modules were highly correlated with BC development.
Figure 7.
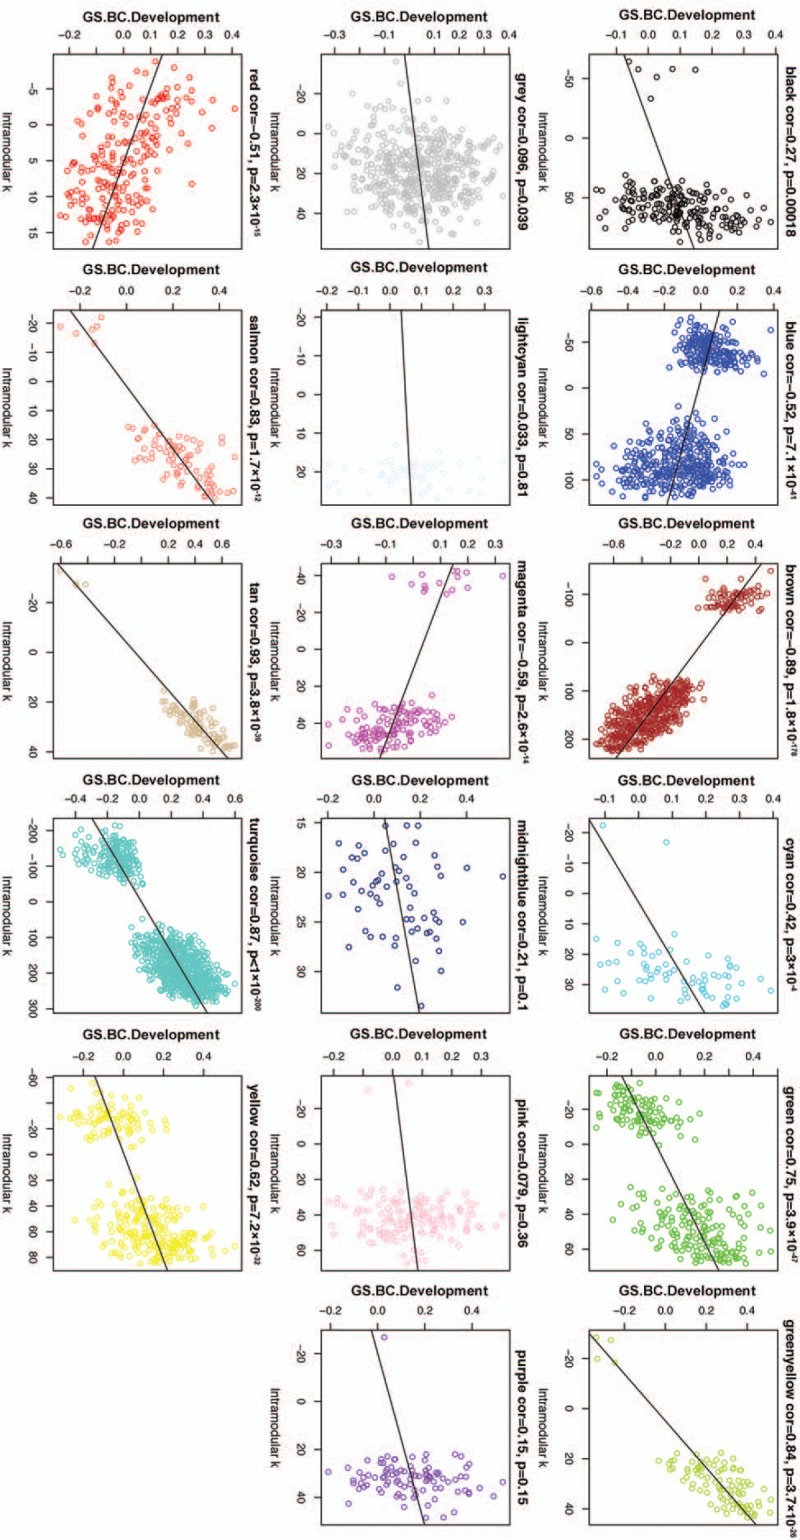
Scatterplot of Gene Significance of BC development versus intramodular k (Module Membership) in the 17 modules. BC = Breast cancer, GS = gene significance.
Then we used Cytoscape software to visualize the network of targeted modules and the intra-modular connectivity, which was calculated by WGCNA (Fig. 8). The hub genes in the tan module included SLC38A1, the KRT family (KRT8, KRT18, and KRT19), EPCAM, HMGN1, etc. With regard to the remaining 3 modules, the most significant hub genes were BUB1B, MORF4L2, and TNS1 in the greenyellow, turquoise, and brown modules, respectively.
Figure 8.
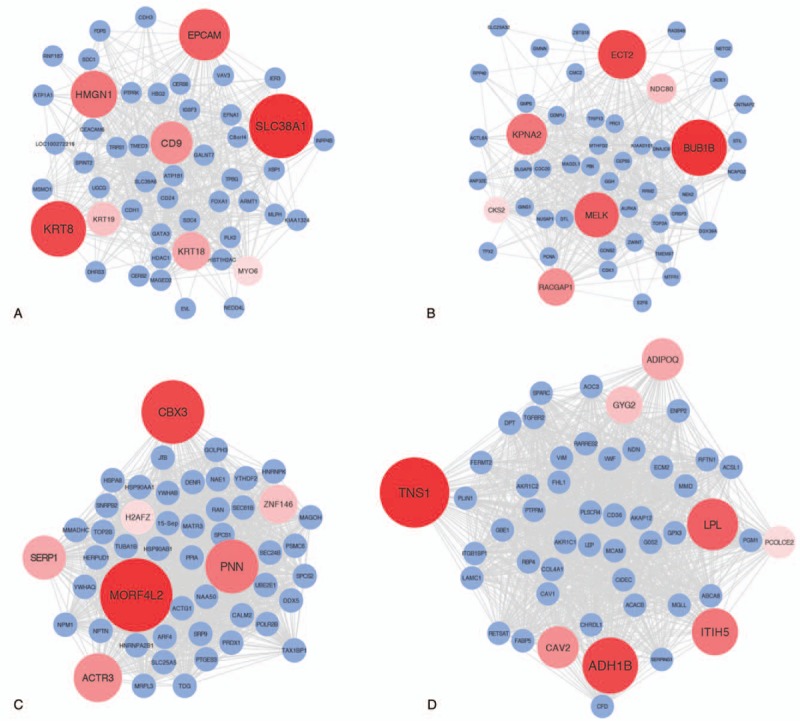
Visualization of weighted gene co-expression network analysis (WGCNA) network connections of the intramodular hub genes and the top 50 genes in tan (A), green-yellow (B), turquoise (C) and brown (D) module.
3.5. Expression of hub genes in breast cancer and normal tissues
We evaluated the transcription levels of the hub genes in our 4 targeted modules in BC and normal tissues using the Oncomine database. The Curtis breast dataset revealed that the EPCAM, KRT8, KRT19, KPNA2, MELK, and ECT2 expression levels were significantly higher in BC than in normal tissues, with fold changes larger than 2. SLC38A1, HMGN1, CD9, CBX3, ACTR3, and MORF4L2 expression levels were moderately higher in BC than in normal tissues, with fold changes between 1.4 and 2.0. There were no differences in the expression levels of BUB1B, KRT18, or MYO6 between BC tissue and normal tissue. However, the expression levels of TNS1, ADH1B, PNN, ITIH5, and LPL were markedly lower in the BC tissue than in the normal tissue (Fig. 9).
Figure 9.
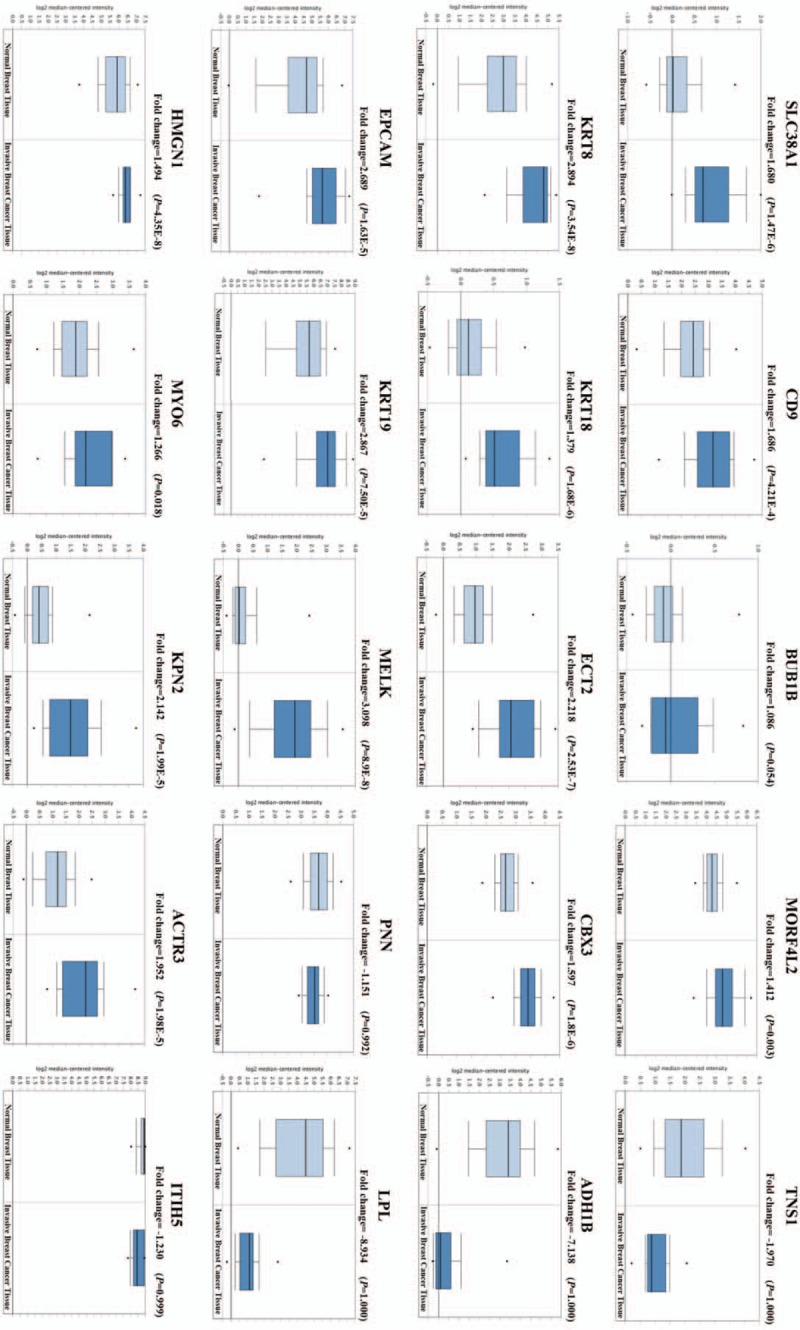
Hub genes expression levels in breast cancer and normal tissues using the Curtis breast dataset. The P values were calculated using a log-rank test, and P < .05 was regarded as statistically significant.
4. Discussion
To the best of our knowledge, this is the first report on the use of WGCNA analysis to dynamically study co-expression genes in normal breast tissues, DCIS tissues, and IBC tissues, and to explore related modules and hub genes. We conclude that the tan module, which focused on the cell migration pathway, had the highest correlation with BC development. The functions of the other 3 modules, which were also correlated with BC development, focused on the cell cycle, cell division, and cell adhesion. Several hub genes derived from these modules that are associated with BC were uncovered; some have been reported to exhibit high tumorigenicity. However, some newly discovered genes may become potential makers for the diagnosis and treatment of BC. Our long-term goals are to provide insight into the mechanisms underlying BC development, and to help identify patients who are likely to develop BC, and who would benefit from alternative clinical diagnosis and therapy.
Cloning and migration are the 2 basic characteristics of cancer cells. The function of the tan module, which was identified as the most significant module associated with BC development, concerned the cell migration pathway and the formation of the anatomical structures involved in morphogenesis. Therefore, this upregulation of the co-expressed genes plays a central role in increasing the migration of epithelial cells and promoting structure formation in BC.
Among the hub genes in the tan module, EPCAM is considered the most frequently and intensely studied tumor-associated antigen gene because it is overexpressed in most epithelium-derived tumors, including colorectal,[16] breast,[17] pancreatic,[18] and liver.[19] Furthermore, EPCAM is also regarded as a prognostic tumor biomarker for cancer diagnosis, prognosis, and therapy.[20] However, the mechanism by which EPCAM is associated with cancer formation has remained elusive. Other important hub genes in this module were mainly located in the keratins (KRTs) family, demonstrating that KRTs play a critical role in the development of BC. KRT8, a type II basic intermediate filament protein, is expressed in many simple epithelial cells.[21]KRT8 is also positively expressed in head-and-neck squamous cell carcinomas and metastases.[22] As for the association between KRT8 and BC, only one study reported that KRT8 combined with urokinase-type plasminogen activator, plasminogen, and fibronectin constitutes a signaling platform that can modulate breast tumor cell adhesion and invasiveness.[23]KRT19 expression is also proved to be associated with poor tumor differentiation and aggressive tumor behavior in hepatocellular carcinoma.[24] However, it can be seen that there are few reports on the functions of the KRT family associated with BC formation in the literature. Therefore, the 2 most important hub genes (KRT8 and KRT19) in this module are potential new markers for the diagnosis and treatment of BC.
Gene functions in the greenyellow module concerned cell division, and the cell cycle pathway. Cancer basically results from uncontrolled cell division. The formation and progression of cancer is usually linked to a series of changes in the activity of cell cycle regulators. The hub genes in this module included KPNA2, MELK, and ECT2. A large number of reports have now confirmed that MELK can regulate cell proliferation and apoptosis, and promote cancer cell metastasis.[25] However, there has been little research on KPNA2. A few studies have shown that the expression of KPNA2 is associated with aggressive behaviors such as higher tumor grade and positive lymph node,[26,27] and with poor outcomes in BC.[28]ECT2, which is considered a major oncogene involved in the onset or progression of human cancers, induces the malignant transformation of both epithelial cells and fibroblasts, indicating its vital role in the malignant transformation of cells.[29] Therefore, ECT2 is likely to play a key role in the interaction between BC epithelial cell and the tumor microenvironment.
The function of the genes in the turquoise module concerned poly(A) RNA binding, protein processing in the endoplasmic reticulum, RNA transport, and metabolic pathways, which implies that the genes in this module inhibit transcription and regulate the metabolism of tumor cells. The functions of the genes in the brown module concerned the regulation of the PI3K-Akt signaling pathway, the transcription of RNA polymerase II promoter, and signal transduction. The PI3K-Akt signaling pathway plays an essential role in several cell processes including cell proliferation, growth, survival, angiogenesis, and malignancies.[30]TNS1, ADH1B, and LPL, which are markers of unfavorable prognoses in many cancers, were markedly downregulated in BC, but the underlying mechanisms require further investigation.
Though the majority of hub genes highlighted in this study have been reported, all the studies just discussed the correlation between the expression of a single gene, such as KRT8, KRT19, KPNA2, and ECT2 et al and the prognosis of breast cancer. However, in our study, we focus on the genes that play critical roles in the occurrence and development of breast cancer. Besides, WGCNA analysis was used to detect the correlation of these hub genes, which will help us understand the interaction of these genes as well as the mechanism that associated with breast cancer development.
5. Conclusion
In summary, our study used a systems biology-based WGCNA approach to demonstrate that 4 modules were correlated with IBC development. The functions of these modules were concentrated in migration, cell division, cell proliferation, and cell adhesion. Hub genes such as EPCAM and MELK are highly correlated with breast cancer development. However, KRT8, KRT19, KPNA2, and ECT2 may also have potential as diagnostic and prognostic biomarkers of IBC. Our results require further verification.
Author contributions
Conceptualization: Qing Lv.
Data curation: Yuanxin Zhang, Yanyan Xie.
Formal analysis: Zhenggui Du, Yao Wang.
Investigation: Yao Wang, Yuanxin Zhang.
Methodology: Yao Wang, Yuting Zhou, Yanyan Xie.
Resources: Yuting Zhou.
Software: Zhenggui Du, Yuting Zhou.
Validation: Yanyan Xie.
Writing – original draft: juanjuan Qiu.
Writing – review & editing: Zhenggui Du, Qing Lv.
Footnotes
Abbreviations: BC = breast cancer, BP = biological process, CC = cellular component, DCIS = ductal carcinoma in situ, DEGs = differentially expressed genes, GEO = gene expression omnibus, GO = gene ontology, GS = gene significance, IBC = invasive breast cancer, KEGG = Kyoto Encyclopedia of Genes and Genomes, MEs = module eigengenes, MF = molecular function, MS = module significance, TOM = topological overlap measure, MDS = multi-dimensional scaling, WGCNA = weighted gene co-expression network analysis.
JQ and ZD are contributed equally to the study.
The authors have no conflicts of interest to disclose.
References
- [1].Siegel RL, Miller KD, Jemal A. Cancer statistics, 2016. CA Cancer J Clin 2016;66:7–30. [DOI] [PubMed] [Google Scholar]
- [2].Fan L, Strasser-Weippl K, Li JJ, et al. Breast cancer in China. Lancet Oncol 2014;15:e279–289. [DOI] [PubMed] [Google Scholar]
- [3].Torre LA, Bray F, Siegel RL, et al. Global cancer statistics, 2012. CA Cancer J Clin 2015;65:87–108. [DOI] [PubMed] [Google Scholar]
- [4].Lichtenstein P, Holm NV, Verkasalo PK, et al. Environmental and heritable factors in the causation of cancer--analyses of cohorts of twins from Sweden, Denmark, and Finland. N Engl J Med 2000;343:78–85. [DOI] [PubMed] [Google Scholar]
- [5].Humana Press, Charpentier A, Aldaz CM. The Molecular Basis of Breast Carcinogenesis. 2002;347–363. [Google Scholar]
- [6].Santpere G, Alcaraz-Sanabria A, Corrales-Sanchez V, et al. Transcriptome evolution from breast epithelial cells to basal-like tumors. Oncotarget 2018;9:453–63. [DOI] [PMC free article] [PubMed] [Google Scholar]
- [7].Zhou XG, Huang XL, Liang SY, et al. Identifying miRNA and gene modules of colon cancer associated with pathological stage by weighted gene co-expression network analysis. Onco Targets Ther 2018;11:2815–30. [DOI] [PMC free article] [PubMed] [Google Scholar]
- [8].Xu Y, Zhu Y, Muller P, et al. Characterizing cancer-specific networks by integrating TCGA data. Cancer Inform 2014;13Suppl 2:125–31. [DOI] [PMC free article] [PubMed] [Google Scholar]
- [9].Tominaga K, Olgun A, Smith JR, et al. Genetics of cellular senescence. Mech Ageing Dev 2002;123:927–36. [DOI] [PubMed] [Google Scholar]
- [10].Smith JR, Pereira-Smith OM. Replicative senescence: implications for in vivo aging and tumor suppression. Science 1996;273:63–7. [DOI] [PubMed] [Google Scholar]
- [11].Langfelder P, Horvath S. WGCNA: an R package for weighted correlation network analysis. BMC Bioinformatics 2008;9:559. [DOI] [PMC free article] [PubMed] [Google Scholar]
- [12].Clarke C, Madden SF, Doolan P, et al. Correlating transcriptional networks to breast cancer survival: a large-scale coexpression analysis. Carcinogenesis 2013;34:2300–8. [DOI] [PubMed] [Google Scholar]
- [13].Zhang B, Horvath S. Ridge regression based hybrid genetic algorithms for multi-locus quantitative trait mapping. Int J Bioinform Res Appl 2005;1:261–72. [DOI] [PubMed] [Google Scholar]
- [14].Rhodes DR, Kalyana-Sundaram S, Mahavisno V, et al. Oncomine 3.0: genes, pathways, and networks in a collection of 18,000 cancer gene expression profiles. Neoplasia 2007;9:166–80. [DOI] [PMC free article] [PubMed] [Google Scholar]
- [15].Rhodes DR, Kalyana-Sundaram S, Tomlins SA, et al. Molecular concepts analysis links tumors, pathways, mechanisms, and drugs. Neoplasia 2007;9:443–54. [DOI] [PMC free article] [PubMed] [Google Scholar]
- [16].Herlyn M, Steplewski Z, Herlyn D, et al. Colorectal carcinoma-specific antigen: detection by means of monoclonal antibodies. Proc Natl Acad Sci USA 1979;76:1438–42. [DOI] [PMC free article] [PubMed] [Google Scholar]
- [17].Edwards DP, Grzyb KT, Dressler LG, et al. Monoclonal antibody identification and characterization of a Mr 43,000 membrane glycoprotein associated with human breast cancer. Cancer Res 1986;46:1306–17. [PubMed] [Google Scholar]
- [18].Szala S, Froehlich M, Scollon M, et al. Molecular cloning of cDNA for the carcinoma-associated antigen GA733-2. Proc Natl Acad Sci USA 1990;87:3542–6. [DOI] [PMC free article] [PubMed] [Google Scholar]
- [19].Ruck P, Wichert G, Handgretinger R, et al. Ep-CAM in malignant liver tumours. J Pathol 2000;191:102–3. [DOI] [PubMed] [Google Scholar]
- [20].Fong D, Steurer M, Obrist P, et al. Ep-CAM expression in pancreatic and ampullary carcinomas: frequency and prognostic relevance. J Clin Pathol 2008;61:31–5. [DOI] [PubMed] [Google Scholar]
- [21].Karantza V. Keratins in health and cancer: more than mere epithelial cell markers. Oncogene 2011;30:127–38. [DOI] [PMC free article] [PubMed] [Google Scholar]
- [22].Matthias C, Mack B, Berghaus A, et al. Keratin 8 expression in head and neck epithelia. BMC Cancer 2008;8:267. [DOI] [PMC free article] [PubMed] [Google Scholar]
- [23].Obermajer N, Doljak B, Kos J. Cytokeratin 8 ectoplasmic domain binds urokinase-type plasminogen activator to breast tumor cells and modulates their adhesion, growth and invasiveness. Mol Cancer 2009;8:88. [DOI] [PMC free article] [PubMed] [Google Scholar]
- [24].van Sprundel RG, van den Ingh TS, Desmet VJ, et al. Keratin 19 marks poor differentiation and a more aggressive behaviour in canine and human hepatocellular tumours. Comp Hepatol 2010;9:4. [DOI] [PMC free article] [PubMed] [Google Scholar]
- [25].Du T, Qu Y, Li J, et al. Maternal embryonic leucine zipper kinase enhances gastric cancer progression via the FAK/Paxillin pathway. Mol Cancer 2014;13:100. [DOI] [PMC free article] [PubMed] [Google Scholar]
- [26].Dankof A, Fritzsche FR, Dahl E, et al. KPNA2 protein expression in invasive breast carcinoma and matched preinvasive lesions. Pathol - Res Pract 2007;203:304–1304. [DOI] [PubMed] [Google Scholar]
- [27].Gluz O, Wild PR, Diallo-Danebrock R, et al. Nuclear karyopherin alpha2 expression predicts poor survival in patients with advanced breast cancer irrespective of treatment intensity. Int J Cancer 2008;123:1433–8. [DOI] [PubMed] [Google Scholar]
- [28].Dahl E, Kristiansen G, Gottlob K, et al. Molecular profiling of laser-microdissected matched tumor and normal breast tissue identifies karyopherin alpha2 as a potential novel prognostic marker in breast cancer. Clin Cancer Res 2006;12:3950–60. [DOI] [PubMed] [Google Scholar]
- [29].Jin Y, Yu Y, Shao Q, et al. Up-regulation of ECT2 is associated with poor prognosis in gastric cancer patients. Int J Clin Exp Pathol 2014;7:8724–31. [PMC free article] [PubMed] [Google Scholar]
- [30].Manning BD, Cantley LC. AKT/PKB signaling: navigating downstream. Cell 2007;129:1261–74. [DOI] [PMC free article] [PubMed] [Google Scholar]


