Abstract
Many molecular epidemiology studies have reported an association between the combined effects of glutathione S-transferase M1 (GSTM1) and glutathione S-transferase T1 (GSTT1) polymorphisms on breast cancer risk. However, the results have been controversial.
A meta-analysis was performed to clarify this issue.
Meta-analysis of observational studies in epidemiology guidelines was used. Pooled the crude odds ratios (ORs) and 95% confidence intervals (CIs) were calculated using a random-effects model or fixed-effects model. Several subgroup analyses were conducted by ethnicity, source of control, matching, and menopausal status. In addition, we also performed sensitivity analysis and publication bias. Moreover, a false-positive report probability (FPRP) test was applied to assess positive results.
A significantly increased breast cancer risk was observed in overall population (GSTM1 null/GSTT1 present [− +] vs GSTM1 present/GSTT1 present [+ +]: OR = 1.19, 95% CI: 1.03–1.36, GSTM1 null/GSTT1 null [− −] vs + +: OR = 1.63, 95% CI: 1.29–2.06, (− +) + GSTM1 present/GSTT1 null (+ −) vs + +: OR = 1.17, 95% CI: 1.05–1.31, (− +) + (+ −) + (− −) vs + +: OR = 1.27, 95% CI: 1.12–1.44, and − − vs (− +) + (+ −) + (+ +): OR = 1.39, 95% CI: 1.17–1.66) and several subgroup analyses, such as Caucasians, Indians, postmenopausal women, and so on. However, positive results were only considered noteworthy in overall population (− − vs + +: FPRP = 0.150 and (− +) + (+ −) + (− −) vs + +: FPRP = 0.162). Moreover, no significant association was observed when we used the trim and fill method to adjust the pooled data from all populations. Further, none of positive results of sensitivity analysis were considered noteworthy (FPRP >0.2).
These positive findings should be interpreted with caution and indicate that an increased breast cancer risk may most likely result from false-positive results, rather than from true associations or biological factors on the combined effects of GSTM1 and GSTT1. Future studies should be based on sample sizes well-powered and attention needs to be paid to study design to further identify this issue.
Keywords: breast cancer, FPRP, GSTM1, GSTT1, meta-analysis, polymorphism
1. Introduction
Breast cancer is the most common malignant tumor and cause of cancer-related death among women, representing a major health problem worldwide.[1] In Portugal, it has the highest incidence and mortality rates among female diseases,[2] and is the second most common malignant tumor in Indian women[3] and the third most common malignant tumor in Korean women.[4] Some studies have indicated that alcohol consumption, tobacco, and particular food habits, especially high fat intake, are important risk factors for breast cancer.[5,6] In addition, previous studies indicated that cancer is related to the combined influences of genetic factors, environmental factors, and lifestyle. Hence, genetic polymorphism studies have become important in identifying the combined factors that may affect individual breast cancer susceptibility.[7,8]
Glutathione S-transferases (GSTs) are a family of multifunctional enzymes involved in the metabolism of a variety of xenobiotic compounds, including mammary carcinogens such as polycyclic aromatic hydrocarbons (PAHs).[9–11] GSTS have the capacity to detoxify the reactive product of metabolisms of PAHs, thereby preventing their interaction with DNA. According to their primary structure, the GST family is divided into 7 categories of genes in human.[12] In this meta-analysis, we studied glutathione S-transferase M1 (GSTM1) and glutathione S-transferase T1 (GSTT1) polymorphisms for breast cancer susceptibility. GSTM1 and GSTT1 genes are located on chromosome 1 (1p13.3) and chromosome 22 (22q11.2), respectively.[13] In humans, GSTM1 is expressed in various tissues such as the liver, stomach, brain, and breast, while GSTT1 is mainly expressed in the liver and erythrocytes.[14] Polymorphisms in both GSTM1 and GSTT1 result in gene deletions (null genotype), resulting in loss of expression and enzyme activity loss.[15,16] Lack of enzymatic activity may lead to the occurrence of cancer.
In 1998, the first study of the association between the combined effects of GSTM1 and GSTT1 polymorphisms on breast cancer risk was reported.[17] Subsequently, 34 articles[12–14,17–47] on this issue have been published. However, the results have been controversial and inconsistent. Some studies found no significant association; others reported an increased breast cancer risk. Several previously published meta-analyses did not assess the combined effects of GSTM1 and GSTT1 polymorphisms with breast cancer risk.[48–55] Hence, to address this association, a meta-analysis was performed to explore whether there was an association between the combined effects of GSTM1 and GSTT1 polymorphisms on breast cancer risk.
2. Materials and methods
2.1. Search strategy
PubMed, Embase, China National Knowledge Infrastructure (CNKI), and Wan Fang (WF) databases were searched (the last search was conducted on February 22, 2018). Two authors identified relevant studies using the following search strategy: breast and (glutathione S-transferase M1 OR GSTM1) and (glutathione S-transferase T1 or GSTT1) and (polymorph∗ or mutation∗ or variant∗ or genotype∗). There were no restrictions on language in the meta-analysis. Additional studies were identified through a search of references of original studies or review articles on this topic and through personal contact with the authors if necessary.
2.2. Inclusion and exclusion criteria
The studies were included if they met the following criteria:
-
(1)
case–control, cohort, or nested case–control study;
-
(2)
the diagnosis of breast cancer cases was confirmed pathologically and controls were confirmed to be free of breast cancer;
-
(3)
complete data was supplied to calculate ORs and the corresponding 95% confidence intervals (CIs).
-
(4)
Studies were excluded if they met the following criteria:
-
(5)
duplicate data or incomplete data,
-
(6)
only case studies, and
-
(7)
meta-analyses, letters, reviews, conference abstracts, and case reports.
2.3. Data extraction
Data were extracted independently by 2 authors. Any potential disagreement was adjudicated by a third investigator if required. The following data was collected from studies that met inclusion criteria: the surname of the first author, publication year, country, race, source of cases, source of controls, type of controls, matching, material used for assessment of genotype, sample size of case and control, and genotype frequencies of the combined effects of GSTM1 present/null and GSTT1 present/null polymorphisms.
2.4. Quality score assessment
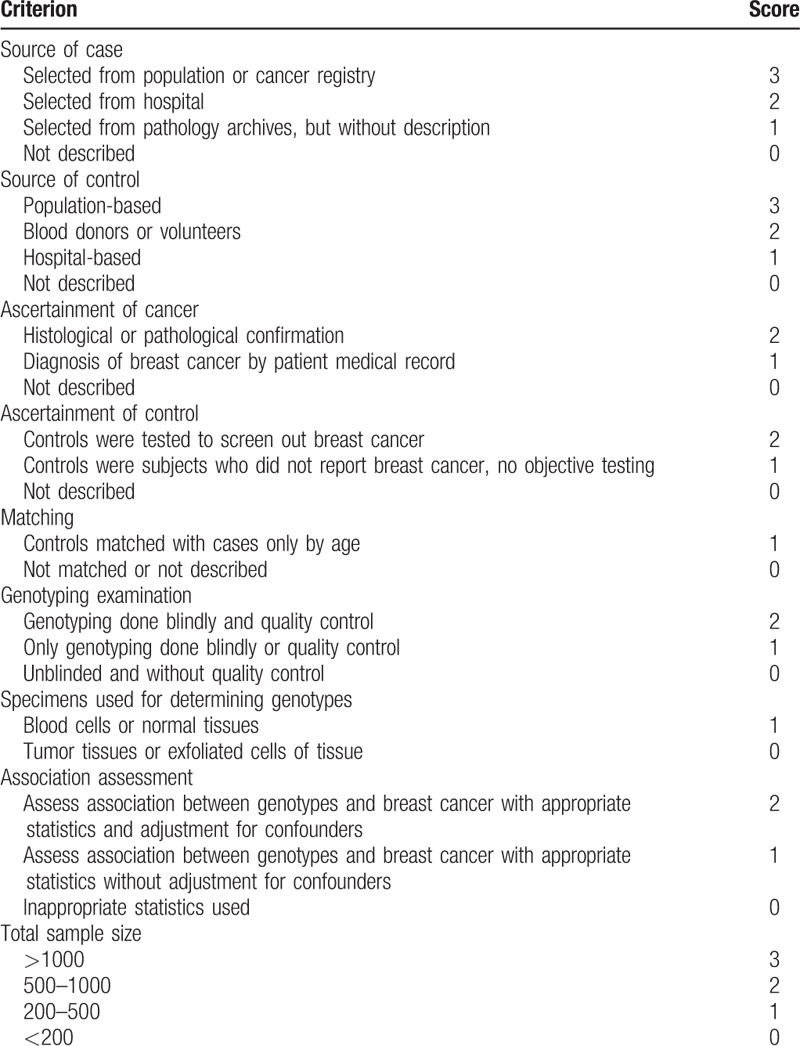
The 2 authors assessed independently assessed the quality of the studies. The quality assessment criteria were modified from previous meta-analyses of molecular association studies.[56,57] Total scores ranging from 0 (worst) to 19 (best) were used to assess the quality of studies (Table 1). Low-quality studies were considered when scores were ≤11, while scores of >11 were considered to be of high quality. Inconsistent scores were adjudicated by a third author.
Table 1.
Scale for quality assessment of molecular association studies of breast cancer.
2.5. Statistical analysis
Pooled the crude odds ratios (ORs) and 95% CIs were calculated by Z-test and P <.05 was considered to be statistically significant. The combined genotypes of GSTM1 and GSTT1 were analyzed using the following 6 genetic models: GSTM1 null/GSTT1 null (− −) versus GSTM1 present/GSTT1 present (+ +), GSTM1 present/GSTT1 null (+ −) versus + +, GSTM1 null/GSTT1 present (− +) versus + +, (+ −) + (− +) versus + +, (− −) + (+ −) + (− +) versus + +, and − − versus (+ +) + (+ −) + (− +). − − represented GSTM1 null/GSTT1 null, + + represented GSTM1 present/GSTT1 present, + − represented GSTM1 present/GSTT1 null, and − + represented GSTM1 null/GSTT1 present. Heterogeneity among studies was assessed by Q test and I2 value (significant heterogeneity was considered when P <.10 and I2 > 50%).[58] Pooled ORs were calculated using a fixed-effects model[59] when the heterogeneity was not significant, otherwise, a random-effects model was used.[60] However, the included studies cannot be pooled into together when I2 value >75%. Subgroup analyses were performed by ethnicity, source of control, matching, and menopausal status. We carried out a sensitivity analysis to assess the stability by the following methods:
-
(1)
a single study was excluded, 1 at a time,
-
(2)
the studies of sample size <200 were excluded,
-
(3)
low-quality studies were excluded, and
-
(4)
we used a dataset that comprised only high-quality studies, matching studies, and genotyping performed blindly or with quality control.[61]
In addition, we applied a meta-regression analysis to explore the sources of heterogeneity. Moreover, publication bias was detected using the Begg funnel plot[62] and Egger regression asymmetry test (statistical significance was considered when P <.05).[63] If there was publication bias, a nonparametric “trim and fill” method was used to impute missing studies.[64] Last, a false-positive report probability (FPRP) test was applied to assess significant results. We preset a FPRP value of 0.2 for noteworthiness and set a prior probability of 0.001 to detect an OR of 1.50 for the combined genotypes with an increased risk. Noteworthy associations were considered when the FPRP values were less than 0.2.[65] All statistical analyses were calculated using STATA version 9.0 (STATA Corporation, College Station, TX).
3. Results
3.1. Characteristics of identified studies
A total of 144, 172, 12, and 15 studies were identified from PubMed, Embase, CNKI, and Wanfan databases (Fig. 1), respectively. In total, 309 records were removed when titles and abstracts were appraised for review articles, case reports, and meta-analyses. In addition, 5 studies[23,36,40,45,46] were also removed because their data had been included in another 3 studies.[18,22,34] Ultimately, 29 papers describing 30 case–control studies were selected (including 10,406 breast cancer patients and 10,115 controls) in this meta-analysis (Tables 2 and 3). Among these studies, thirteen were conducted in Caucasian populations, 5 in Asian, 3 in Indian, 1 in an African population, with 8 in mixed populations. Furthermore, there were 16 high-quality studies and 14 low-quality studies as determined by quality assessment of molecular association studies (Table 1). Eight studies analyzed the combined effects of GSTM1 and GSTT1 polymorphisms among postmenopausal women, and 5 analyzed these associations among premenopausal women, as shown in Tables 4 and 5.
Figure 1.
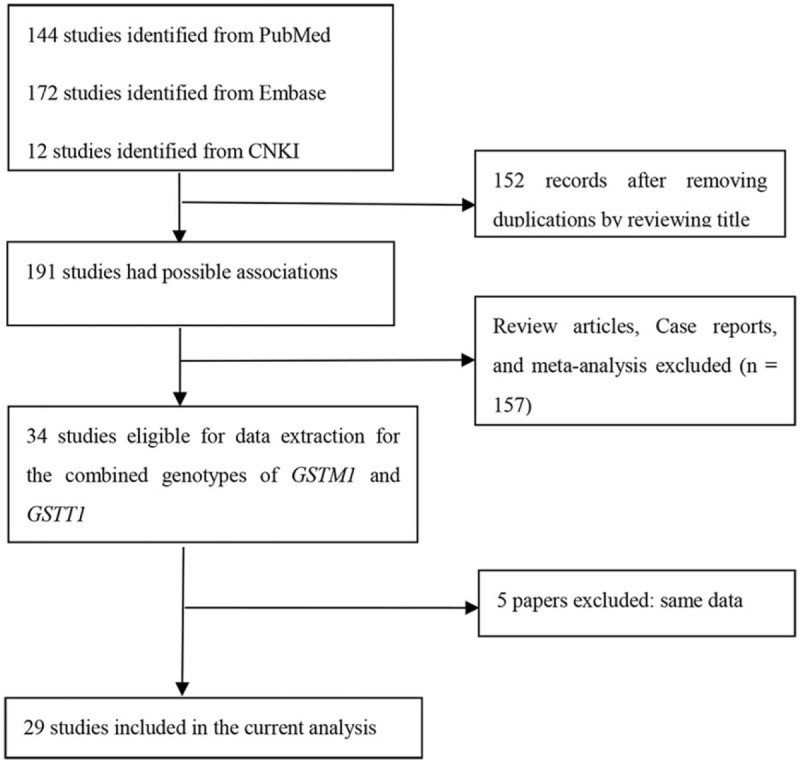
Flow diagram for identifying and including studies in the current meta-analysis.
Table 2.
General characteristics of studies included in pooling gene effects.
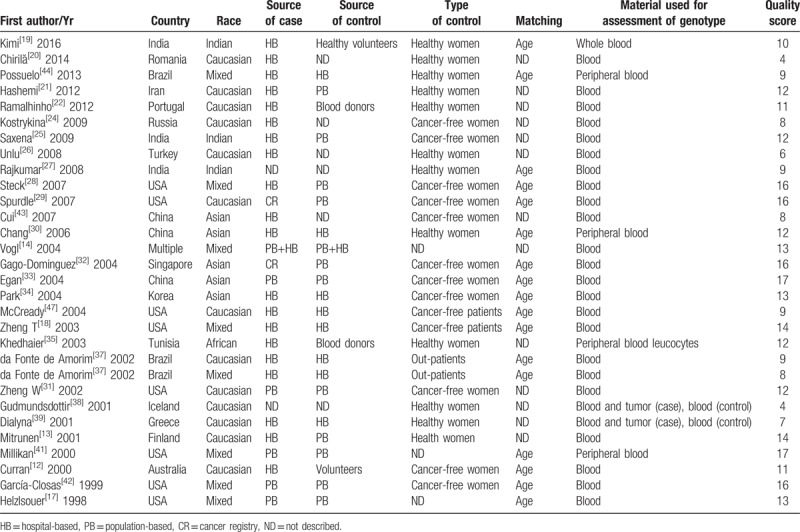
Table 3.
Genotype frequencies of the combined effects of GSTM1 present/null and GSTT1 present/null between breast cancer and control groups.
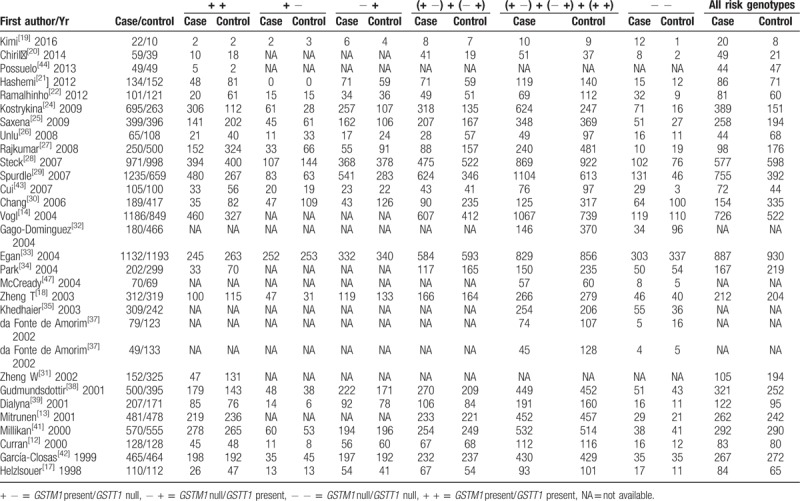
Table 4.
Genotype frequencies of the combined effects of GSTM1 present/null and GSTT1 present/null between post-menopausal breast cancer and control groups.

Table 5.
Genotype frequencies of the combined effects of GSTM1 present/null and GSTT1 present/null between pre-menopausal breast cancer and control groups.

3.2. Quantitative synthesis
Significant heterogeneity was observed when all eligible studies were pooled in this meta-analysis. Hence, a random-effects model was used to pool the overall data. The pooled data yielded a statistically significant association between the combined effects of GSTM1 and GSTT1 polymorphisms and breast cancer risk (Table 6) in all races; respective OR was 1.19 (95% CI: 1.03–1.36, P = .015, Phet <.001, I2 = 60.7%) for − + versus + +, 1.63 (95% CI: 1.29–2.06, P <.001, Phet <.001, I2 = 74.5%) for − − versus + +, 1.17 (95% CI: 1.05–1.31, P = .005, Phet <.001, I2 = 57.9%) for (− +) + (+ −) versus + +, 1.27 (95% CI: 1.12–1.44, P <.001, Phet <.001, I2 = 69.2%) for (− +) + (+ −) + (− −) versus + +, and 1.39 (95% CI: 1.17–1.66, P <.001, Phet <.001, I2 = 66.0%) for − − versus (− +) + (+ −) + (+ +). Subgroup analyses were also performed by ethnicity, source of controls, matching, and menopausal status.
Table 6.
Pooled results of the combined effects of GSTM1 present/null and GSTT1 present/null on breast cancer risk and FPRP test.
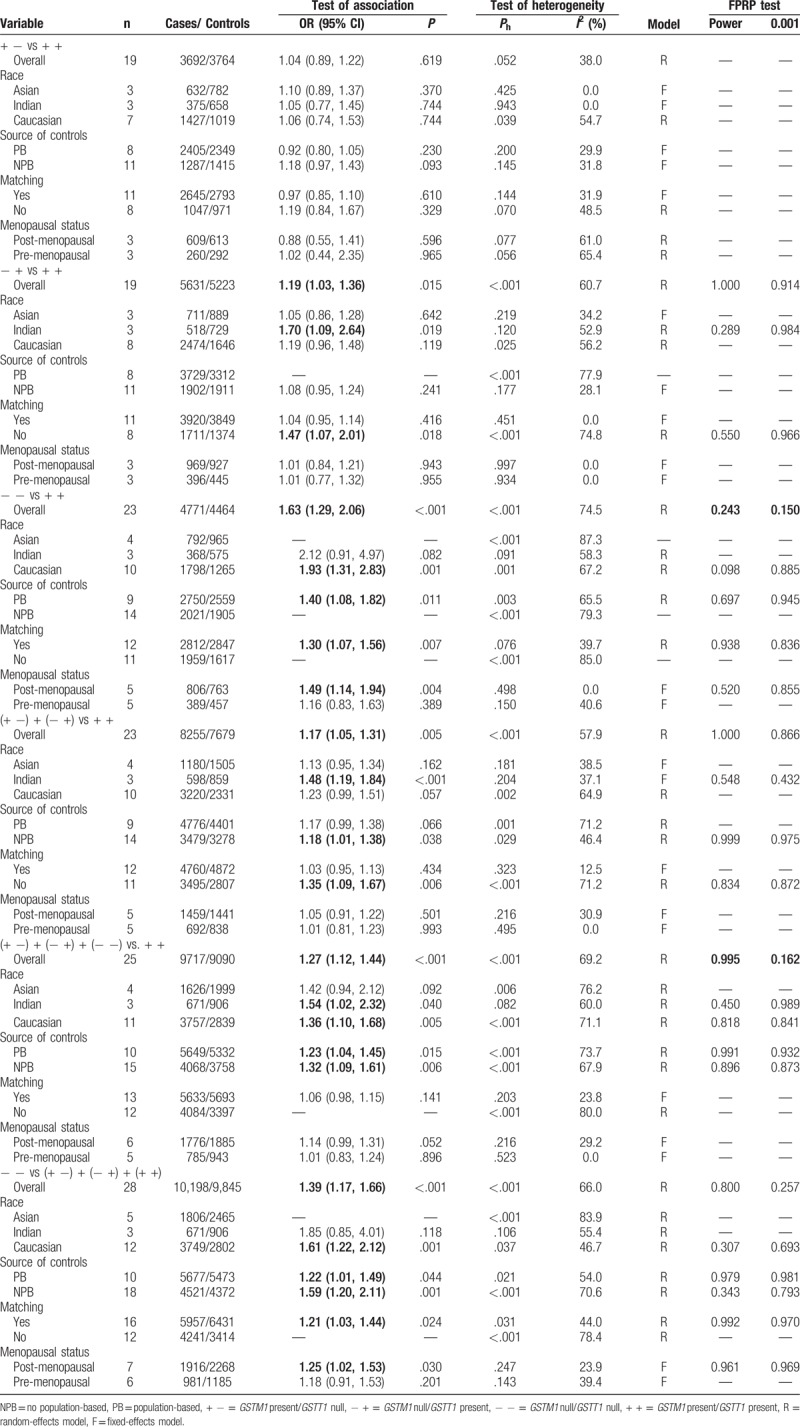
First of all, we analyzed subgroups by ethnicity (Table 6). Pooling data from Caucasians provided evidence of increased breast cancer risk; OR was 1.93 (95% CI: 1.31–2.83, P = .001, Phet = .001, I2 = 67.2%) for − − versus + +, 1.36 (95% CI: 1.10–1.68, P = .005, Phet <.001, I2 = 71.1%) for (− +) + (+ −) + (− −) versus + +, and 1.61 (95% CI: 1.22–2.12, P = .001, Phet = .037, I2 = 46.7%, Fig. 2) for − − versus (− +) + (+ −) + (+ +). Pooling data from Indian populations also showed a statistically significant elevated breast cancer risk; OR was 1.70 (95% CI: 1.09–2.64, P = .019, Phet = .120, I2 = 52.9%) for − + versus + +, 1.48 (95% CI: 1.19–1.84, P <.005, Phet = .204, I2 = 37.1%) for (− +) + (+ −) versus + +, and 1.54 (95% CI: 1.02–2.32, P = .040, Phet = .082, I2 = 60.0%) for (− +) + (+ −) + (− −) versus + +. No significant association was found between the combined effects of GSTM1 and GSTT1 polymorphisms and breast cancer risk in Asian populations.
Figure 2.
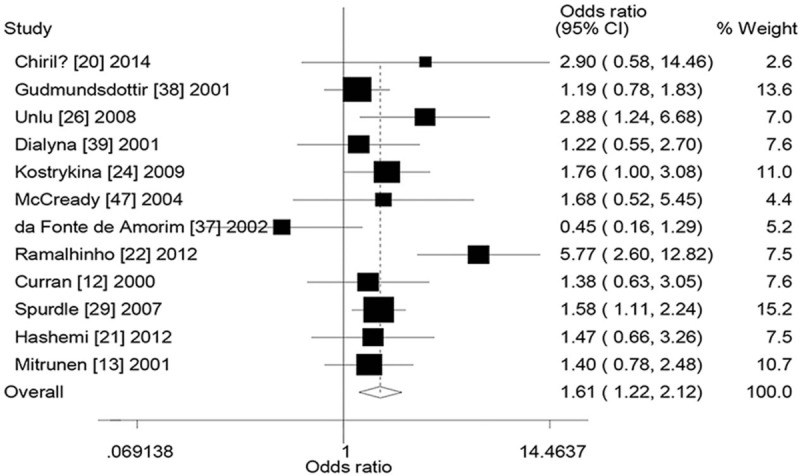
Forest plot for the association between the combined effects of GSTM1 and GSTT1 polymorphisms and breast cancer risk in Caucasians (− − vs (− +) + (+ −) + (+ +)). + − = GSTM1 present/GSTT1 null, − + = GSTM1 null/GSTT1 present, − − = GSTM1 null/GSTT1 null, + + = GSTM1 present/GSTT1 present, GSTM1 = glutathione S-transferase M1, GSTT1 = glutathione S-transferase T1.
Then, subgroups were analyzed by the source of controls (Table 6). A statistically significant association was also shown in the population-based (PB) studies (− − vs + +: OR = 1.40, 95% CI = 1.08–1.82, P = .011, Phet = .003, I2 = 65.5%, (− +) + (+ −) + (− −) vs + +: OR = 1.23, 95% CI = 1.04–1.45, P = .015, Phet <.001, I2 = 73.7%, − − vs (− +) + (+ −) + (+ +): OR = 1.22, 95% CI = 1.01–1.49, P = .044, Phet = .021, I2 = 54.0%) and no PB studies (− + vs + +: OR = 1.18, 95% CI = 1.01–1.38, P = .038, Phet = .029, I2 = 46.4%, (− +) + (+ −) + (− −) vs + +: OR = 1.32, 95% CI = 1.09–1.61, P = .006, Phet <.001, I2 = 67.9%, − − vs (− +) + (+ −) + (+ +): OR = 1.59, 95% CI = 1.20–2.11, P = .001, Phet <.001, I2 = 70.6%).
In addition, we also performed subgroup analysis by matching (Table 6). A statistically significant increased breast cancer risk was yielded in the studies of matching (− − vs + +: OR = 1.30, 95% CI = 1.07–1.56, P = .007, Phet = .076, I2 = 39.7%, − − vs (− +) + (+ −) + (+ +): OR = 1.21, 95% CI = 1.03–1.44, P = .024, Phet = .031, I2 = 44.0%) and no matching (− + vs + +: OR = 1.47, 95% CI = 1.07–2.01, P = .018, Phet <.001, I2 = 74.8%, (− +) + (+ −) vs + +: OR = 1.35, 95% CI = 1.09–1.67, P = .006, Phet <.001, I2 = 71.2%).
Last, analysis of subgroups on the basis of menopausal status (Table 6) showed that the increased breast cancer risk was found in postmenopausal women (− − vs + +: OR = 1.49, 95% CI = 1.14–1.94, P = .004, Phet = .498, I2 = 0.0%, − − vs (− +) + (+ −) + (+ +): OR = 1.25, 95% CI = 1.02–1.53, P = .030, Phet = .247, I2 = 23.9%).
3.3. Heterogeneity and sensitivity analyses
Significant heterogeneity was detected in this meta-analysis (Table 6). Source of heterogeneity was assessed on the basis of ethnicity, source of controls, matching, sample size, and quality score using a meta-regression analysis. The results demonstrated that sample size (+ − vs + +: P = .023, − + vs + +: P = .006, − − vs + +: P = .004, (− +) + (+ −) vs + +: P = .001) and matching (− + vs + +: P = .023) were sources of heterogeneity in several genetic models.
Sensitivity analysis was carried out to assess the robustness of results in this meta-analysis. Table 7 lists the results of sensitivity analysis. The results are stable when a single study was removed each time (Fig. 3). However, the results changed in overall population when the studies of sample size <200 were excluded (− + vs + +: OR = 1.10, 95% CI = 0.97–1.25, (− +) + (+ −) vs + +: OR = 1.09, 95% CI = 0.99–1.19). The results also changed in overall population when the studies of low-quality were excluded (− + vs + +: OR = 1.19, 95% CI = 0.99–1.43, (− +) + (+ −) vs + +: OR = 1.16, 95% CI = 0.99–1.36). Last, significantly increased breast cancer risk was found when the studies only included with high-quality, matching, and genotyping examination performed bindly or with quality control (− − vs + +: OR = 1.27, 95% CI = 1.02–1.59, P = .032, Phet = .038, I2 = 53.0%).
Table 7.
The results of sensitivity analysis and FPRP test in this meta-analysis.
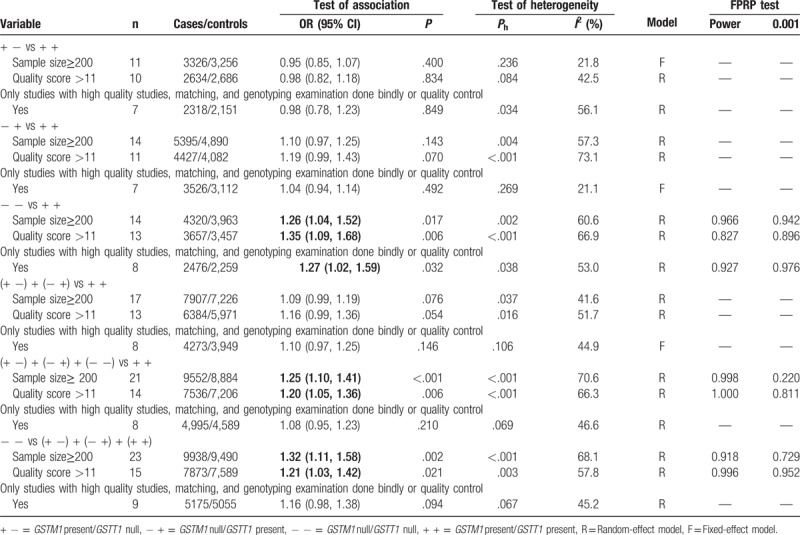
Figure 3.
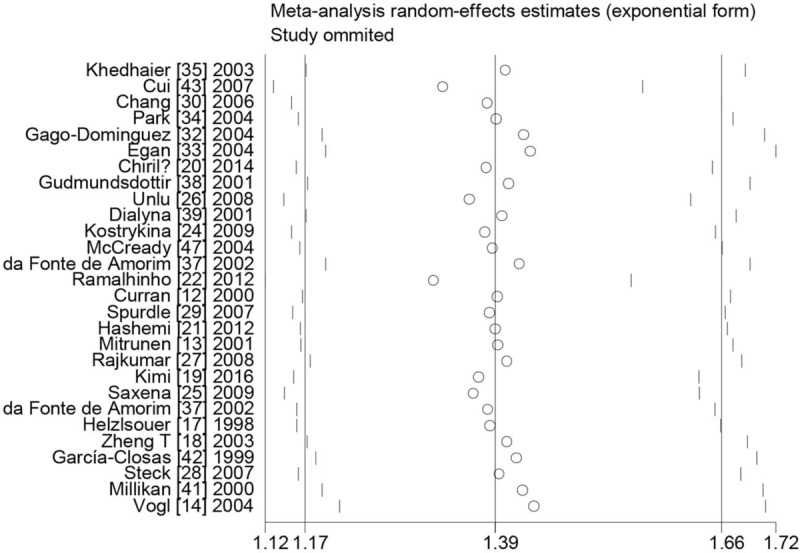
Sensitive analysis between the combined effects of GSTM1 and GSTT1 polymorphisms and breast cancer risk in overall population ((− +) + (+ −) + (− −) vs + +). + − = GSTM1 present/GSTT1 null, − + = GSTM1 null/GSTT1 present, − − = GSTM1 null/GSTT1 null, + + = GSTM1 present/GSTT1 present, GSTM1 = glutathione S-transferase M1, GSTT1 = glutathione S-transferase T1.
3.4. Publication bias
Publication bias was detected using the Begg funnel plot and Egger regression asymmetry test. The shapes of Begg funnel plots (figure not shown) and the results of Egger regression asymmetry test (− + vs + +: P = .049, − − vs + +: P <.001, (+ −) + (− +) vs (+ +): P = .004, (− +) + (+ −) + (− −) vs + +: P = .002, − − vs (− +) + (+ −) + (+ +): P = .001) suggested that evidence of publication bias was observed in this meta-analysis. The funnel plots of the nonparametric “trim and fill” method are listed in Figure 4. The results were changed using the nonparametric trim and fill method in the following 4 genetic models (− + vs + + : OR = 1.02, 95% CI = 0.86–1.20, − − vs + +: OR = 1.12, 95% CI = 0.88–1.44, (+ −) + (− +) vs (+ +): OR = 1.12, 95% CI = 0.88–1.44, − − vs (− +) + (+ −) + (+ +): OR = 1.13, 95% CI = 0.93–1.35) in the overall meta-analysis.
Figure 4.
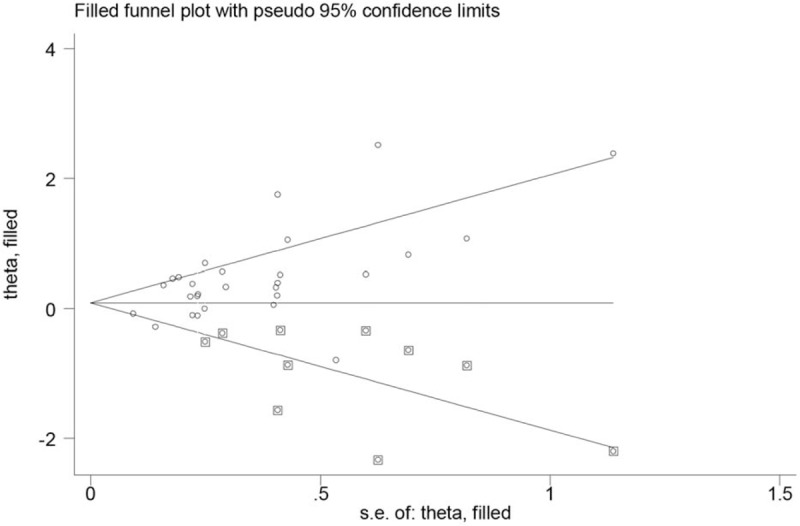
“Trim and fill” plots for the publication bias evaluation between the combined effects of GSTM1 and GSTT1 polymorphisms and breast cancer risk (− − vs (− +) + (+ −) + (+ +)). + − = GSTM1 present/GSTT1 null, − + = GSTM1 null/GSTT1 present, − − = GSTM1 null/GSTT1 null, + + = GSTM1 present/GSTT1 present, GSTM1 = glutathione S-transferase M1, GSTT1 = glutathione S-transferase T1.
3.5. FPRP test results
Statistically significant associations were further investigated on the basis of an FPRP test (Tables 6 and 7). For a pre-specified prior probability of 0.001, the results were only considered noteworthy in overall pooled analysis (FPRP = 0.150 for − − vs + + and FPRP = 0.162 for (− +) + (+ −) + (− −) vs + +, Table 6). However, none of the results were considered noteworthy, especially in the results of sensitivity analysis (Table 7).
4. Discussion
We performed a meta-analysis to assess the association between the combined effects of GSTM1 and GSTT1 polymorphisms on breast cancer risk, including 10,406 breast cancer patients and 10,115 controls. To our knowledge, this is the first meta-analysis to explore whether there was an association on this issue.
The pooled data from all eligible studies yielded an association between the combined effects of GSTM1 and GSTT1 polymorphisms and breast cancer risk. In addition, statistically significant increased breast cancer risk was also found in several subgroups, such as Caucasians, Indians, postmenopausal women, and so on, as shown in Table 6. The pooled data were analyzed using 6 different genetic models in this study. Under the circumstances, the P value must be adjusted to explain the multiple comparisons.[66] However, when P values were adjusted according to the FPRP method, none of the results in this meta-analysis were considered noteworthy, except the overall pooled analysis on the basis of a pre-specified prior probability of 0.001. Further, there were only 12 studies in which genotyping examination was performed blindly or with quality control. There were 18 studies that were age-matched in cases and controls, but bias may exist in the non-matched studies. Hence, we further performed a sensitivity analysis restricted to studies that only included high-quality articles, matching, and genotyping examination performed blindly or with quality control. The pooled results were not still considered noteworthy by FPRP methods. This was an attempt to avoid random errors and confounding bias that sometimes distorted the results of molecular epidemiological studies.[67–69] Overall, the results of the present meta-analysis are more close to real value. Based on biochemical properties described for GSTM1 and GSTT1 polymorphisms, we expected that the combined effects of the 2 genes were associated with risk of breast cancer risk in all races. However, a significantly increased breast cancer risk may most likely be from false-positive results. Therefore, future studies should be based on sample sizes well-powered and attention needs to be paid to study design to further identify our findings.
There was significant heterogeneity in this meta-analysis. A meta-regression analysis was performed to explore the source of heterogeneity. We found sample size have contributed to the heterogeneity. In addition, evidence of publication bias was observed in this work (Fig. 4 indicates that bias is from small-size studies). therefore, the potential source of type I error (elevation of false-positive results) may be based on publication bias in this study.[70] Moreover, some small sample studies may be easier to accept if there was a positive report as they tend to yield false-positive results because they may be not rigorous and are often of low-quality. Furthermore, the results were also changed in overall analysis when we used the nonparametric trim and fill method. Random error and bias were common in these studies with small sample sizes, and the results were unreliable, especially in molecular epidemiological studies.[71] In addition, research indicated that the absence of SNPs is a frequent occurrence in tumor cells.[72] Hence, data from studies of genetic polymorphisms should be more reliable when DNA was isolated from blood cell rather than tumor cells.
There are some limitations in this meta-analysis. First, only published articles were selected in this study. Second, we did not uniformly define the controls. There were controls of 12 studies from healthy women, 11 studies from cancer-free women, 4 studies from cancer-free patients, and 3 studies with undefined controls. Hence, non-differential misclassification bias was possible exist. Third, we did not consider whether the genotype distribution in the controls was in Hardy–Weinberg equilibrium (HWE). Under normal circumstances, the HWE in the meta-analysis of genetic polymorphisms must be calculated to assess the quality, genotyping errors, and selection bias in the study.[73,74] However, we cannot calculate or extract the relevant data in the original studies. Fourth, no data were extracted on other risk factors, such as hormonal readiness, obesity, smoking, and so on. This study has also several strengths. First, a meta-analysis can increase the statistical power more than any single study. Second, we used the FPRP value to explore the false-positive results. Third, we performed an important sensitivity analysis, a dataset was used that the studies with high-quality, matching, and genotyping examination performed bindly or with quality control were only included.
After more than 10 years of extensive research on this issue, our findings should be interpreted with caution and indicate that an increased breast cancer risk may most likely result from false-positive results, rather than from true associations or biological factors on the combined effects of GSTM1 and GSTT1. Future studies should be based on sample sizes well-powered and attention needs to be paid to study design to further identify this issue.
Acknowledgments
We thank H. Nikki March, PhD, from Liwen Bianji, Edanz Editing China (www.liwenbianji.cn/ac), for editing the English text of a draft of this manuscript.
Author contributions
Conceptualization: Xiao-Feng He.
Data curation: Li-Feng Miao, Xiang-Hua Ye, Meng-Shen Cui.
Formal analysis: Xiao-Feng He, Xiao-Yan Wang.
Funding acquisition: Xiang-Hua Ye.
Investigation: Li-Feng Miao, Xiao-Yan Wang, Xiang-Hua Ye, Meng-Shen Cu
Methodology: Li-Feng Miao, Xiao-Feng He.
Resources: Li-Feng Miao, Xiang-Hua Ye, Meng-Shen Cui.
Software: Xiao-Feng He, Xiao-Yan Wang.
Supervision: Xiao-Feng He.
Validation: Xiao-Feng He.
Visualization: Xiao-Feng He, Xiao-Yan Wang.
Writing – original draft: Li-Feng Miao.
Writing – review & editing: Xiao-Feng He, Xiao-Yan Wang, Xiang-Hua Ye.
Footnotes
Abbreviations: + + = GSTM1 present/GSTT1 present, + − = GSTM1 present/GSTT1 null, − + = GSTM1 null/GSTT1 present, − − = GSTM1 null/GSTT1 null, CIs = confidence intervals, CNKI = China National Knowledge Infrastructure, FPRP: false-positive report probability, GSTM1 = glutathione S-transferase M1, GSTs = glutathione S-transferases, GSTT1 = glutathione S-transferase T1, ORs = odds ratios, PAHs = polycyclic aromatic hydrocarbons, PB = population-based.
L-FM and X-YW contributed equally to this work.
This work was supported by Science Technology Foundation of Zhejiang province under Grant (No. 2015C33199), Healthy Science Foundation of Zhejiang province under Grant (2015KYB131), and Traditional Chinese Medicine Foundation of Zhejiang province under Grant (2013KY1001128).
This is a meta-analysis, hence, ethical approval was waived or not necessary.
The study was designed by X-FH. L-FM, X-HY, and M-SC did the literature search, study quality assessment, and data extraction. X-FH and X-YW performed the statistical analysis and drafted the tables and figures. L-FM wrote the first draft of this analysis, and X-FH, X-HY, and X-YW helped to finish the final version. All authors approved the conclusions of our study.
The authors have no conflicts of interest to disclose.
References
- [1].Jemal A, Clegg LX, Ward E, et al. Annual report to the nation on the status of cancer, 1975–2001, with a special feature regarding survival. Cancer 2004;101:3–27. [DOI] [PubMed] [Google Scholar]
- [2].Pinheiro PS, Tycznski JE, Bray F, et al. Cancer incidence and mortality in Portugal. Eur J Cancer 2003;39:2507–20. [DOI] [PubMed] [Google Scholar]
- [3].Murthy NS, Chaudhry K, Nadayil D, et al. Changing trends in incidence of breast cancer: Indian scenario. Indian J Cancer 2009;46:73–4. [DOI] [PubMed] [Google Scholar]
- [4].Farbers JF. The incidence of breast cancer: the global burden, public health considerations. Semin Oncol 1997;24:S1–20. [PubMed] [Google Scholar]
- [5].Ghatak S, Doris L, Mawia L, et al. Mitochondrial D-Loop and cytochrome oxidase subunit I polymorphisms among the breast cancer patients of Mizoram, Northeast India. Curr Genet 2014;60:201–12. [DOI] [PubMed] [Google Scholar]
- [6].Sieri S, Krogh V, Ferrari P, et al. Dietary fat and breast cancer risk in the European prospective investigation into cancer and nutrition. Am J Clin Nutr 2008;88:1304–12. [DOI] [PubMed] [Google Scholar]
- [7].de Jong MM, Nolte IM, te Meerman GJ, et al. Genes other than BRCA1 and BRCA2 involved in breast cancer susceptibility. J Med Genet 2002;39:225–42. [DOI] [PMC free article] [PubMed] [Google Scholar]
- [8].Dunning AM, Healey CS, Pharoah PD, et al. A systematic review of genetic polymorphisms and breast cancer risk. Cancer Epidemiol Biomarkers Prev 1999;8:843–54. [PubMed] [Google Scholar]
- [9].Hayes JD, Pulford DJ. The glutathione S-transferase supergene family: regulation of GST and the contribution of the isoenzymes to cancer chemoprotection and drug resistance. Crit Rev Biochem Mol Biol 1995;30:445–600. [DOI] [PubMed] [Google Scholar]
- [10].Hengstler JG, Arand M, Herrero ME, et al. Polymorphisms of N-acetyltransferases, glutathione S-transferases, microsomal epoxide hydrolase and sulfotransferases: influence on cancer susceptibility. Recent Results Cancer Res 1998;154:47–85. [DOI] [PubMed] [Google Scholar]
- [11].Rebbeck TR. Molecular epidemiology of the human glutathione S-transferase genotypes GSTM1 and GSTT1 in cancer susceptibility. Cancer Epidemiol Biomark Prev 1997;6:733–43. [PubMed] [Google Scholar]
- [12].Curran JE, Weinstein SR, Griffiths LR. Polymorphisms of glutathione S-transferase genes (GSTM1, GSTP1 and GSTT1) and breast cancer susceptibility. Cancer Lett 2000;153:113–20. [DOI] [PubMed] [Google Scholar]
- [13].Mitrunen K, Jourenkova N, Kataja V, et al. Glutathione S-transferase M1, M3, P1, and T1 genetic polymorphisms and susceptibility to breast cancer. Cancer Epidemiol Biomarkers Prev 2001;10:229–36. [PubMed] [Google Scholar]
- [14].Vogl FD, Taioli E, Maugard C, et al. Glutathione S-transferases M1, T1, and P1 and Breast Cancer: A Pooled Analysis. Cancer Epidemiol Biomarkers Prev 2004;13:1473–9. [PubMed] [Google Scholar]
- [15].Hayes JD, Strange RC. Glutathione s-transferase polymorphisms and their biological consequences. Pharmacology 2000;61:154–66. [DOI] [PubMed] [Google Scholar]
- [16].Seidegard J, Vorachek WR, Pero RW, et al. Hereditary differences in the expression of the human glutathione transferase active on trans-stilbene oxide are due to a gene deletion. Proc Natl Acad Sci USA 1988;85:7293–7. [DOI] [PMC free article] [PubMed] [Google Scholar]
- [17].Helzlsouer KJ, Selmin O, Huang HY, et al. Association between glutathione S-transferase M1, P1, and T1 genetic polymorphisms and development of breast cancer. J Natl Cancer Inst 1998;90:512–8. [DOI] [PubMed] [Google Scholar]
- [18].Zheng T, Holford TR, Zahm SH, et al. Glutathione S-transferase M1 and T1 genetic polymorphisms, alcohol consumption and breast cancer risk. Br J Cancer 2003;88:58–62. [DOI] [PMC free article] [PubMed] [Google Scholar]
- [19].Kimi L, Ghatak S, Yadav RP, et al. Relevance of GSTM1, GSTT1 and GSTP1 gene polymorphism to breast cancer susceptibility in Mizoram population. Northeast India Biochem Genet 2016;54:41–9. [DOI] [PubMed] [Google Scholar]
- [20].Chirilă DN, Bălăcescu O, Popp R, et al. GSTM1, GSTT1 and GSTP1 in patients with multiple breast cancers and breast cancer in association with another type of cancer. Chirurgia (Bucur) 2014;109:626–33. [PubMed] [Google Scholar]
- [21].Hashemi M, Eskandari-Nasab E, Fazaeli A, et al. Association between polymorphisms of glutathione S-transferase genes (GSTM1, GSTP1 and GSTT1) and breast cancer risk in a sample Iranian population. Biomark Med 2012;6:797–803. [DOI] [PubMed] [Google Scholar]
- [22].Ramalhinho AC, Fonseca-Moutinho JA, Breitenfeld Granadeiro LA. Positive association of polymorphisms in estrogen biosynthesis gene, CYP19A1, and metabolism, GST, in breast cancer susceptibility. DNA Cell Biol 2012;31:1100–6. [DOI] [PubMed] [Google Scholar]
- [23].Ramalhinho AC, Fonseca-Moutinho JA, Breitenfeld L. Glutathione S-transferase M1, T1, and P1 genotypes and breast cancer risk: a study in a Portuguese population. Mol Cell Biochem 2011;355:265–71. [DOI] [PubMed] [Google Scholar]
- [24].Kostrykina NA, Pechkovskii EV, Mishukova OV, et al. Studying the association of polymorphic variants of GSTM1 and GSTT1 genes with breast cancer in female residents of Altai Krai. Bull Exp Biol Med 2009;148:89–93. [DOI] [PubMed] [Google Scholar]
- [25].Saxena A, Dhillon VS, Raish M, et al. Detection and relevance of germline genetic polymorphisms in glutathione S-transferases (GSTs) in breast cancer patients from northern Indian population. Breast Cancer Res Treat 2009;115:537–43. [DOI] [PubMed] [Google Scholar]
- [26].Unlu Ä, Ates NA, Tamer L, et al. Relation of glutathione S-transferase T1, M1 and P1 genotypes and breast cancer risk. Cell Biochem Funct 2008;26:643–7. [DOI] [PubMed] [Google Scholar]
- [27].Rajkumar T, Samson M, Rama R, et al. TGFbeta1 (Leu10Pro), p53 (Arg72Pro) can predict for increased risk for breast cancer in south Indian women and TGFbeta1 Pro (Leu10Pro) allele predicts response to neo-adjuvant chemo-radiotherapy. Breast Cancer Res Treat 2008;112:81–7. [DOI] [PubMed] [Google Scholar]
- [28].Steck SE, Gaudet MM, Britton JA, et al. Interactions among GSTM1, GSTT1 and GSTP1 polymorphisms, cruciferous vegetable intake and breast cancer risk. Carcinogenesis 2007;28:1954–9. [DOI] [PubMed] [Google Scholar]
- [29].Spurdle AB, Chang JH, Byrnes GB, et al. A systematic approach to analysing gene-gene interactions: polymorphisms at the microsomal epoxide hydrolase EPHX and glutathione S-transferase GSTM1, GSTT1, and GSTP1 loci and breast cancer risk. Cancer Epidemiol Biomarkers Prev 2007;16:769–74. [DOI] [PubMed] [Google Scholar]
- [30].Chang TW, Wang SM, Guo YL, et al. Glutathione S-transferase polymorphisms associated with risk of breast cancer in southern Taiwan. Breast 2006;15:754–61. [DOI] [PubMed] [Google Scholar]
- [31].Zheng W, Wen WQ, Gustafson DR, et al. GSTM1 and GSTT1 polymorphisms and postmenopausal breast cancer risk. Breast Cancer Res Treat 2002;74:9–16. [DOI] [PubMed] [Google Scholar]
- [32].Gago-Dominguez M, Castelao JE, Sun CL, et al. Marine n-3 fatty acid intake, glutathione S-transferase polymorphisms and breast cancer risk in post-menopausal Chinese women in Singapore. Carcinogenesis 2004;25:2143–7. [DOI] [PubMed] [Google Scholar]
- [33].Egan KM, Cai Q, Shu XO, et al. Genetic polymorphisms in GSTM1, GSTP1, and GSTT1 and the risk for breast cancer: results from the Shanghai breast cancer study and meta-analysis. Cancer Epidemiol Biomarkers Prev 2004;13:197–204. [DOI] [PubMed] [Google Scholar]
- [34].Park SK, Yim DS, Yoon KS. Combined effect of GSTM1, GSTT1, and COMT genotypes in individual breast cancer risk. Breast Cancer Res Treat 2004;88:55–62. [DOI] [PubMed] [Google Scholar]
- [35].Khedhaier A, Remadi S, Corbex M, et al. Glutathione S-transferases (GSTT1 and GSTM1) gene deletions in Tunisians: susceptibility and prognostic implications in breast carcinoma. Br J Cancer 2003;89:1502–7. [DOI] [PMC free article] [PubMed] [Google Scholar]
- [36].Kang D. Genetic polymorphisms and cancer susceptibility of breast cancer in Korean women. J Biochem Mol Biol 2003;36:28–34. [DOI] [PubMed] [Google Scholar]
- [37].da Fonte de Amorim L, Rossini A, Mendonça G, et al. CYP1A1, GSTM1, and GSTT1 polymorphisms and breast cancer risk in Brazilian women. Cancer Lett 2002;181:179–86. [DOI] [PubMed] [Google Scholar]
- [38].Gudmundsdottir K, Tryggvadottir L, Eyfjord JE. GSTM1, GSTT1 and GSTP1 genotypes in relation to breast cancer risk and frequency of mutations in the p53 gene. Cancer Epidemiol Biomarkers Prev 2001;10:1169–73. [PubMed] [Google Scholar]
- [39].Dialyna IA, Arvanitis DA, Spandidos DA. Genetic polymorphisms and transcriptional pattern analysis of CYP1A1, AhR, GSTM1, GSTP1 and GSTT1 genes in breast cancer. Int J Mol Med 2001;8:79–87. [DOI] [PubMed] [Google Scholar]
- [40].Park SK, Yoo KY, Lee SJ, et al. Alcohol consumption, glutathione S-transferase M1 and T1 genetic polymorphisms and breast cancer risk. Pharmacogenetics 2000;10:301–9. [DOI] [PubMed] [Google Scholar]
- [41].2000;Millikan R, Pittman G, Tse CK, et al. Newman B, Bell D. Glutathione S-transferases M1, T1, and P1 and breast cancer. Cancer Epidemiol Biomarkers Prev. 9:567–73. [PubMed] [Google Scholar]
- [42].García-Closas M, Kelsey KT, Hankinson SE, et al. Glutathione S-transferase mu and theta polymorphisms and breast cancer susceptibility. J Natl Cancer Inst 1999;91:1960–4. [DOI] [PubMed] [Google Scholar]
- [43].Cui ZY, Ma J, Qian BY, et al. Case-control study on polymorphism of GSTT1 and GSTM1 in breast cancer. Tianjin Med J 2007;35:284–6. [Google Scholar]
- [44].Possuelo LG, Peraça CF, Eisenhardt MF, et al. Polymorphisms of GSTM1 and GSTT1 genes in breast cancer susceptibility: a case-control study. Rev Bras Ginecol Obstet 2013;35:569–74. [DOI] [PubMed] [Google Scholar]
- [45].Park SK, Kang D, Noh DY, et al. Reproductive factors, glutathione S-transferase M1 and T1 genetic polymorphism and breast cancer risk. Breast Cancer Res Treat 2003;78:89–96. [DOI] [PubMed] [Google Scholar]
- [46].Zheng T, Holford TR, Zahm SH, et al. Cigarette smoking, glutathione-s-transferase M1 and T1 genetic polymorphisms, and breast cancer risk (United States). Cancer Causes Control 2002;13:637–45. [DOI] [PubMed] [Google Scholar]
- [47].McCready D, Aronson KJ, Chu W, et al. Breast tissue organochlorine levels and metabolic genotypes in relation to breast cancer risk Canada. Cancer Causes Control 2004;15:399–418. [DOI] [PubMed] [Google Scholar]
- [48].Sull JW, Ohrr H, Kang DR, et al. Glutathione S-transferase M1 status and breast cancer risk: a meta-analysis. Yonsei Med J 2004;45:683–9. [DOI] [PubMed] [Google Scholar]
- [49].Sergentanis TN, Economopoulos KP. GSTT1 and GSTP1 polymorphisms and breast cancer risk: a meta-analysis. Breast Cancer Res Treat 2010;121:195–202. [DOI] [PubMed] [Google Scholar]
- [50].Qiu LX, Yuan H, Yu KD, et al. Glutathione S-transferase M1 polymorphism and breast cancer susceptibility: a meta-analysis involving 46,281 subjects. Breast Cancer Res Treat 2010;121:703–8. [DOI] [PubMed] [Google Scholar]
- [51].Chen XX, Zhao RP, Qiu LX, et al. Glutathione S-transferase T1 polymorphism is associated with breast cancer susceptibility. Cytokine 2011;56:477–80. [DOI] [PubMed] [Google Scholar]
- [52].Wan G, Li F, Li W, et al. Glutathione S-transferase M1 polymorphism and susceptibility to breast cancer in Chinese population: a meta-analysis. Zhonghua Bing Li Xue Za Zhi 2014;43:158–62. [PubMed] [Google Scholar]
- [53].Xiao ZS, Li Y, Guan YL, et al. GSTT1 polymorphism and breast cancer risk in the Chinese population: an updated meta-analysis and review. Int J Clin Exp Med 2015;8:6650–7. [PMC free article] [PubMed] [Google Scholar]
- [54].Tang J, Zhou Q, Zhao F, et al. Association of glutathione S-transferase T1, M1 and P1 polymorphisms in the breast cancer risk: a meta-analysis in Asian population. Int J Clin Exp Med 2015;8:12430–47. [PMC free article] [PubMed] [Google Scholar]
- [55].Song Z, Shao C, Feng C, et al. Association of glutathione S-transferase T1, M1, and P1 polymorphisms in the breast cancer risk: a meta-analysis. Ther Clin Risk Manag 2016;12:763–9. [DOI] [PMC free article] [PubMed] [Google Scholar]
- [56].Thakkinstian A, McKay GJ, McEvoy M, et al. Systematic review and meta-analysis of the association between complement component 3 and age-related macular degeneration: a HuGE review and meta-analysis. Am J Epidemiol 2011;173:1365–79. [DOI] [PubMed] [Google Scholar]
- [57].Xue WQ, He YQ, Zhu JH, et al. Association of BRCA2 N372H polymorphism with cancer susceptibility: a comprehensive review and meta-analysis. Sci Rep 2014;4:6791. [DOI] [PMC free article] [PubMed] [Google Scholar]
- [58].Higgins JP, Thompson SG, Deeks JJ, et al. Measuring inconsistency in meta-analysis. Br Med J 2003;327:557–60. [DOI] [PMC free article] [PubMed] [Google Scholar]
- [59].Mantel N, Haenszel W. Statistical aspects of the analysis of data from retrospective studies of disease. Natl Cancer Inst 1959;22:719–48. [PubMed] [Google Scholar]
- [60].DerSimonian R, Laird N. Meta-analysis in clinical trials. Control Clin Trials 1986;7:177–88. [DOI] [PubMed] [Google Scholar]
- [61].Klug SJ, Ressing M, Koenig J, et al. TP53 codon 72 polymorphism and cervical cancer: a pooled analysis of individual data from 49 studies. Lancet Oncol 2009;10:772–84. [DOI] [PubMed] [Google Scholar]
- [62].Begg CB, Mazumdar M. Operating characteristics of a rank correlation test for publication bias. Biometrics 1994;50:1088–101. [PubMed] [Google Scholar]
- [63].Egger M, Smith DG, Schneider M, et al. Bias in meta-analysis detected by a simple, graphical test. Br Med J 1997;315:629–34. [DOI] [PMC free article] [PubMed] [Google Scholar]
- [64].Dual S, Tweedie R. A nonparametric “trim and fill” method of accounting for publication bias in meta-analysis. J Am Stat Assoc 2000;95:89–98. [Google Scholar]
- [65].Wacholder S, Chanock S, Garciaclosas M, et al. Assessing the probability that a positive report is false: an approach for molecular epidemiology studies. J Natl Cancer Inst 2004;96:434–42. [DOI] [PMC free article] [PubMed] [Google Scholar]
- [66].Attia J, Thakkinstian A, D’Este C. Meta-analyses of molecular association studies: methodologic lessons for genetic epidemiology. J Clin Epidemiol 2003;56:297–303. [DOI] [PubMed] [Google Scholar]
- [67].Yesupriya A, Evangelou E, Kavvoura FK, et al. Reporting of human genome epidemiology (HuGE) association studies: an empirical assessment. BMC Med Res Methodol 2008;8:31. [DOI] [PMC free article] [PubMed] [Google Scholar]
- [68].Wild CP, Vineis P, Garte S. Molecular epidemiology of chronic diseases. West Sussex: John Wiley and Son 2008. [Google Scholar]
- [69].Vineis P, Perera F. Molecular epidemiology and biomarkers in etiologic cancer research: the new in light of the old. Cancer Epidemiol Biomarkers Prev 2007;16:1954–65. [DOI] [PubMed] [Google Scholar]
- [70].Harrison F. Getting started with meta-analysis. Methods Ecol Evol 2011;2:1–0. [Google Scholar]
- [71].Ioannidis JP, Boffetta P, Little J, et al. Assessment of cumulative evidence on genetic associations: interim guidelines. Int J Epidemiol 2008;37:120–32. [DOI] [PubMed] [Google Scholar]
- [72].Lea IA, Jackson MA, Li X, et al. Genetic pathways and mutation profi les of human cancers: site and exposure-specifi c patterns. Carcinogenesis 2007;28:1851–8. [DOI] [PMC free article] [PubMed] [Google Scholar]
- [73].Thakkinstian A, McElduff P, D’Este C, et al. A method for meta-analysis of molecular association studies. Stat Med 2005;24:1291–306. [DOI] [PubMed] [Google Scholar]
- [74].Hosking L, Lumsden S, Lewis K, et al. Detection of genotyping errors by Hardy–Weinberg equilibrium testing. Eur J Hum Genet 2004;12:395–9. [DOI] [PubMed] [Google Scholar]


