

Abstract
Hyperpolarized-13C MRI takes advantage of the unprecedented 50,000x SNR enhancement to interrogate cancer metabolism in patients and animals. It can measure the pyruvate-to-lactate conversion rate, kPL, a metabolic biomarker of cancer aggressiveness and progression. Therefore, it is crucial to evaluate kPL reliably. In this study, three sequence components and parameters that modulate kPL estimation were identified and investigated in model simulations and through in vivo animal studies using several specifically designed pulse sequences. These factors included a magnetization spoiling effect due to RF pulses, a crusher gradient-induced flow suppression, and intrinsic image weightings due to relaxation. Simulation showed the RF-induced magnetization spoiling can be substantially improved using an inputless kPL fitting. In vivo studies found a significantly higher apparent kPL with an additional gradient that leads to flow suppression (kPL,FID-Delay,Crush/kPL,FID-Delay = 1.37±0.33, P<0.01, N=6), which agrees with simulation outcomes (12.5% kPL error with Δv=40cm/s), indicating that the gradients predominately suppressed flowing pyruvate spins. Significantly lower kPL was found using a delayed FID acquisition versus a minimum-TE version (kPL,FID-Delay/kPL,FID = 0.67±0.09, P<0.01, N=5), and the lactate peak had broader linewidth than pyruvate (Δωlactate/Δωpyruvate = 1.32±0.07, P<0.00001, N=13). This illustrated that lactate’s shorter T2* than pyruvate can affect calculated kPL values. We also found an FID sequence yielded significantly lower kPL versus a double spin-echo sequence that includes spin-echo spoiling, flow suppression from crusher gradients, and more T2-weighting (kPL,DSE/kPL,FID = 2.40±0.98, P<0.0001, N=7). In summary, the pulse sequence, as well as its interaction with pharmacokinetics and tissue microenvironment can impact and be optimized for the measurement of kPL. The data acquisition and analysis pipelines can work synergistically to provide more robust and reproducible kPL measures for future preclinical and clinical studies.
Keywords: Hyperpolarized C-13 Pyruvate, Pulse Sequence, Kinetic Modeling, Cancer Imaging
Graphical Abstract
This study investigated three pulse sequence components and parameters that can affect estimates of kPL in HP-13C MRI. In vivo animal tumor studies showed significant impact of kPL with crusher-gradient induced flow suppression, and intrinsic image weighting due to relaxation, corroborated by signal-model simulations. RF-induced magnetization spoiling can be substantially improved using an inputless kPL fitting. These outcomes suggested that the pulse sequence, as well as its interaction with pharmacokinetics and tissue microenvironment can impact the measurement of kPL.
1. Introduction:
Hyperpolarized-13C MRI (HP-13C MRI) has the potential to revolutionize global cancer care and management by providing unprecedented measurements of metabolic markers of aggressiveness and response to therapy [1]. This unique technology takes advantage of the unprecedented 50,000 fold enhancement in signal-to-noise ratio, enabled by dynamic nuclear polarization (DNP), to interrogate cancer pathophysiology, such as metabolism and perfusion in vivo and in real time [2–4]. Preclinical results have shown significant correlations between cancer grade and HP-13C MRI quantifications of metabolism via the pyruvate-to-lactate conversion rate kPL [5–7]. A recent study quantitatively investigated kPL in transgenic murine model of prostate cancer (TRAMP) using kinetic modeling, and found strong correlations between kPL, pathological grades, as well as expression and activity of several key genes and enzymes, notably LDHA, which is strongly associated with cancer aggressiveness and progression [8]. Preliminary outcomes from phase II patient studies further indicated that high kPL correlated very well with biopsy and pathological findings of aggressive human prostate cancer [9] and poor response to therapy [10]. Also, high lactate/pyruvate ratios were found in progressive glioblastoma [11].
Reliable measurements of metabolism in vivo are necessary to non-invasively probe cancer metabolism, tumor aggressiveness and response to therapy in both research and clinical settings. The rate constant kPL can be calculated by first choosing a kinetic model, and fitting the measured signal evolution curves of HP-13C pyruvate and lactate to the model. Compared to ratiometric methods, kinetic modeling opens up the possibility to incorporate a range of pharmacokinetic interactions. For instance, this can include an arterial input function (AIF) that characterizes the size, shape and timing of the injected pyruvate bolus [12]. Moreover, the bolus delivery and clearance parameters describe perfusion to the tumor microvasculature, permeability to interstitial space, cancer cellular uptake, and release and removal of HP compounds [13, 14]. Additionally, using kinetic modeling enables incorporation of hyperpolarized signal loss mechanisms, primarily the RF pulses used to interrogate HP magnetization and the intrinsic T1 relaxation of HP biomarkers.
A variety of modeling strategies have been developed to quantify kPL. For instance, Kazan and colleagues proposed a two-site exchange model where pyruvate and lactate compartments in tumor were individually supplied by pyruvate and lactate AIFs in blood [15]. Harrison et al. adopted a model that included both tumor and extracellular extravascular space (EES) compartments, but excluded an AIF for in vitro studies [16]. Zierhut’s model is similar to Kazan’s, but assumes no lactate AIF [17]. Bahrami et al. uses a two-site exchange model that incorporates neither pyruvate nor lactate AIF for simplicity [18, 19], and Hill et al. and Daniels et al. also adopted similar strategies [20, 21]. Recently, Bankson and Sun et al.’s works summarized several modeling techniques and found that a perfused-voxel model works better than 2-compartment based on Akaike’s information criterion [22] in a preclinical setting [23, 24].
In reality, however, accurate quantification of kPL depends not only on a reliable modeling strategy, but also a reproducible way to acquire HP 13C metabolite signals. Current efforts in kinetic modeling and parameter estimation have mainly focused on improving the quantification of pyruvate-to-lactate conversion a posteriori, in other words, after the HP data were acquired. Nevertheless, the pulse sequence design, including its components and parameters will inevitably modulate the detected pyruvate and lactate signal curves in vivo.
Successful HP-13C clinical trials require acquisition strategies offering volumetric coverage and high spatiotemporal resolution, combined with reliable kinetic modeling to provide accurate assessments of metabolism. The 3D dynamic compressed sensing EPSI (3D CS-EPSI) sequence constitutes the backbone of an ongoing phase II clinical study, as well as several prior preclinical works [8, 9, 25, 26]. It provides 8mm isotropic (0.5cc) coverage of full human prostate gland with 2s temporal resolution. A preclinical version of 3D CS-EPSI features double spin-echo (DSE) refocusing pulses for improved linewidth and phase characteristics, and was used in prior studies of mouse prostate cancer [8]. The DSE version introduces two adiabatic 180° pulses and the crusher gradients around the 180°s.
The motivation behind this study was to examine how sequence design and parameters impact quantification of cancer metabolism. Although some sequence effects have been individually studied before [27, 28], this is, to our knowledge, the first work that simultaneously investigates multiple sequence design components, using advanced kinetic modeling strategies to assess kPL. Each effect was studied individually by means of preclinical HP-13C cancer studies, model simulations and theoretical calculations. For the in vivo studies, several variants of the 3D CS-EPSI sequence were designed, including a pulse-and-acquire (FID) sequence, a DSE-enabled sequence, and 2 derivative sequences (FIDDelay and FIDDelay,Crush). Beyond the particular sequence designs in this study, the strategies proposed in this work may be useful toward investigating future pulse sequence designs and parameters for clinical translation with more reliable data acquisition and kPL quantification pipelines.
2. Methods:
Pulse sequences:
A 3D dynamic echo-planar spectroscopic imaging sequence with compressed-sensing (3D CS-EPSI) was applied to all animal and phantom acquisitions in this work [8, 25, 26]. The sequence is composed of a multiband spectral-spatial excitation, followed by an optional DSE refocusing, and then the 3D compressed sensing EPSI readout using random blip gradients in the x and y phase encoding directions (Fig.1).
Figure 1.
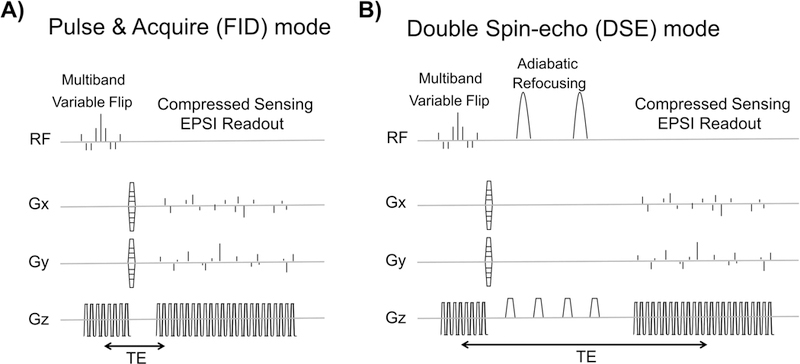
The A) FID and B) double-spin echo (DSE) mode of 3D dynamic compressed sensing EPSI sequence [25,26], as well as two modified version of FID mode, were used to investigate impact of the sequence design and parameter on quantitative kPL estimation.
The basic acquisition backbone in this study was an FID version of the sequence, as shown in Figure 1A. The compressed-sensing EPSI readout follows the RF excitation pulses by a minimal delay (TE/TR=8.9/150ms). Sequence parameters include FOV = 4×4×8.64 cm, spatial resolution = (in-plane) 3.3mm and (axial) 5.4mm, spectral resolution = 9.8Hz, bandwidth = 581Hz, temporal resolution = 2s, sequence length = 36s. The multiband spectral-spatial excitation pulse train has peak B1 = 1.796(G) and pulse width = 8.9(ms). Variable flip angles were independently generated for pyruvate and lactate, with the aim of distributing signal across the dynamic acquisition with high SNR. Pyruvate and lactate variable flip angles were designed with a “const-signal” approach, using kPL= 0.05(s−1) in Eqs. 7,8 and 9 from Xing et al.’s work [29]. This approach has been found to provide reproducible kPL estimates on murine cancer model [8].
DSE refocusing can be added to the FID sequence, as illustrated in Figure 1B. With the addition of DSE pulses [30], the echo time becomes TE = 150 (ms). The DSE configuration introduces several sequence components and parameter alternations, including adiabatic 180° pulses, crusher gradients around them, and a spin echo time TE.
To begin with, the adiabatic pulses may behave more like saturation pulses rather than refocusing pulses at the fringe field near the coil edge, as has previously been observed in animal imaging [28]. Since the B1+ field rolls off at coil edges, the adiabatic threshold is not satisfied there. Simulation was conducted to investigate this artifact, as described in the next section.
Secondly, the crusher gradients around the 180° pulses, which was intended to alleviate flip angle errors in the refocusing pulses, could in turn sensitize the sequence to flowing spins. This was investigated using FIDDelay and FIDDelay,Crush sequences (Fig.3A and 4A). FIDDelay,Crush sequence purposely introduces a bipolar gradient, which has the same parameter values as the spin-echo crusher gradients in the DSE acquisition (G=1G/cm on x,y,z, δ = 2ms, Δ = 11.8ms, Venc = 0.21m/s, b = 0.02s/mm2), therefore inducing the same flow and diffusion artifacts (Fig.3A, bottom). The echo time in the presence of the bipolar gradient was TE = 22.3 (ms). In contrast, FIDDelay (Fig.3A, top) does not have the bipolar gradient, but has an additional delay of tdelay = 13.4ms between RF excitation and echo. This gives FIDDelay the same TE as FIDDelay,Crush. While a prior study investigated crusher effects in vivo [27], the use of same TE in this study decouples crusher flow suppression from T2* signal modulations.
Figure 3.
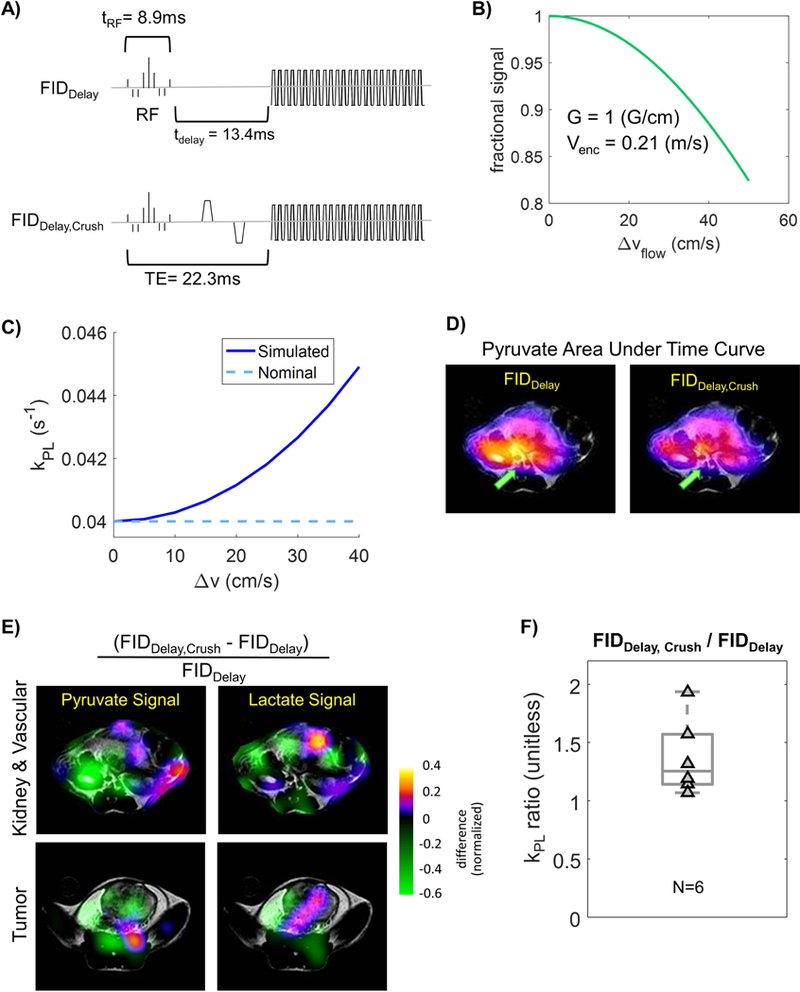
Simulated and experimental results testing the impact of crushers gradient (applied around DSE refocusing pulses) that can suppress flowing spins, which are predominately pyruvate. A) FID sequences with (FIDDelay,Crush) and without (FIDDelay) crusher gradients that were tested. B) Fraction of signal remaining with the given crusher gradient strength in A). C) Simulated kPL estimates increased with higher flow velocity, where more flowing spins were suppressed. D) Map of pyruvate area under curve. Spatially-dependent flow-suppression can be observed around the major vasculature. E) Crusher gradient-induced flow-suppression can be seen in signal ratio maps between FIDDelay,Crush and FIDDelay, where pyruvate saw stronger suppression around tumor, kidney and vasculature. F) The ratio was calculated kPL,FID-Delay,Crush / kPL,FID-Delay = 1.37 ± 0.33.
Figure 4.
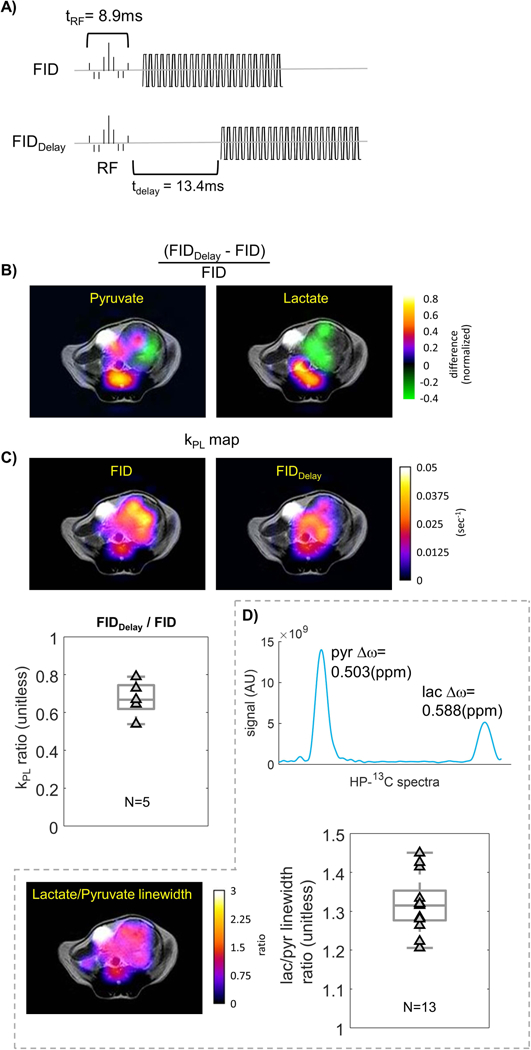
Evaluation of T2* image weighting on kPL. A) If lactate has a shorter T2* as shown previously, adding a delay to an FID sequence will reduce kPL. B) Ratio of pyruvate and lactate signal AUC in the same TRAMP tumor using FID versus FIDDelay sequences. The latter has substantially reduced lactate signals compared to pyruvate. C) kPL map of FID versus FIDDelay sequences. Ratio of kPL estimates in the same TRAMP tumor showing that adding a delay lowers kPL, where kPL,FID-Delay / kPL,FID = 0.67 ± 0.09. D) The in vivo lactate linewidth was broader than pyruvate, and thus lactate had a shorter T2*.
Finally, the intrinsic image weighting due to T2, and T2* can modulate both pyruvate and lactate signals with different TEs. To study image weighting, the FID-based sequence was applied, and TE was varied while keeping the remaining configuration and parameters the same. It is conveniently achieved by simply comparing the FID sequence which has the minimum echo time (Fig.4A, top, TE = 8.9ms), versus FIDDelay (Fig.3A, top, and 4A, bottom, TE = 22.3ms), where the latter effectively introduces a longer TE. The T2* image weighting will be reflected in the relative lactate-versus-pyruvate signal level. For instance, if lactate has a shorter T2*, FIDDelay should produce a lower lactate/pyruvate ratio than the FID sequence, and therefore lower kPL.
Dynamic Modeling and Simulations:
A standard two-site exchange model between pyruvate and lactate was applied to generate signal in all simulations in this study. This two-site exchange model accounts for pyruvate blood input using a Gamma-shaped arterial input function (AIF), as described by equation with parameters α = 3.3, β = 4.0. The hybrid continuous-discrete model is summarized in the following magnetization and signal equations.
and
where Mx[n] is the longitudinal magnetization of HP biomarker x, and the − and + superscripts mean before and after nth RF excitation, respectively. Sx is the signal, θn is the flip angle of nth RF excitation, ρ = 1/T1, and ktrans and kep are the forward and reverse perfusion/permeability coefficient, respectively. Lactate-to-pyruvate conversion coefficient kLP was assumed to be negligible and omitted, and kep was fixed to nominal value of 1200(ml/dL/min−1) to simplify model and to improve fitting reproducibility [8, 12].
To emulate the DSE-induced magnetization spoiling effect due to the B1 drop-off at transmit coil edges [28], the net magnetization loss was modeled as an effective decay constant TDSE that affects the pyruvate AIF curve MAIF(t) (Fig.1C). The range of TDSE was chosen to be 10–100(s) to simulate a spectrum of weak to strong spoiling effects. A lactate input function was not included in the modeling, assuming the majority of the blood flow through the coil edges consists of the pyruvate bolus that was injected through tail vein. This simplifies the model and allows for easier numerical analysis. The signal-generating model was the abovementioned two-site exchange model with MAIF(t) modulated by the TDSE loss on top of the intrinsic T1 relaxation. Nominal values of kPL = 0.04(s−1) and ktrans = 350(ml/dL·min−1) were selected, and the coefficients for gamma function were set to α = 3.3, β = 4.0 with bolus arrival time t0 = 5s from the beginning of injection, based on typical values previously observed on the same TRAMP tumor model [4, 12].
Two types of kinetic models were applied for the kPL fitting. The first type attempted to fit both the pyruvate and lactate signal evolution to the same two-site model as that of signal-generating equations, and assumed the AIF to be the gamma function with α = 3.3, β = 4.0, t0 = 5s. However, the fitting did not include any DSE-induced loss, namely TDSE →∞. The second type was an “inputless” fitting that assesses kPL only based on measured pyruvate and lactate signal evolution between timepoints, and does not make any assumptions about or fit an input function [15, 31, 32].
The next focus of this work is the flow suppression induced by crusher gradients. First, the percentage signal loss of flowing spins along the crusher direction can be approximated using equation
from Gordon et al [27], where m1 is the first gradient moment, and Δv is the velocity distribution in a given voxel.
In simulations, we define the loss percentage rcrusher = 1-|sinc(γm1Δv/2)|. It was assumed that the majority of flowing spins are pyruvate in the tumor microvasculature and interstitial space, and thus the pyruvate signal Spyr(t) was scaled by (1- rcrusher) for each TR. Similar to what was done in the previous simulation scenario, the simulation signal was fit assuming the absence of the effect of interest (i.e. without crushing). Therefore, it can be calculated how crusher gradients suppress flowing spins, and how such signal loss affects kPL quantification.
The third focus is the intrinsic image weightings. Expected signal calculations were done with the differential T2* between pyruvate and lactate based on prior estimates [33, 34]. The reported in vivo T2* values for pyruvate and lactate are approximately equal to 50(ms) and 25(ms), respectively. In the calculations, it was assumed that T1=30(s).
All the signal fitting, including the in vivo and simulation-generated data, was done using nonlinear least-squares method with the trust-region-reflective algorithm. The inputless fitting was applied for in vivo data. The RF excitations θn, as well as the T1 relaxation were taken into account. T1 relaxation was assumed to be equal for pyruvate and lactate for simplicity and to stabilize the fit.
MRI Experiments:
MRI imaging studies were conducted on twelve transgenic prostate cancer (TRAMP) mice in this work. The TRAMP mice were generated in C57BL/6 x FVB strain background with SV40 T-antigen expression [35]. During imaging studies, the mice were anesthetized using 1–1.5% isoflurane/100% oxygen at flow rate of 1L/min, and a heated water bed was applied to maintain normal body temperature. A 32-gauge catheter was placed in the tail vein of the subject mice for injection of hyperpolarized bolus. All animal studies and handling were conducted in compliance with an approved protocol under the regulations of the Institutional Animal Care and Use Committee (IACUC) at University of California, San Francisco.
[1-13C]pyruvic acid was polarized in either a 3.35T SpinLab polarizer (GE Healthcare, Waukesha WI) or a Hypersense polarizer (Oxford Instruments, UK) for 1–2 hours, yielding 80mM pyruvate solution with 20–35% polarization [36]. The dissolved pyruvate, neutralized using sodium hydroxide solution of concentration 0.72M (Spinlab) or 80mM (Hypersense), was at pH = 7.0±0.5. After dissolution, 500ul of pyruvate solution was manually injected into the established tail vein catheter over 15 seconds, such that around 350ul of pyruvate solution entered the subject mouse.
The 36s-long acquisition started immediately after the end of injection. For the crusher-induced flow-suppression study (Fig.3), HP-13C images were acquired using either the FIDDelay or FIDDelay,Crush sequence in a set of back-to-back studies. For the intrinsic T2* weighting study (Fig.4), images were acquired using either the FID or FIDDelay sequence. Finally, the DSE and FID sequences were compared in a similar fashion. In all the back-to-back comparison studies, interval between injections were 15–20 minutes.
The MRI scans were performed using a commercial 3T MR scanner (MR750, GE Healthcare, Waukesha, WI) using a custom-built 1H/13C dual-tuned mouse coil. Anatomical 1H reference images were acquired using a T2-weighted fast spin-echo (T2-FSE) sequence. Scanning parameters for the T2-FSE sequence included spatial resolution = 0.23mm, slice thickness = 2mm, FOV = 6 cm, TE/TR = 102/5821 ms.
Data Analysis:
The compressed sensing reconstruction was implemented in MATLAB (Mathworks, Nattick MA). MRI images were examined and analyzed using the open-source SIVIC package [37] and MATLAB. The tumor region of interest (ROI) was determined based on T2-FSE images, where only the voxels that had > 85% area of tumor were selected for quantification of HP-13C signal evolution and kPL estimation.
Peak location and area of each metabolite were evaluated using the peak fitting algorithm as previously described [8]. Area under the spectral peak was measured as the signal value at each time point since it is less susceptible to noise compared to spectral peak height. Pyruvate and lactate linewidths were estimated using full-width-half-maximum.
The pyruvate or lactate signals used to calculate the ratio diagrams (Figures 3E and 4B) were normalized to total carbon across the animal summed over time in each injection. These ratiometric figures were designed to show the relative spatial distribution of signal changes, but are not quantitative due to variations in polarization, delivery, and pulse sequence effects.
The statistical analysis for kPL values was conducted using the Mann-Whitney-Wilcoxon test, where significance was determined based on P-values.
3. Results:
In all the back-to-back injection studies, the order of study was randomized and no difference was found in outcomes regardless of the order. The kPL findings from in vivo experiments in this study is summarized in Table I.
Table I.
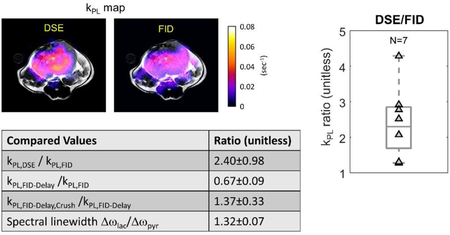
This table briefly summarizes all the in vivo comparisons made, in order to investigate the effects of crusher gradient-induced flow suppression and image weighting that can affect kPL estimation.
| Compared Values | Ratio (unitless) |
|---|---|
| kPL,DSE / kPL,FID | 2.40±0.98 |
| kPL,FID-Delay /kPL,FID | 0.67±0.09 |
| kPL,FID-Delay,Crush /kPL,FID-Delay | 1.37±0.33 |
| Spectral linewidth Δωlac/Δωpyr | 1.32±0.07 |
Spin-Echo Pulse Magnetization Spoiling:
In simulation, the spoiling was modeled as magnetization loss in the blood pyruvate pool with a time constant TDSE. As shown in Figure 2B, the blood pyruvate pool suffers from increasingly more magnetization loss with the increasing DSE spoiling from weak (TDSE = 100s) to strong (TDSE = 10s). The magnetization loss manifested as a change in amplitude, shape and duration of the AIF signal curve since the beginning of acquisition (t=0), and this subsequently affected the signal evolution of both pyruvate and lactate in the tumor compartment, which the blood pool supplies.
Figure 2.
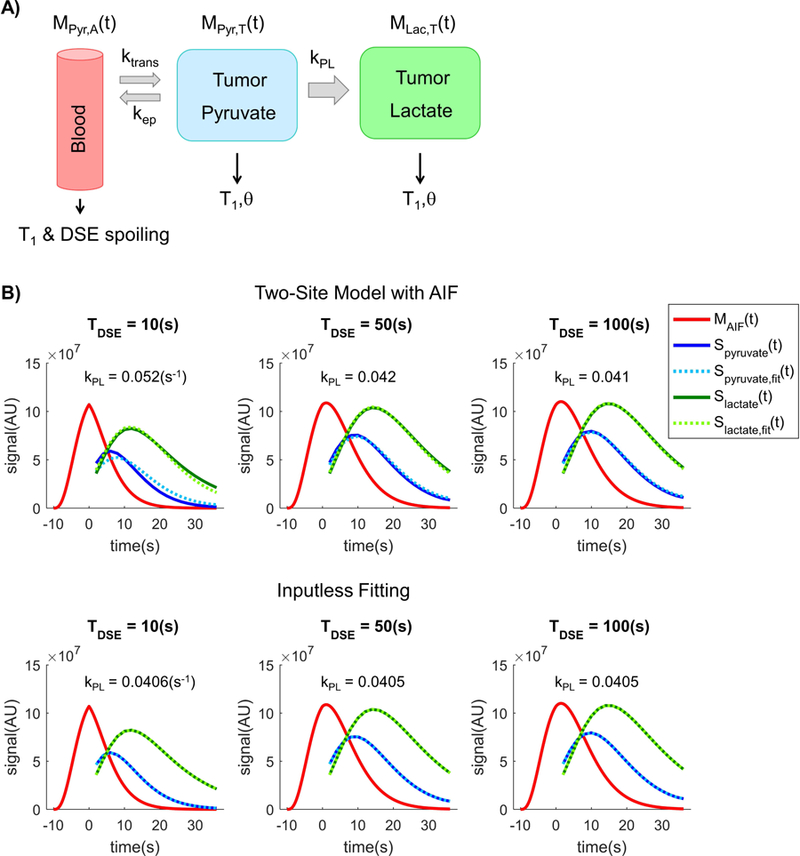
A) A two-site exchange model that includes pyruvate vascular input was applied for the simulation of spin-echo RF spoiling effects. Spoiling was modeled as magnetization loss in the input function Mpyr,A(t) with equivalent decay factor TDSE. B) With stronger DSE spoiling (i.e. a shorter time constant), the pyruvate signal decays more rapidly than expected. This leads to poor pyruvate fits and overestimation of kPL if a fixed AIF is used, which can be eliminated with an inputless fitting that makes no assumptions about the AIF [15,28]. Note that MAIF(t) is the AIF magnetization curve, while Sx(t) is the signal curve for metabolite x. In fact, the magnetization and signal curves have independent scaling and were only plotted together for illustration purposes.
Figure 2B illustrates the signal evolution curves, where the top figure shows the pyruvate and lactate signal curves fit to a two-site model. As opposed to the signal-generation model, the fitting model uses the original, unspoiled AIF. In the presence of a strong spoiling with equivalent time constant TDSE = 10s, the estimated kPL value from the fit was kPL = 0.055(s−1), a 37% error compared to the nominal value of 0.04(s−1) from the signal-generation model. As the DSE spoiling effect decreases (that is, increase of TDSE), the estimated kPL decreases asymptotically toward the nominal value just as anticipated.
The inputless fitting (Fig.2B bottom) does not use any a priori knowledge or model to emulate the AIF, but instead takes the observed pyruvate and lactate magnetization at each time point to evaluate the real-time conversion rate. At TDSE = 10(s), the fit gives kPL = 0.0405(s−1), or about 1.25% error, substantially lower than that from the two-site model assuming the original AIF.
Crusher-induced Flow Suppression:
Simulation results in Figure 3B show the fraction of transverse magnetization being quenched by crusher gradients given a typical variability range of in vivo flow velocities. For a flow velocity distribution Δv = 30 (cm/s), about 10% of the flowing spins should be suppressed by the standard crusher gradients around the DSE pulses.
Simulated kPL against Δv is shown in Figure 3C. The net pyruvate signal loss in tumor was taken from the simulation in Figure 3B. Assuming Δv=30 (cm/s) along the crusher direction, the signal model fitting yielded kPL,fit = 0.043(s−1), or 6.7% error versus the nominal kPL,signal-generation = 0.04(s−1), whereas Δv=40 (cm/s) produces 12.5% error (kPL,fit = 0.045 s−1).
Figure 3D shows pyruvate area under curve (AUC) maps acquired using FIDDelay (bipolar gradient off) versus FIDDelay,Crush (gradient on). Comparing the images, flow-suppression effect is most pronounced at the vascular and renal regions, as highlighted by the green arrow.
The normalized signal ratio maps between FIDDelay versus FIDDelay,Crush for pyruvate and lactate also highlight flow-suppression effects. These can be identified on the pyruvate ratio map at the kidney and tumor regions (Fig.3E), where images acquired using FIDDelay,crush produced relatively lower pyruvate signal. On the other hand, the flow-suppression was much less pronounced on the lactate ratio map for either the kidney/vasculature or the tumor region.
In the prostate tumors, kPL was evaluated and compared between FIDDelay and FIDDelay,Crush for six animals. kPL,FID-Delay,Crush / kPL,FID-Delay was calculated as 1.37 ± 0.33 (Fig.3D, N = 6, P<0.01). This indicated that the crusher-induced flow suppression significantly affected kPL estimation. Sensitivity of ktrans to double spin-echo and crusher flow suppression can be found in the simulation depicted in Supplemental Figure 1. Example kPL fits can be found in Supplemental Figure 2.
Intrinsic Image Weighting with Focus on T2*:
Based on theoretical calculations, the differential T2* (~50ms for pyruvate and ~25ms for lactate) would, theoretically, create 23.5% extra loss of pyruvate transverse magnetization, and 36.0% that of lactate in FIDDelay relative to FID, due to the additional delay of tdelay = 13.4ms. In other words, the shorter lactate T2* creates 12.5% more lactate loss relative to pyruvate in FIDDelay versus the FID sequence.
In Figure 4B, the normalized signal ratio maps between FIDDelay and FID sequences were illustrated in a TRAMP tumor for pyruvate and lactate, respectively. Both the pyruvate and lactate maps showed considerable spatial inhomogeneity within the prostate tumor and in the vasculature adjacent to the tumor. Figure 4C shows the estimated maps of kPL using the same datasets as Figure 4B. The right anterior (from the image perspective) of the tumor had higher pyruvate ratio, but relatively low lactate ratio. This was reflected on the kPL map as substantially lower kPL over the right anterior region in the FIDDelay map (<0.01 s−1) versus the FID map (~0.035 s−1). On the other hand, the left posterior of the tumor had comparable pyruvate and lactate ratios in Figure 4B. As a result, the estimated kPL was also comparable in the FIDDelay versus FID kPL maps (~0.025 s−1) in the left posterior region. The change of contrast between the two kPL maps suggests local variabilities of pyruvate and lactate T2*’s in vivo.
When an average was taken across the entire tumor, the FIDDelay sequence generated overall lower kPL estimates compared to the FID (N=5). The kPL ratio was kPL,FID-Delay / kPL,FID = 0.67 ± 0.09 (Fig.4C right, P<0.01). This outcome indicated that lactate has, on average, shorter T2* than pyruvate over the tumor region.
A typical spectrum extracted from tumor regions using the FID acquisition is shown in Figure 4D. From the spectrum, one can also observe that lactate has generally a broader linewidth compared to pyruvate, another piece of evidence that supports the shorter lactate T2*. Examining N=13 sets of data acquired using the FID sequence revealed that the linewidth ratio of pyruvate versus lactate was Δωlactate/Δωpyruvate = 1.32 ± 0.07 (P<0.00001, N=13). The measured linewidth of pyruvate and lactate translated to T2*pyr = 21.1 ± 1.2(ms) and T2*lac = 16.0 ± 2.1(ms), respectively.
FID vs DSE Mode Acquisition:
In the studies conducted on 7 TRAMP mice, the kPL ratio was calculated as kPL,DSE/kPL,FID = 2.40±0.98 (Fig.5A, P<0.0001). A sample kPL map (Fig.5C) also shows generally higher kPL,DSE versus kPL,FID over the tumor region, consistent with the statistical kPL outcomes from the N=7 studies. Significantly higher lactate SNR was also found in the DSE versus FID sequence (Supplemental Figure 3, SNRDSE,lac / SNRFID,lac = 2.15 ± 1.01, P<0.001), while pyruvate SNR was comparable (SNRDSE,pyr / SNRFID,pyr = 1.06 ± 0.88, P=0.09) between the two.
Figure 5.
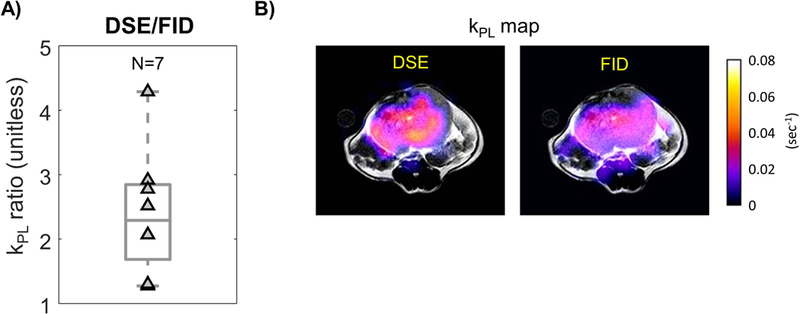
A) Increased tumor kPL estimates were found using DSE versus FID sequences. For each pair of data, the hyperpolarized study was conducted back-to-back using the same TRAMP mouse. B) The DSE sequence gives higher kPL estimates across this example TRAMP tumor.
4. Discussion:
Spin-Echo Pulse Magnetization Spoiling
The DSE-induced AIF spoiling happens in the transmit RF coil fringe fields. In our mouse setup, this is primarily occurring in the mouse tail vein, while in typical patient setups this will occur at the edge of the coil. In the presence of spoiling, a conventional two-site exchange model kPL fit using an unspoiled AIF leads to errors as large as 37% (with TDSE = 10s), since the additional loss of pyruvate signal induces deviation from the assumed AIF (Fig.2).
One approach for mitigating this error is to physically apply an RF shield, as suggested by von Morze et al [38], who showed that the inflowing spins can be sheltered from RF pulses using aluminum shielding on tail vein. Another approach is to use the inputless kinetic modeling that disregards the AIF, and estimates kPL only based on the real-time pyruvate and lactate signals. This substantially reduced the AIF-related errors. (~1% error with TDSE = 10s). Yet another option is to use slice-selective refocusing pulses to control the fringe field region [39].
To date, the DSE refocusing pulses have yet to be applied in human studies. Our current clinical prostate 13C MR excite coil [40] cannot support adiabatic pulses with wide enough bandwidths due to peak RF power and RF duty cycle constraints, as well as B1 inhomogeneities that could lead to violations of the adiabatic condition. Nevertheless, in the general sense, any RF pulse such as an excitation pulse could still induce undesired magnetization loss that may not be observed, for example if it hits a major blood vessel outside the imaging FOV. As a case in point, spoiling could occur if the antecubital injection site on the patient’s arm is near a high-power region of the RF coil, and may go unnoticed when imaging a FOV focused on the prostate.
Crusher-induced Flow Suppression
The signal loss due to the crusher gradients is determined by the dispersion of flow velocities Δv across a given voxel along the gradient direction. Higher Δv induces more signal loss, and Δv is often proportional to the vector flow velocity. The signal loss is not only a function of the perfusion/permeability coefficient ktrans, but also depends on the fraction of extracellular extravascular space ve. The former dictates the shape and maximum enhancement of the pyruvate magnetization curve in tumor MPyr,T(t). The latter is strongly associated with Δv, where flowing spins are predominantly vascular and interstitial, and static spins are mainly from cellular uptake.
Our results showed substantial pyruvate signal loss with crusher gradients near the tumor (Figure 3E), inferior vena cava, and kidneys (Figure 3D). The vena cava and kidneys are known to have high pyruvate Δv due to strong perfusion. Within the TRAMP tumors, pathology and pharmacokinetics could explain the increased kPL (Figure 3F): As the tumor undergo angiogenesis, the formation of leaky microvasculature could create an irregular blood flow pattern that results in a wide spectrum of Δv, leading to preferential suppression of pyruvate since it has a larger vascular fraction than lactate as suggested by prior reports. Since angiogenesis is a hallmark of cancer, analogous phenomena need to be considered in patient studies [41, 42]. For instance, if a measured AIF is to be extracted for modeling, differential flow suppression between tumor versus blood may impact the accuracy of kPL estimation [13, 14, 43, 44].
While both DSE magnetization spoiling and crusher-induced flow suppression seemingly increase kPL artificially by reducing pyruvate signal, there are a few fundamental differences. In general, RF spoiling, including DSE spoiling, acts on longitudinal magnetization, creating an effective loss similar to T1 relaxation. This creates signal modulations in the tumor that is a direct consequence of the magnetization loss from AIF. The crusher gradients, on the other hand, create a transverse signal loss similar to T2*. This independently modulates AIF and tumor signals as a function of flow velocity distribution. Therefore, the magnetization spoiling of the AIF depends on the RF pulses seen by the inflowing HP spins through major arteries, while the signal loss due to crusher-induced flow suppression is a function of the distribution of spin vector velocities within any given voxel. Another interesting factor to explore in the future is how the blood lactate pool interacts with the pulse sequences, and how that affects kPL estimation [14].
T2* Image Weighting
In hyperpolarized acquisition scenarios, image weighting/contrast in a given voxel is dictated by local T2 and T2*. The outcomes of this study indicated that longer TE in the FID scheme decreases the lactate signal relative to pyruvate, and therefore giving a lower apparent kPL. Along with the broader linewidth of the lactate peak, these findings suggested that lactate has shorter T2* than pyruvate. This could be due to J-coupling of lactate [33, 34]. While the theoretical calculations in the Results section assumed that T2 and T2* were constant over time, in reality T2 and T2* can be both spatially and temporally dependent based on the intra-voxel distribution and voxel content.
From Figure 4C, it is also interesting to note that TE changes spatial variations in the kPL map in addition to changing the average kPL values. The altered relative contrast reflects heterogeneity of in vivo T2* in different tumor regions. This could result from a heterogeneous microenvironment, with differences in cellularity, vascular density and leakage, ve [45, 46], and also the presence of metal ions or paramagnetic molecules that creates relaxation pathways [47, 48]. As human prostate cancer is known to be biochemically and pathologically heterogeneous, the differential HP-13C T2* can potentially act as molecular signatures of tumor microenvironment.
FID vs DSE Sequences
We observed ~2-fold increases in lactate SNR in DSE compared to FID. Meanwhile, we also observed ~2-fold increased kPL estimates with DSE compared to FID. The expected differences in this comparison are spin-echo spoiling, crusher gradient flow suppression, and T2 image weighting. Since an inputless model was used, the spin-echo spoiling is expected to make no difference. The crusher gradients in the DSE sequence lead to relative loss of pyruvate signal in tumor, thereby expected to increase kPL estimates. Finally, the DSE sequence is T2-weighted and has echo time of TE = 150ms, whereas the FID sequence has a small amount of T2*-weighting at a relatively short echo time (TE = 8.9 ms).
Our FID TE experiments showed that T2*-weighting leads to decreased tumor kPL. However, the DSE, which was T2-weighted, had a significantly higher tumor kPL versus FID. Overall, this ~2-fold increase of the DSE kPL is more than can be explained by our RF spoiling simulations (no significant difference with inputless model), crusher flow suppression (1.1-fold increase in kPL) or differences in transverse relaxation times (1.4-fold increase assuming equal T2 in simulations). This strongly suggests that T2* and T2 do not have the same effect on kPL, and likely they have an opposite effect on kPL. Based on this, we posit that in this prostate tumor model, lactate is likely to have a longer or equal T2 than pyruvate. This is supported by prior studies [6, 13] of in vivo T2 values, that reported pyruvate T2 with short component = 0.12s, long component = 0.54s, whereas lactate had short component = 0.13s, medium = 0.75s, and long = 2.2s, respectively. Assuming these components contribute equally to the signals, pyruvate would suffer from 30.8% more signal loss compared to lactate at TEDSE = 150ms, which would lead to increased kPL as was observed. Also, it is worth noting that the in vivo T2 values reported varied between tissue and tumor types.
Potential Strategies for Robust Acquisition
The results of this paper can be used to inform on differences between imaging sequences being applied in HP-13C clinical studies.
While a few prior works studied how some individual pulse sequence factors (e.g. double-spin echo) affects HP-13C signal evolutions in generic terms, none have addressed the pulse sequence considerations in the context of the translational need to quantitatively model pyruvate-to-lactate metabolism that may potentially differentiate clinically aggressive vs indolent cancer.
The findings of this work indicated that pulse sequence design can significantly impact the accuracy of kPL measurements when using advanced clinical acquisition and kinetic modeling techniques. From this perspective, we recommend rigorous reporting of pulse sequence design and parameters in future clinical trial and preclinical studies since kPL estimations can be affected by the acquisition factors discussed above. Our recommendations include whether a spin-echo was applied, the echo time (TE), and crusher gradients parameters such as b-value, because this study found that all of these factors can affect the estimated apparent rate constant and its spatial distribution. This will facilitate interpretation of kPL measurements between studies with different acquisition strategies.
Using DSE has the potential to improve lactate SNR, which is important for patient studies where lactate is often the SNR-limiting factor. For instance, in prostate cancer imaging the mean pyruvate SNR over time was reported around 45, whereas lactate approximately 6 [9]. Hence, it might be beneficial to utilize the relatively long lactate T2 (as opposed to short T2*) with spin-echo refocusing to enhance lactate SNR for more reliable quantification. For clinical studies, this requires clinical 13C MR coils with sufficient max power and B1 homogeneity, such as a whole body 1H-13C dual-tuned coil [49] or a human-brain birdcage transmitter [50] to support spin-echoes, in addition to efficient RF pulse designs. When using spin-echo refocusing, care should be taken to mitigate RF spoiling [28]. Even though the inputless kinetic is robust to spoiling, this effect still reduces total SNR. One solution is to delay the start of acquisition until bolus clearance from arteries. Appealing alternative to DSE are the balanced steady-state free precession (bSSFP) sequences [51, 52] that can also exploit long T1 and T2 to improve lactate SNR.
From the measurements in this study, an additional 13.4 ms elongation in TE caused significant lactate signal loss relative to pyruvate that led to 33% reduction in kPL. This makes the minimization of T2* loss a key pulse design parameter for FID sequences especially when lactate is SNR-limited.
The T2* weighting varies across sequences: IDEAL spiral CSI [53] has short TE, since no spectral-spatial excitation is required and the spiral readout starts at the center of k-space. The 3D EPSI used in our phase II prostate cancer study also has short TE because it uses short spectral-spatial RF pulses (4.1ms) with relaxed flip angle constraints on irrelevant resonances [9]. These sequences offer minimized T2* losses. On the other hand, metabolite-specific imaging sequences [54, 55] might be more susceptible to T2* relaxation, as a longer spectral-spatial pulse is required to attain spectral selectivity for a single metabolite. EPI has a longer TE compared to spiral readouts, although it can be reduced through use of partial Fourier acquisitions [55]. Within a specific acquisition scheme and pulse sequence, one should keep the echo time and readout minimum to mitigate the T2* losses. For instance, a sequence designer should heavily consider the total TE when attempting a large-TBW pulse for spectral or spatial selectivity in FID sequences.
Overall, a T2-weighted sequence exploiting the long T2 of lactate (spin-echo or bSSFP) may be favored versus a T2*-weighted sequence whenever hardware supports. On top of alleviating T2* losses, the relatively longer lactate T2 provides additional lactate SNR benefit without pyruvate SNR loss. Among the FID sequences, ones that are less demanding on RF selectivity may have precedence over metabolite-specific acquisitions due to the shorter TE.
Potential Strategies for Robust Quantification
A challenge for robust quantification is that numerous constituents participate in the formulation of the apparent rate coefficient kPL. First and foremost, the LDH-mediated pyruvate-to-lactate conversion is presumed to be the primary factor contributing to kPL,. Secondly, the pharmacokinetic behavior in vivo, known to closely affiliate with the tumor microenvironment, can also affect kPL measurements. Thirdly, the HP-13C imaging exam parameters, including acquisition strategies discussed in this paper, can also modulate the quantification of kPL. This is a good example of the observer effect [56], where interrogating the HP-13C magnetization using RF pulses and gradients alters the HP-13C magnetization from its intrinsic behavior.
Ideally, the LDH-mediated conversion, pharmacokinetics, and exam parameters can be separated when estimating kPL, and a reliable kPL measurement should be independent of the last. Using an inputless modeling strategy can accurately estimate kPL even with DSE (or generally RF) spoiling of the AIF, while models that rely on the AIF may give errors. Correction for crusher-induced flow suppression will require either knowledge or an estimate of Δv, and potentially also ktrans and ve based on models. To evaluate the differential crusher suppression between microvascular versus interstitial/intracellular pool of pyruvate, one potential solution is to utilize the two-compartment two-site exchange model proposed by Bankson et al. [23] that aims to discriminate circulating and static HP-13C spins. This once again highlights the importance of rigorously reporting parameters such as b-value in the presence of crusher gradients. At this stage, it appears that existing kinetic models do not adequately account for T2 or T2* weightings. One option is to estimate relaxation times using the HP-13C T1 and T2 mapping methods based on bSSFP [47, 52].
Generally speaking, the amount of a priori knowledge about the tissue properties and pharmacokinetic behaviors still imposes a limit on model performance. Akaike’s information criteria serves as a good benchmark to determine if additional factors will benefit the model/fit based on in vivo data [22].
Summary
Through in vivo studies of mice with transgenic tumor, model simulations and theoretical deductions, this study investigated how HP-13C MR acquisition methods can affect the calculation of kPL. This included higher apparent kPL due to RF magnetization spoiling and crusher-induced signal loss, and also effects of intrinsic T2/T2* weighting on kPL calculations. Just as importantly, this study established a way to explore sequence-specific effects on quantification of cancer metabolism, which are important to benefit ongoing and future clinical and preclinical studies.
The findings of this study indicated that an optimal pulse sequence design is equally important as robust data processing and kinetic modeling methodologies. A key observation is that the quantitative impact of data acquisition on kPL not only depends on the pulse sequence per se, but the interaction between the sequence, pharmacokinetic behavior and tissue microenvironment. The outcomes also provided insight into potential solutions and strategies that may minimize the impact of systematic artifacts from pulse sequences, and therefore making kPL a reliable measure that is robust to the offsets and errors introduced by the acquisition process.
5. Conclusions:
Using a 3D dynamic MRSI sequence applied in clinical/preclinical studies along with advanced kinetic modeling techniques, this work explored how sequence components and parameters impact kPL quantification in cancer. For ongoing and future patient and preclinical studies, development of both robust data acquisition and analysis strategies will be the key toward reliable measures that reflects the true underlying cancer metabolism.
Supplementary Material
Acknowledgements:
This work was supported by grants from the NIH (R01EB017449, R01EB013427, R01CA166655, R01EB016741, and P41EB013598). We would like to thank Ms. Romelyn Delos Santos for her assistance in performing the studies. We would also like to thank Dr. Barb Foster and colleagues at Roswell Cancer Institute, Buffalo, NY, for supplying the TRAMP mice used in this study.
Abbreviations:
- HP-13C
hyperpolarized 13C
- kPL
pyruvate-to-lactate conversion rate
- AIF
arterial input function
- TRAMP
transgenic mouse model of prostate cancer
- DSE
double spin-echo
6. References:
- [1].Timm KN, Kennedy BW, Brindle KM. Imaging Tumor Metabolism to Assess Disease Progression and Treatment Response. Clin Cancer Res 2016;22(21):5196–203. [DOI] [PMC free article] [PubMed] [Google Scholar]
- [2].Ardenkjaer-Larsen JH, Fridlund B, Gram A, Hansson G, Hansson L, Lerche MH, et al. Increase in signal-to-noise ratio of > 10,000 times in liquid-state NMR. Proc Natl Acad Sci U S A 2003;100(18):10158–63. [DOI] [PMC free article] [PubMed] [Google Scholar]
- [3].Golman K, in ‘t Zandt R, Thaning M. Real-time metabolic imaging. Proc Natl Acad Sci U S A 2006;103(30):11270–5. [DOI] [PMC free article] [PubMed] [Google Scholar]
- [4].von Morze C, Bok RA, Reed GD, Ardenkjaer-Larsen JH, Kurhanewicz J, Vigneron DB. Simultaneous Multiagent Hyperpolarized C-13 Perfusion Imaging. Magn Reson Med 2014;72(6):1599–609. [DOI] [PMC free article] [PubMed] [Google Scholar]
- [5].Albers MJ, Bok R, Chen AP, Cunningham CH, Zierhut ML, Zhang VY, et al. Hyperpolarized 13C lactate, pyruvate, and alanine: noninvasive biomarkers for prostate cancer detection and grading. Cancer Res 2008;68(20):8607–15. [DOI] [PMC free article] [PubMed] [Google Scholar]
- [6].Kettunen MI, Hu DE, Witney TH, McLaughlin R, Gallagher FA, Bohndiek SE, et al. Magnetization Transfer Measurements of Exchange Between Hyperpolarized [1-C-13]Pyruvate and [1-C-13]Lactate in a Murine Lymphoma. Magn Reson Med 2010;63(4):872–80. [DOI] [PubMed] [Google Scholar]
- [7].Kurhanewicz J, Vigneron DB, Brindle K, Chekmenev EY, Comment A, Cunningham CH, et al. Analysis of cancer metabolism by imaging hyperpolarized nuclei: prospects for translation to clinical research. Neoplasia 2011;13(2):81–97. [DOI] [PMC free article] [PubMed] [Google Scholar]
- [8].Chen HY, Larson PEZ, Bok RA, von Morze C, Sriram R, Delos Santos R, et al. Assessing Prostate Cancer Aggressiveness with Hyperpolarized Dual-Agent 3D Dynamic Imaging of Metabolism and Perfusion. Cancer Res 2017;77(12):3207–16. [DOI] [PMC free article] [PubMed] [Google Scholar]
- [9].Chen HY, Larson PEZ, Gordon JW, Bok RA, Ferrone M, van Criekinge M, et al. Technique development of 3D dynamic CS-EPSI for hyperpolarized (13) C pyruvate MR molecular imaging of human prostate cancer. Magn Reson Med 2018. [DOI] [PMC free article] [PubMed]
- [10].Aggarwal R, Vigneron DB, Kurhanewicz J. Hyperpolarized 1-[(13)C]-Pyruvate Magnetic Resonance Imaging Detects an Early Metabolic Response to Androgen Ablation Therapy in Prostate Cancer. Eur Urol 2017;72(6):1028–9. [DOI] [PMC free article] [PubMed] [Google Scholar]
- [11].Park I, Larson PE, Gordon JW, Carvajal L, Chen HY, Bok R, et al. Development of methods and feasibility of using hyperpolarized carbon‐13 imaging data for evaluating brain metabolism in patient studies. Magn Reson Med 2018. [DOI] [PMC free article] [PubMed]
- [12].von Morze C, Larson PEZ, Hu S, Keshari K, Wilson DM, Ardenkjaer-Larsen JH, et al. Imaging of Blood Flow Using Hyperpolarized [C-13] Urea in Preclinical Cancer Models. J Magn Reson Imaging 2011;33(3):692–7. [DOI] [PMC free article] [PubMed] [Google Scholar]
- [13].Kettunen MI, Kennedy BW, Hu DE, Brindle KM. Spin echo measurements of the extravasation and tumor cell uptake of hyperpolarized [1-(13) C]lactate and [1-(13) C]pyruvate. Magn Reson Med 2013;70(5):1200–9. [DOI] [PubMed] [Google Scholar]
- [14].Serrao EM, Kettunen MI, Rodrigues TB, Lewis DY, Gallagher FA, Hu DE, et al. Analysis of (13) C and (14) C labeling in pyruvate and lactate in tumor and blood of lymphoma-bearing mice injected with (13) C- and (14) C-labeled pyruvate. NMR Biomed 2018. [DOI] [PMC free article] [PubMed]
- [15].Kazan SM, Reynolds S, Kennerley A, Wholey E, Bluff JE, Berwick J, et al. Kinetic modeling of hyperpolarized (13)C pyruvate metabolism in tumors using a measured arterial input function. Magn Reson Med 2013;70(4):943–53. [DOI] [PubMed] [Google Scholar]
- [16].Harrison C, Yang C, Jindal A, DeBerardinis RJ, Hooshyar MA, Merritt M, et al. Comparison of kinetic models for analysis of pyruvate-to-lactate exchange by hyperpolarized 13 C NMR. NMR Biomed 2012;25(11):1286–94. [DOI] [PMC free article] [PubMed] [Google Scholar]
- [17].Zierhut ML, Yen YF, Chen AP, Bok R, Albers MJ, Zhang V, et al. Kinetic modeling of hyperpolarized 13C1-pyruvate metabolism in normal rats and TRAMP mice. J Magn Reson 2010;202(1):85–92. [DOI] [PMC free article] [PubMed] [Google Scholar]
- [18].Bahrami N, Swisher CL, Von Morze C, Vigneron DB, Larson PE. Kinetic and perfusion modeling of hyperpolarized (13)C pyruvate and urea in cancer with arbitrary RF flip angles. Quant Imaging Med Surg 2014;4(1):24–32. [DOI] [PMC free article] [PubMed] [Google Scholar]
- [19].Day SE, Kettunen MI, Gallagher FA, Hu DE, Lerche M, Wolber J, et al. Detecting tumor response to treatment using hyperpolarized C-13 magnetic resonance imaging and spectroscopy (vol 13, pg 1382, 2007). Nat Med 2007;13(12):1521–. [DOI] [PubMed] [Google Scholar]
- [20].Daniels CJ, McLean MA, Schulte RF, Robb FJ, Gill AB, McGlashan N, et al. A comparison of quantitative methods for clinical imaging with hyperpolarized C-13-pyruvate. NMR Biomed 2016;29(4):387–99. [DOI] [PMC free article] [PubMed] [Google Scholar]
- [21].Hill DK, Orton MR, Mariotti E, Boult JKR, Panek R, Jafar M, et al. Model Free Approach to Kinetic Analysis of Real-Time Hyperpolarized C-13 Magnetic Resonance Spectroscopy Data. PLoS One 2013;8(9). [DOI] [PMC free article] [PubMed] [Google Scholar]
- [22].Akaike H A new look at the statistical model identification. IEEE transactions on automatic control 1974;19(6):716–23. [Google Scholar]
- [23].Bankson JA, Walker CM, Ramirez MS, Stefan W, Fuentes D, Merritt ME, et al. Kinetic Modeling and Constrained Reconstruction of Hyperpolarized [1–13C]-Pyruvate Offers Improved Metabolic Imaging of Tumors. Cancer Res 2015;75(22):4708–17. [DOI] [PMC free article] [PubMed] [Google Scholar]
- [24].Sun CY, Walker CM, Michel KA, Venkatesan AM, Lai SY, Bankson JA. Influence of parameter accuracy on pharmacokinetic analysis of hyperpolarized pyruvate. Magn Reson Med 2017. [DOI] [PMC free article] [PubMed]
- [25].Hu S, Lustig M, Balakrishnan A, Larson PE, Bok R, Kurhanewicz J, et al. 3D compressed sensing for highly accelerated hyperpolarized (13)C MRSI with in vivo applications to transgenic mouse models of cancer. Magn Reson Med 2010;63(2):312–21. [DOI] [PMC free article] [PubMed] [Google Scholar]
- [26].Larson PE, Hu S, Lustig M, Kerr AB, Nelson SJ, Kurhanewicz J, et al. Fast dynamic 3D MR spectroscopic imaging with compressed sensing and multiband excitation pulses for hyperpolarized 13C studies. Magn Reson Med 2011;65(3):610–9. [DOI] [PMC free article] [PubMed] [Google Scholar]
- [27].Gordon JW, Niles DJ, Adamson EB, Johnson KM, Fain SB. Application of flow sensitive gradients for improved measures of metabolism using hyperpolarized (13) c MRI. Magn Reson Med 2016;75(3):1242–8. [DOI] [PMC free article] [PubMed] [Google Scholar]
- [28].Josan S, Yen YF, Hurd R, Pfefferbaum A, Spielman D, Mayer D. Application of double spin echo spiral chemical shift imaging to rapid metabolic mapping of hyperpolarized [1-(1)(3)C]-pyruvate. J Magn Reson 2011;209(2):332–6. [DOI] [PMC free article] [PubMed] [Google Scholar]
- [29].Xing Y, Reed GD, Pauly JM, Kerr AB, Larson PE. Optimal variable flip angle schemes for dynamic acquisition of exchanging hyperpolarized substrates. J Magn Reson 2013;234:75–81. [DOI] [PMC free article] [PubMed] [Google Scholar]
- [30].Cunningham CH, Chen AP, Albers MJ, Kurhanewicz J, Hurd RE, Yen YF, et al. Double spin-echo sequence for rapid spectroscopic imaging of hyperpolarized 13C. J Magn Reson 2007;187(2):357–62. [DOI] [PubMed] [Google Scholar]
- [31].Larson PEZ, Chen HY, Gordon JW, Korn N, Maidens J, Arcak M, et al. Investigation of analysis methods for hyperpolarized 13C-pyruvate metabolic MRI in prostate cancer patients. NMR Biomed 2018:e3997. [DOI] [PMC free article] [PubMed]
- [32].Maidens J, Gordon JW, Chen H, Park I, Criekinge MV, Milshteyn E, et al. Spatio-temporally constrained reconstruction for hyperpolarized carbon-13 MRI using kinetic models. IEEE Trans Med Imaging 2018:1–. [DOI] [PMC free article] [PubMed]
- [33].Chen AP, Tropp J, Hurd RE, Van Criekinge M, Carvajal LG, Xu D, et al. In vivo hyperpolarized 13C MR spectroscopic imaging with 1H decoupling. J Magn Reson 2009;197(1):100–6. [DOI] [PMC free article] [PubMed] [Google Scholar]
- [34].Kohler SJ, Yen Y, Wolber J, Chen AP, Albers MJ, Bok R, et al. In vivo (13)carbon metabolic imaging at 3T with hyperpolarized C-13–1-pyruvate. Magn Reson Med 2007;58(1):65–9. [DOI] [PubMed] [Google Scholar]
- [35].Gingrich JR, Barrios RJ, Foster BA, Greenberg NM. Pathologic progression of autochthonous prostate cancer in the TRAMP model. Prostate Cancer Prostatic Dis 1999;2(2):70–5. [DOI] [PubMed] [Google Scholar]
- [36].Hu S, Larson PE, Vancriekinge M, Leach AM, Park I, Leon C, et al. Rapid sequential injections of hyperpolarized [1-(1)(3)C]pyruvate in vivo using a sub-kelvin, multi-sample DNP polarizer. Magn Reson Imaging 2013;31(4):490–6. [DOI] [PMC free article] [PubMed] [Google Scholar]
- [37].Crane JC, Olson MP, Nelson SJ. SIVIC: Open-Source, Standards-Based Software for DICOM MR Spectroscopy Workflows. Int J Biomed Imaging 2013;2013:169526. [DOI] [PMC free article] [PubMed] [Google Scholar]
- [38].von Morze C, Reed GD, Shang H, Chen HY, Carvajal L, Tropp J, et al. Regional Faraday shielding for improved dynamic hyperpolarized 13C MRI. Proceedings of the International Society for Magnetic Resonance in Medicine 2014.
- [39].Zhu X, Gordon J, Bok R, Kurhanewicz J, Larson PE. Dynamic Diffusion Weighted Hyperpolarized 13C Imaging Based on a Slice-Selective Double Spin Echo Sequence for Measurements of Cellular Transport. Magn Reson Med 2018. [DOI] [PMC free article] [PubMed]
- [40].Nelson SJ, Kurhanewicz J, Vigneron DB, Larson PEZ, Harzstark AL, Ferrone M, et al. Metabolic Imaging of Patients with Prostate Cancer Using Hyperpolarized [1-C-13]Pyruvate. Sci Transl Med 2013;5(198). [DOI] [PMC free article] [PubMed] [Google Scholar]
- [41].DeMarzo AM, Nelson WG, Isaacs WB, Epstein JI. Pathological and molecular aspects of prostate cancer. Lancet 2003;361(9361):955–64. [DOI] [PubMed] [Google Scholar]
- [42].Dhanasekaran SM, Barrette TR, Ghosh D, Shah R, Varambally S, Kurachi K, et al. Delineation of prognostic biomarkers in prostate cancer. Nature 2001;412(6849):822–6. [DOI] [PubMed] [Google Scholar]
- [43].Koelsch BL, Reed GD, Keshari KR, Chaumeil MM, Bok R, Ronen SM, et al. Rapid in vivo apparent diffusion coefficient mapping of hyperpolarized (13) C metabolites. Magn Reson Med 2015;74(3):622–33. [DOI] [PMC free article] [PubMed] [Google Scholar]
- [44].Koelsch BL, Sriram R, Keshari KR, Swisher CL, Van Criekinge M, Sukumar S, et al. Separation of extra- and intracellular metabolites using hyperpolarized C-13 diffusion weighted MR. J Magn Reson 2016;270:115–23. [DOI] [PMC free article] [PubMed] [Google Scholar]
- [45].Reed GD, von Morze C, Bok R, Koelsch BL, Van Criekinge M, Smith KJ, et al. High resolution (13)C MRI with hyperpolarized urea: in vivo T(2) mapping and (15)N labeling effects. IEEE Trans Med Imaging 2014;33(2):362–71. [DOI] [PMC free article] [PubMed] [Google Scholar]
- [46].Yen YF, Le Roux P, Mayer D, King R, Spielman D, Tropp J, et al. T(2) relaxation times of (13)C metabolites in a rat hepatocellular carcinoma model measured in vivo using (13)C-MRS of hyperpolarized [1-(13)C]pyruvate. NMR Biomed 2010;23(4):414–23. [DOI] [PMC free article] [PubMed] [Google Scholar]
- [47].Milshteyn E, von Morze C, Reed GD, Shang H, Shin PJ, Zhu Z, et al. Development of high resolution 3D hyperpolarized carbon-13 MR molecular imaging techniques. Magn Reson Imaging 2017;38:152–62. [DOI] [PMC free article] [PubMed] [Google Scholar]
- [48].Ohliger MA, von Morze C, Marco-Rius I, Gordon J, Larson PEZ, Bok R, et al. Combining hyperpolarized (13) C MRI with a liver-specific gadolinium contrast agent for selective assessment of hepatocyte metabolism. Magn Reson Med 2017;77(6):2356–63. [DOI] [PMC free article] [PubMed] [Google Scholar]
- [49].Boskamp E, Xie Z, Taracila V, Stephen A, Edwards M, Skloss T, et al. A dual-tuned 70cm Whole-body Resonator for 13C and Proton MRI/MRS at 3T Proceedings of Joint Annual Meeting ISMRM-ESMRMB 2018. [Google Scholar]
- [50].Mareyam A, Carvajal L, Xu D, Gordon JW, Park I, Vigneron DB, et al. 31-Channel brain array for hyperpolarized 13C imaging at 3T Proceedings of Joint Annual Meeting ISMRM-ESMRMB 2017. [Google Scholar]
- [51].Leupold J, Mansson S, Petersson JS, Hennig J, Wieben O. Fast multiecho balanced SSFP metabolite mapping of (1)H and hyperpolarized (13)C compounds. MAGMA 2009;22(4):251–6. [DOI] [PubMed] [Google Scholar]
- [52].Milshteyn E, von Morze C, Gordon JW, Zhu Z, Larson PEZ, Vigneron DB. High spatiotemporal resolution bSSFP imaging of hyperpolarized [1-(13) C]pyruvate and [1-(13) C]lactate with spectral suppression of alanine and pyruvate-hydrate. Magn Reson Med 2018. [DOI] [PMC free article] [PubMed]
- [53].Wiesinger F, Weidl E, Menzel MI, Janich MA, Khegai O, Glaser SJ, et al. IDEAL spiral CSI for dynamic metabolic MR imaging of hyperpolarized [1–13C]pyruvate. Magn Reson Med 2012;68(1):8–16. [DOI] [PubMed] [Google Scholar]
- [54].Cunningham CH, Lau JY, Chen AP, Geraghty BJ, Perks WJ, Roifman I, et al. Hyperpolarized 13C Metabolic MRI of the Human Heart: Initial Experience. Circ Res 2016;119(11):1177–82. [DOI] [PMC free article] [PubMed] [Google Scholar]
- [55].Gordon JW, Vigneron DB, Larson PE. Development of a symmetric echo planar imaging framework for clinical translation of rapid dynamic hyperpolarized (13) C imaging. Magn Reson Med 2017;77(2):826–32. [DOI] [PMC free article] [PubMed] [Google Scholar]
- [56].Heisenberg W Die physikalischen prinzipien der quantentheorie 4. aufl. ed. Leipzig,: S. Hirzel; 1944. [Google Scholar]
Associated Data
This section collects any data citations, data availability statements, or supplementary materials included in this article.