Abstract
Structural characterization of protein-protein interactions is essential for our ability to study life processgges at the molecular level. Computational modeling of protein complexes (protein docking) is important as the source of their structure, and as a way to understand the principles of protein interaction. Rapidly evolving comparative docking approaches utilize target/template similarity metrics, which are often based on the protein structure. Although the structural similarity, generally, yields good performance, other characteristics of the interacting proteins (e.g. function, biological process, localization, and such) may improve the prediction quality, especially in the case of weak target/template structural similarity. For the ranking of a pool of models for each target, we tested scoring functions that quantify similarity of Gene Ontology (GO) terms assigned to target and template proteins in three ontology domains - biological process, molecular function and cellular component (GO-score). The scoring functions were tested in docking of bound, unbound and modeled proteins. The results indicate that the combined structural and GO-terms functions improve the scoring, especially in the twilight zone of structural similarity, typical for protein models of limited accuracy.
Keywords: protein recognition, protein-protein interactions, modeling of protein complexes, structure prediction
INTRODUCTION
Knowledge of the three-dimensional structure of protein-protein complexes is important for understanding the mechanisms of life processes. Structural modeling of protein-protein interactions (protein docking) can be roughly divided into free docking, where sampling of the binding modes is performed with no prior knowledge of similar experimentally determined structures, and template-based or comparative docking, where such similar complexes (templates) determine the predictions.
Template-free docking methods are mostly based on complementarity of the protein surfaces and estimated interaction energy, but also use knowledge-based approaches such as statistical potentials and docking constraints.1,2 Template-based docking is generally more accurate,3 and requires the availability of an experimentally determined structure of a protein-protein complex which is similar to the target.4 To detect a template, a search against a diverse library of protein-protein complexes is performed according to some measure of the target/template similarity. The widely used structure-based TM-score,5 originally developed for single proteins, has shown promising results in the protein-protein docking.4,6,7 However, the performance of the structure-only scoring drops significantly when the target and the template are only moderately similar (TM-score ~ 0.4 – 0.6).8
The goal of this study is to explore complementing geometric similarity in scoring of protein-protein models by additional terms, accounting for properties of the interacting proteins. We considered comprehensive hierarchical dictionary (i.e. ontology) of the GO-terms provided by the Gene Ontology Consortium.9,10 Many bioinformatics resources contain and use Gene Ontology Annotations (GOA) terms in protein and gene function prediction,11,12 prediction and validation of protein-protein interactions,13,14 gene expression,15 pathway regulation16 and homology analysis.17 All GO-terms (i.e. annotations) are subdivided into three domains: molecular function, biological process, and cellular component. Most studies consider only one ontology domain – molecular function, because of a weaker correlation of the remaining GO types (biological process and cellular component) with other metrics for comparison of genes and proteins.18,19 We investigated all three domains of the ontology and determined that their optimal combination improves the scoring of the template-based protein-protein docking.
METHODS
Similarity metrics for GO terms
The GO terms in each of the three ontology domains are organized in a Directed Acyclic Graph. A vertex of the graph represents a term (i.e. feature, described by the term) and an edge is the connection between the terms. There are six types of connections between the GO-terms.9,10 However, we considered only the strongest, “is-a” type of connection, which means “parent-child” relationships, i.e. the feature represented by the child term is a subtype of the feature represented by the parent term. In GO ontology, a term may have multiple parent terms. A GO-term ta is an ancestor/parent of a GO-term t (descendant/child) if there is a path from t to ta. ANC(t) and DES(t) are sets of all ancestors and descendants of term t, respectively (a term is usually considered the ancestor and the descendant of itself, i.e. and ).
We considered four algorithms based on the concept of information content (IC) of term t 20 defined as
| (1) |
where is the number of elements in DES() in a resource (in this study, UniProtKB database21), and is the total number of all GO-terms in the resource. Then, the simplest measure of similarity between GO terms and is based on the maximum information content of their common ancestors22
| (2) |
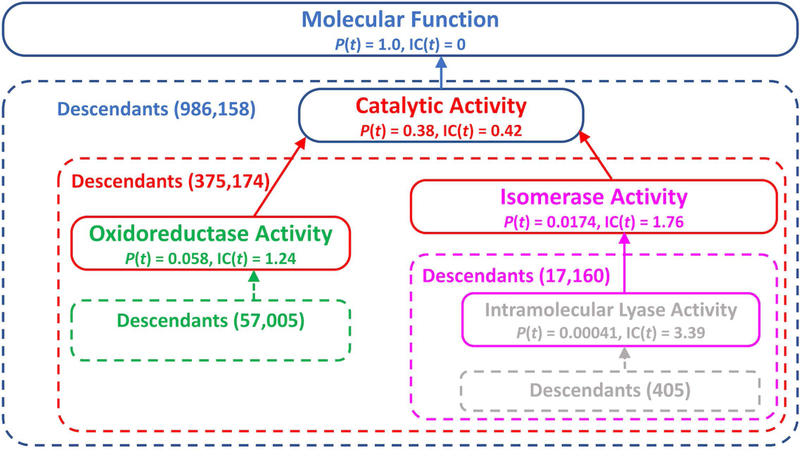
A serious drawback of Eq. 2 is that does not depend on the location of the terms in the GO graph. Thus, a generic term (located close to the graph root) can have the same similarity score to all descendants of another generic term, which may yield misleading results. For example, the term “Oxidoreductase Activity” has the same similarity score (0.42) to the term “Isomerase Activity” as to all the descendants of the latter (Fig. 1). To avoid this, alternative metrics, which take into account the information content of the terms, were proposed by Jiang et al.23
| (3) |
Lin24
| (4) |
and Schlicker et al.25
| (5) |
where t is a GO-term with maximum IC among common ancestors of and . Eqs. 3 – 5 take into consideration the location of a specific GO term in the graph. Thus, the scores between same-level terms “Oxidoreductase Activity” and “Isomerase Activity,” and between different-level terms “Oxidoreductase Activity” and “Intramolecular Lyase Activity” (Fig. 1) would be different (0.20 vs. 0.15, 0.28 vs. 0.18, and 0.17 vs. 0.11, calculated by Eq. 3, 4, and 5, respectively).
Figure 1. Schematic representation of a fragment of GO-term graph in the molecular function domain.
Probabilities P(t) and information contents IC(t) of the terms were calculated using Eq. 1. The number of descendants is shown in parentheses.
GO-terms similarity metrics for proteins and protein complexes
For calculating similarity between two sets of GO terms associated with proteins and we employed the best-match-average method26
| (6) |
where T(p) is the set of terms associated with protein p and is calculated as
| (7) |
where is the number of terms associated with protein and is the maximum of similarity scores between term , associated with protein and all terms associated with the other protein
| (8) |
The similarity score of two protein complexes cm and cn consisting of proteins and respectively, is calculated in two ways depending on the order of monomer superimposition in the modeling process
| (9) |
This similarity score will be henceforth referred to as the GO-score where X is MF, BP and CC (GO terms used for calculating similarity of individual proteins [Eqs. 6 – 8] based on molecular function, biological process and cellular component domains of the GO annotations, respectively); and Y = Resnik, Jiang, Lin, or Schlicker indicates different formulas for calculating similarities between single GO-terms (Eqs. 2, 3, 4 and 5, correspondingly).
Docking, scoring and quality assessment
The template-based docking protocol previously developed in our lab6,27 performs a systematic search for templates in the set of 4,950 binary complexes.28 In each complex, the target proteins and were structurally aligned to the template proteins and by TM-align29 and the quality of the alignments was assessed by TM-score.5 Following our previous study,4 only models generated from alignment pairs with both TM-scores > 0.4 were kept for the further evaluation. Identical target/template pairs (both TM-scores > 0.95) were removed. The models were ranked by the minimum of the two TM-scores
| (10) |
where A1 and A2 are either alignments of on , and on , correspondingly, or on , and on , correspondingly. Thus, a single protein-protein template may yield two models of complexes with different TM values. The total number of models for a target protein-protein complex depended on the number of available templates, according to the above criteria.
For further re-ranking of the protein-protein models, we used the GO-score from Eq. 9 corresponding to the order of aligned monomers in Eq. 10. The models were re-ranked by the GO-scores only (calculated by Eqs. 2 – 5 for MF, BP and CC domains), and by two combinations of GO- and TM-scores (only GO-scores from Schlicker Eq. 5 were used)
| (11) |
(henceforth referred to as the linear function LIN) and
| (12) |
(product-combined function PC).
Prediction was assessed by RMSD of ligand Cα atoms (L-RMSD), with optimally aligned receptors (receptor and ligand are the larger and the smaller protein in the complex, respectively). A prediction was considered near-native if L-RMSD ≤ 10 Å.30,31
Performance of a scoring function f was estimated by calculating the area under precision-recall curve AUC,32 with precision P and recall R defined as
| (13) |
where and are the number of correct and incorrect models in the prediction pool with the value of a scoring function f larger than a threshold , and is the total number of correct models in the prediction pool. Each point in the precision-recall plots corresponds to a certain threshold, and the entire curve covers values in the full range 0.0 to 1.0.
Datasets
The performance of the scoring functions (11) and (12) was evaluated on the structure alignment predictions4 obtained for three protein sets from the Dockground resource,33 using template library of 4,950 full-structure binary complexes.28
-
(1)
Bound set consisted of 587 protein-protein complexes purged at 30% sequence identity. Calculations of the GO-scores (9) were performed for 108,915 target-template pairs corresponding to 507 targets, for which the minimum of the two TM scores was > 0.4 (see above). The GO terms were extracted from the UniProtKB database21 using UniProt IDs of proteins from PDB.34 The individual , and scores were calculated for 73,347 pairs corresponding to 477 targets (these pairs will be referred to as BP bound set), 75,966 pairs of 466 targets (MF bound set), and 54,857 pairs for 456 targets (CC bound set), respectively. The GO scores for all three ontology domains could be calculated for 46,613 target-template pairs of 426 targets (3-domain bound set).
-
(2)
Unbound set comprised unbound structures for 223 binary complexes, extracted from the Dockground benchmark set 4.35 The set is used to evaluate docking/scoring methodology on experimentally determined unbound protein structures. In this set, the GO-scores for all three ontology domains could be calculated for 3,029 target-template pairs of 152 targets (3-domain unbound set).
-
(3)
Model set consisted of the X-ray structures and six models with predefined Cα RMSD from the native structure (1, 2, …, 6 Å) for each protein in 165 protein-protein complexes (Dockground model set 236). The set is used to evaluate docking/scoring methodology on protein models of limited accuracy. The GO-scores for all three ontology domains could be calculated at all structure accuracy levels for 48,015 target-template pairs of 131 targets (3-domain model set).
RESULTS AND DISCUSSIONS
Similarity metrics for GO terms
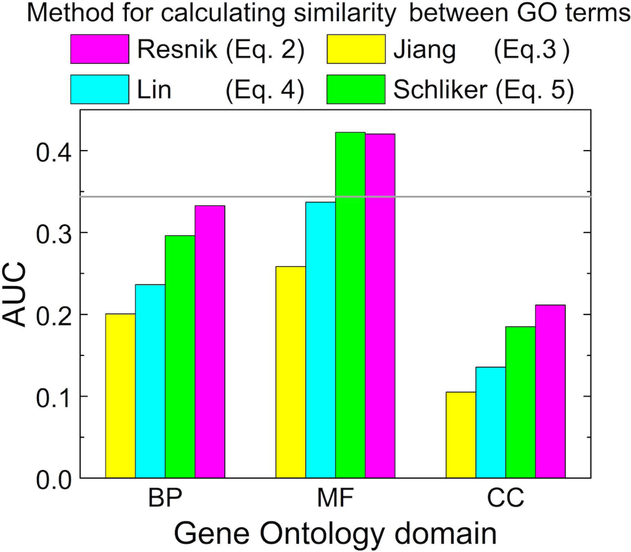
The value of score depends on how the similarity between single GO terms is calculated. We explored four methods, using the concept of the information content (Eqs. 2–5). To choose a method for the docking, for each target in the 3-domain bound set, the templates were ranked by the values calculated separately for the MF, BP and CC domains of the GO terms using Eqs. 2–5. The evaluation of the predictions in terms of AUC (Eq. 13) for each variant (Fig. 2) showed that Resnik (Eq. 2) and Schlicker (Eq. 5) formulas yield better docking results than Jiang (Eq. 3) and Lin (Eq. 4). For the largest domain - molecular function, the Schlicker formula gives slightly better results than the Resnik formula. Thus, only the GO score by Schlicker Eq. 5 will be used for the rest of the paper (without index Y in the notation ). Since GO annotations are independent of the structure, Eq. 5 will be also used to calculate in unbound and model sets.
Figure 2. Evaluation of different scoring functions.
The evaluation was performed in terms of the area under precision-recall curve AUC, calculated according to Eq. 13. The target complexes were generated using templates ranked by the GO-score obtained by different methods for calculating similarity of single GO terms (Eqs. 2 – 5). The horizontal line corresponds to the AUC value for the TM scoring function (Eq. 10). The results are shown separately for the molecular function (MF), biological process (BP), and cellular component (CC) Gene Ontology domains. The results are obtained on the 3-domain bound set.
Electronic GO annotations
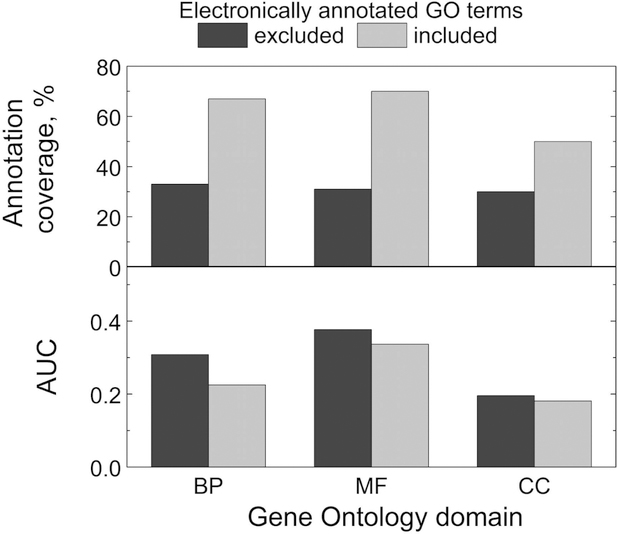
Many GO terms are assigned by automated prediction tools based on sequence37,38 or structure.39 Earlier studies assigned low credibility to the electronically annotated GO-terms (with the IEA evidence code), and did not recommend their use.19 However, more recently, the quality of the electronic annotations significantly improved, and the computationally inferred GO terms have been considered reliable.20,40 To elucidate the effect of the electronic function annotation on docking, we ranked target-template pairs in the MF, BP and CC sets (see Methods) by the GO scores calculated with and without electronically annotated GO terms. The comparison of the results by AUC is shown in Figure 3. Exclusion of the electronically annotated terms lead to significant drop in the annotation coverage, whereas the decrease in the docking performance is insignificant. Thus, all GO scores presented below were calculated with the electronically annotated GO terms.
Figure 3. The effect of electronic function annotation on docking.
Annotation coverage and area under precision-recall curve AUC for the docking in the BP, MF and CC bound sets with and without electronically annotated GO terms.
GO-scores complement structural similarity in scoring of protein-protein models
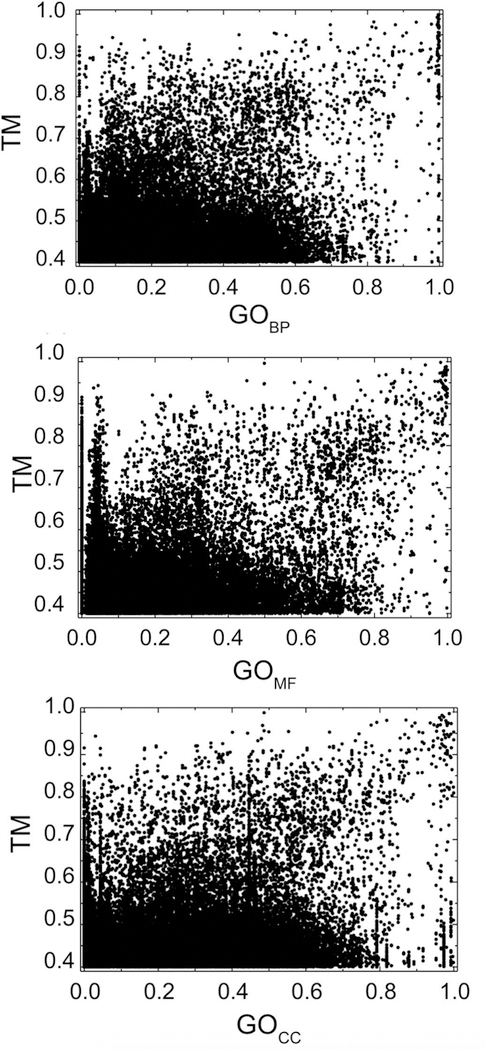
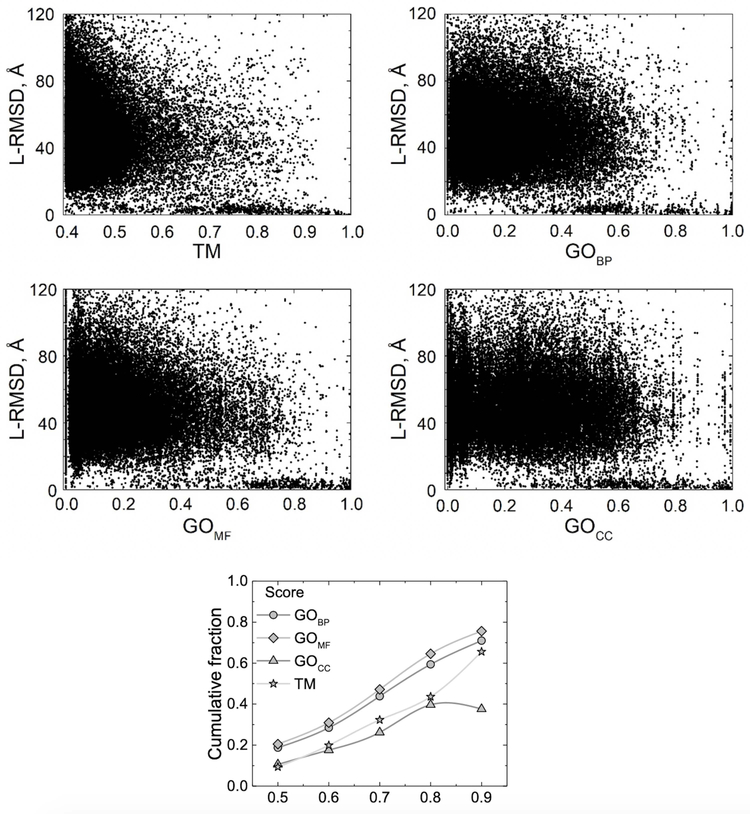
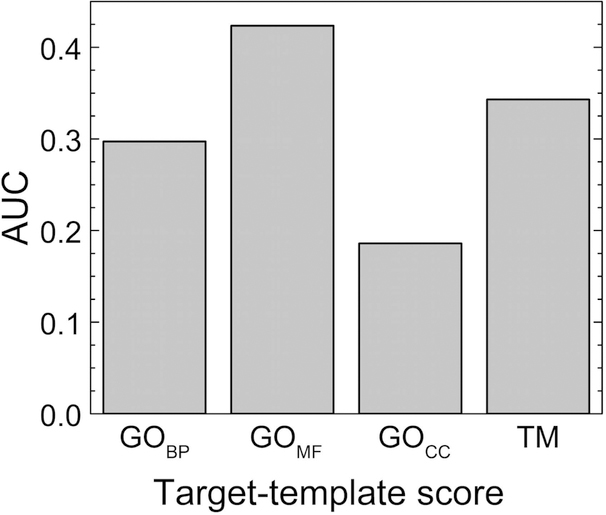
The GO-scores and the TM-score are only weakly correlated. Figure 4 shows target-template comparison data for the 3-domain bound set (Pearson correlation coefficient r = 0.26 for BP, r = 0.31 for MF, r = 0.20 for CC ontology domains). The results for BP, MF and CC bound sets are similar. Correlation of the target-template GO-scores with the quality of the resulting predictions (Fig. 5) is weak for the full range of values (r close to zero) because of the randomness of the generated models (reflected in the wide range of their L-RMSD values). However, importantly, they show a pattern similar to that of the target-template TM-score vs. L-RMSD where target-template comparisons with higher score values converge to the low values of L-RMSD (high accuracy of docking). Better performance of the GOMF score compared to the TM in terms of cumulative fraction of near-native models (Fig. 5 bottom panel) and AUC (Fig. 6) is counterweighted by a smaller number of target-template pairs for which the ranking by GOMF can be performed. For target-template pairs with minimum TM-score > 0.4, 70% had GO terms in the molecular function domain. However, with the progress on protein annotation, this percentage should grow in the future.
Figure 4. Target-template TM-scores vs. GO-scores.
The GO-scores were calculated using GO terms from biological process (BP), molecular function (MF), and cellular component (CC) ontology domains. The data is obtained on the 3-domain bound set.
Figure 5. Target-template TM- and GO-scores vs. docking accuracy.
BP is biological process, MF is molecular function, and CC is cellular component. Ligand RMSD is between Cα atoms of predicted and native structure. Target-template comparisons with higher score values converge to the low values of L-RMSD (correct binding mode prediction). Bottom panel shows the cumulative fraction of the correct binding mode predictions (L-RMSD < 10 Å) for target-template scores larger than a threshold. Data obtained on the 3-domain bound set.
Figure 6.
Area under precision-recall curve AUC for predictions in 3-domain bound set for different scoring functions.
Proteins can participate in various biological processes and reside in different parts of the cell, but have similar activity based on similarity of the structure. Indeed, a significant number of the near-native models in the 3-domain bound set have templates with a high value (more than the average value for the set) of the minimum TM-score, and low values (less than the average value for the set) of the GO scores (6.6, 6.4 and 7.4 % for the GOMF, GOBP, and GOCC scores, respectively). Consequently, the template ranking by the GOCC score alone yield worse docking performance than the ranking by the TM- and GOMF and GOBP scores (Figs. 5, 6).
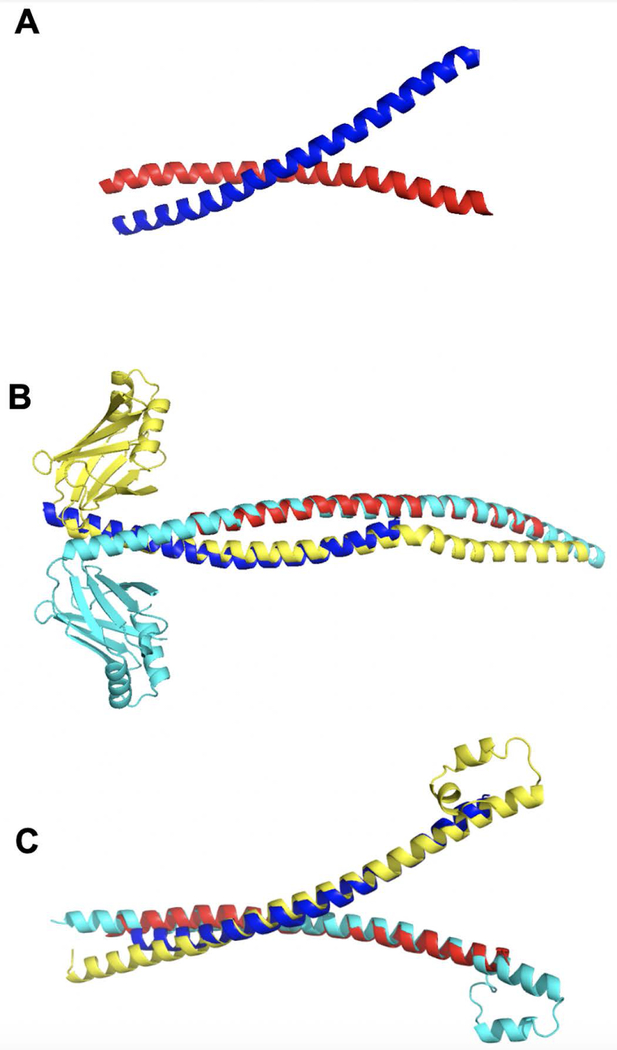
Thus, we suggest that the best use of GO-scores in comparative protein docking is as a complement to the target-template structural similarity. In a number of cases, the GO-score can act as a factor for choosing the appropriate template, especially when several target-template pairs have small differences in their TM values. For example, the MF bound set contains 187 cases with difference in the TM values < 0.01 (both TM-scores > 0.7) and the difference in the GOMF values > 0.3. As an illustration, a target complex Proto-oncogene c-Fos and its JUN/AP-1 transcription factor (1fos chains E and F) has two templates with the difference in TM values < 1%, but significantly different GOMF: (i) DNA repair protein XRCC4 (1ik9 chains A and B) with TM = 0.768 and GOMF = 0.30, and (ii) transcription factor MafB (2wty chains A and B) with TM = 0.760 and GOMF = 0.82. The former template yielded incorrect prediction with L-RMSD 41.2 Å and rank 17 by TM, whereas the latter template produced near-native prediction with L-RMSD 6.9 Å and TM rank 20 (Fig. 7).
Figure 7. Example of target-template pairs with small difference in TM values.
Target is red and blue, and template is cyan and yellow. (A) The native structure of target 1fos. (B) Chains EF of the target aligned with chains AB of template 1ik9. (C) The same chains aligned with chains AB of template 2wty.
Scoring function optimization and analysis
The combined scoring functions consist of weighted linear combination of the GO scores in three ontology domains and the TM-score (LIN function, Eq. 11), or the product of TM-score and weighted linear combination of the GO scores (PC function, Eq. 12). The main reason for choosing PC was that it is better in separating models with high and low values of the TM- and GO-scores. The coefficients with the maximum AUC were determined by the Differential Evolution heuristic algorithm41 for the 3-domain set (Table I). The coefficients obtained using other datasets (e.g., 5,532 protein pairs with GO annotations in all three domains from the Dockground template set28) did not differ significantly from the coefficients obtained on the 3-domain bound set (Table I).
Table I. Coefficients for scoring functions.
The values were obtained by maximizing the area under precision-recall curve AUC (Eq. 14) generated on 3-domain bound set. For comparison, the values obtained on the Dockground template set are in parentheses.
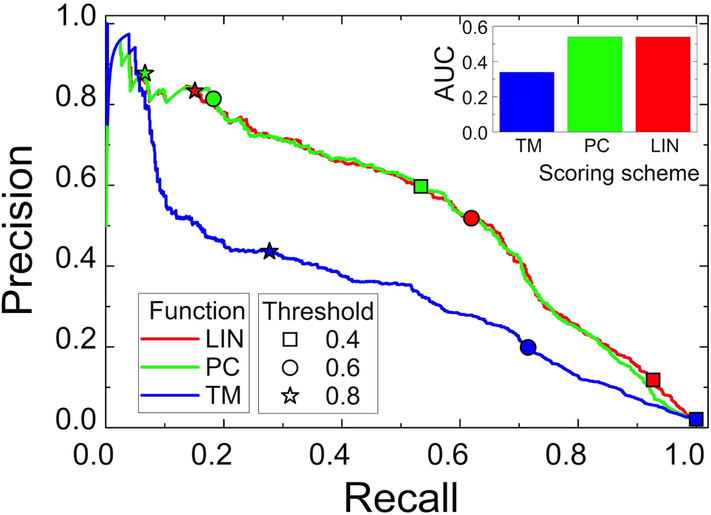
In terms of AUC, LIN and PC performed similarly in scoring of the predictions, in terms of AUC, both significantly surpassing scoring by the TM alone (Fig. 8). However, that significant AUC difference between TM and the combined functions in the 3-domain bound set was caused primarily by seven targets with simple structural motifs. These targets have a large number of predictions built on templates with similar motifs, and thus nearly undistinguishable high TM values. However, the mutual orientation of these motifs varies from template to template, decreasing the precision (Eq. 13). At the same time, biological processes, functions and cellular localizations of such proteins can be different. Thus, adding GO-scores purges incorrect models from the precision calculations at higher function cutoffs. For example, target 2qdq (talin dimerization domain) consists of two interacting α-helices. Thus, it has a very large number (2,898) of predictions based on templates with such helices. Without these targets AUC for the TM function increases to 0.52.
Figure 8. Evaluation of scoring by precision-recall.
The precision-recall curves and corresponding area under the curve AUC (Eq. 13) are for docking in the 3-domain set, scored by TM, PC and LIN functions. The recall and precision values for different thresholds of the scoring functions are shown by symbols (see legend in the Figure). TM, LIN and PC were calculated by Eqs. 10, 11 and 12, respectively. The coefficients for LIN and PC are in Table I.
Nevertheless, performance of all three functions was different in distinguishing the near-native models. LIN had larger recall values than PC and TM, which lead to greater coverage of the near-native predictions by LIN at given cutoffs. On the other hand, PC had significantly larger precision values than LIN and TM (Fig. 8). Similar observations were made on other datasets used in this study. Thus, we chose the PC function for the higher precision identification of more reliable templates.
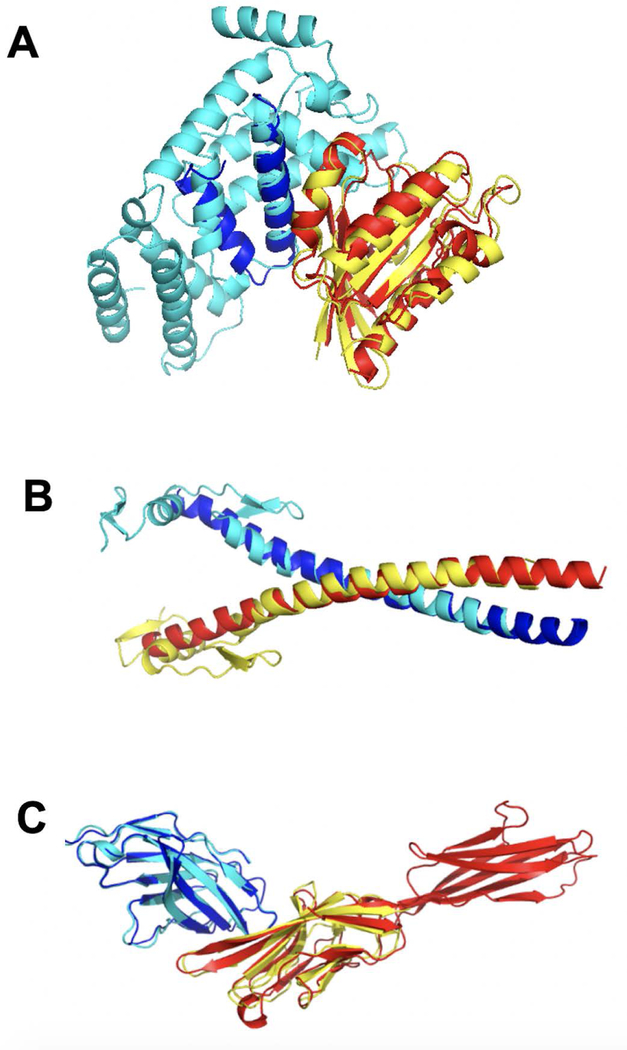
Large improvement in ranking (> 10 positions) by PC was obtained for 30 targets (29 targets by LIN). For example, low L-RMSD = 9.4 Å prediction of the target ADP-ribosylation factor 1 and its binding protein GGA1 (1j2j chains AB) based on moderately structurally similar (TM = 0.52) template complex AtVSP9a and AtRABF2b (2efd chains AB) had rank 125 by TM. The low TM-score is due to a large difference in sizes of the aligned chains (Fig. 9A). However, the target and the template are similar in all three ontology domains (GOMF = 0.49, GOBP = 0.45 and GOCC = 0.45) yielding rank 6 by PC. More structural examples with spectacular ranking improvement, in which the structural similarity is limited either by different sizes of targets and templates or by simple and thus ubiquitous structural nature of the proteins, are in Fig. 9B, C.
Figure 9. Examples of target-template pairs for which PC function yielded significant improvement of the near-native prediction ranking.
Target is red and blue, and template is cyan and yellow. (A) Target 1j2j chains AB, template 2efd AB, near-native rank improvement from 125 to 6; (B) target 1fos EF, template 1llm CD, near-native rank improvement from 88 to 4; (C) target 1i8l AC, template1i85 BD, near-native rank improvement from 19 to 1.
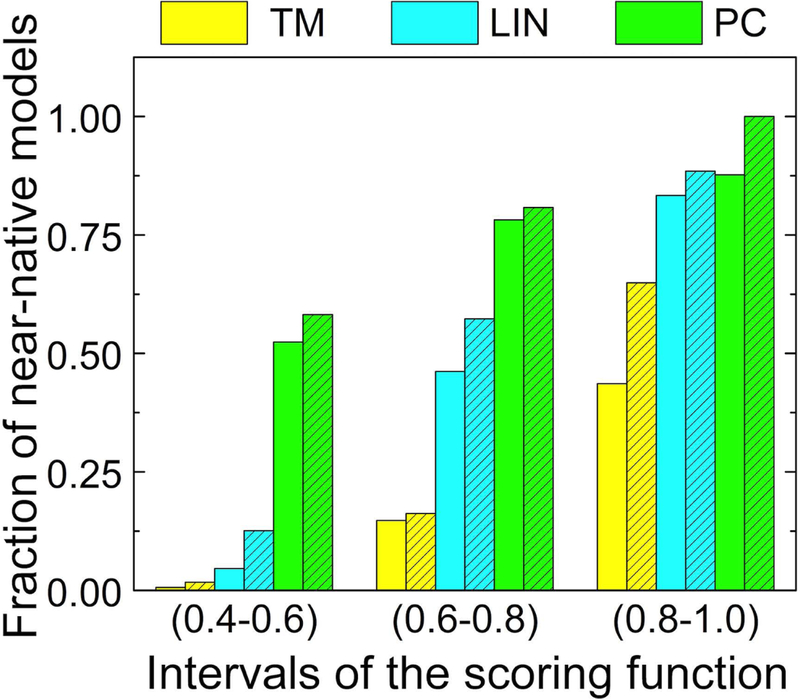
Whereas the overall docking success rate - the fraction of targets, for which the top prediction is a near-native one - for crystallographically determined structures did not increase compared to TM, the combined scoring improved the ranking reliability by significantly increasing the fraction of the near-native matches in the prediction pool (Fig. 10). Even for structurally nearly identical target-template pairs (TM > 0.8), 56% of the predictions in the 3-domain set were incorrect. Combined scoring purged a significant number of the incorrect predictions from this range. After that, the fraction of near-native predictions increased to 88% with PC > 0.8 (83% for LIN). For the less structurally similar target-template pairs, the difference was even larger. Less than 1% of the predictions with weak structural similarity to the template (0.4 ≤ TM < 0.6) were the near-native ones. This percentage grew dramatically to 52% for the same interval of PC values (46% for LIN). A similarly significant increase in reliability of the ranking by the combined scoring functions was observed on the 3-domain unbound set as well.
Figure 10. Fraction of near-native predictions in bound and unbound sets.
Data is shown separately for intervals of the scoring function in the 3-domain bound (open bars) and unbound (hatched bars) sets.
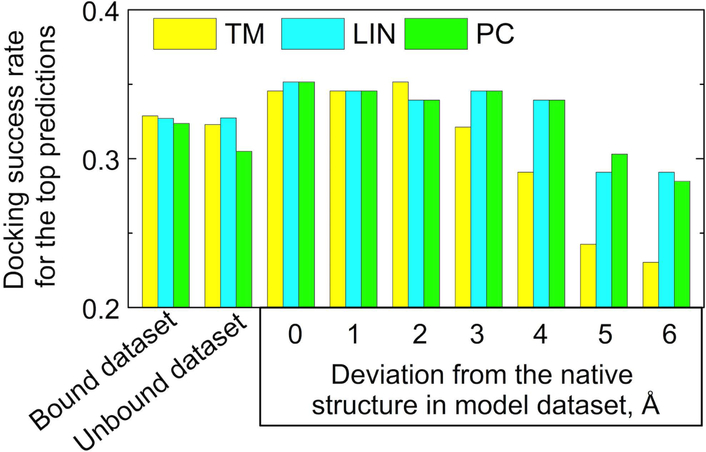
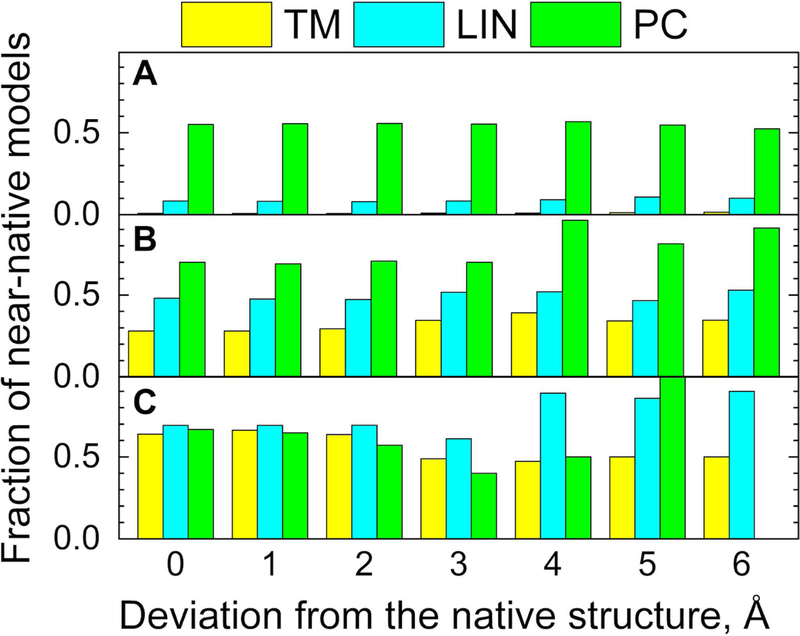
In structural reconstruction of protein interaction networks, most structures of the individual proteins have to be modeled rather than determined experimentally.42 The accuracy of protein modeling, especially the high-throughput one, needed for large protein networks, is lower than that of the high-resolution experimental approaches. Thus, in docking of such models, the structural similarity to templates would be generally smaller than in docking of the experimentally determined structures. Since the GO-scores are not affected by structural variations, one may expect that they can be especially useful in scoring of the model-model docking. The performance of LIN and PC scoring functions was tested on predictions for the Dockground model-model benchmark set 2.36 The docking success rate improved starting from ~ 4 Å model accuracy (Fig. 11). The ranking reliability significantly increased compared to the structural comparison in the gray area of structural similarity (Fig. 12). The results show that the combined structural and GO-terms functions improve the scoring, especially in the twilight zone of structural similarity, typical for protein models of limited accuracy.
Figure 11. Docking success rate for top 1 prediction with different scoring functions.
For the model dataset, data are shown for the reference structures (0 Å) and the model structures with levels of accuracy 1 – 6 Å. The success rate is a fraction of 587, 223, and 165 targets in bound, unbound and model datasets, respectively, in which the top prediction has L-RMSD ≤ 10 Å.
Figure 12. Fraction of near-native predictions in the model set.
Data is shown for separate intervals of the scoring function (A) 0.4 – 0.6, (B) 0.6 – 0.8, and (C) 0.8 – 1.0, corresponding to crystallographically determined structures (0 Å) and the levels of model accuracy 1 – 6 Å. The PC value at 6 Å accuracy level is absent because there were no near-native models in this function range.
CONCLUDING REMARKS
To improve the scoring of comparative protein-protein models, we propose complementing the target-template structural similarity by scoring based on the similarity of GO terms. The combined scoring functions were benchmarked using 4,950 templates from the Dockground resource. The non-redundant protein-protein target sets were: (i) 587 co-crystallized complexes, non-redundant at 30% sequence identity; (ii) 223 experimentally determined unbound complexes; and (iii) 165 complexes with six models for each structure, generated with predefined Cα RMSD from the native structure 1, 2, …, 6 Å. The combined scoring function separated the near-native and incorrect predictions significantly better than the scoring based solely on the structure alignment, especially in the twilight zone of the structural similarity. The improvement held even if the GO terms were assigned only in one of the ontology domains (i.e. molecular function), which is essential for practical applications, since many proteins lack annotation in all three domains. Thus, using GO terms in comparative protein docking increases the probability of selecting the correct match from the pool of predictions in the real-case scenario when the structure of the native complex is unknown. Since the GO-score is independent of the quality of the protein structures, an important application of this methodology is docking of protein models where target-template structural similarity is reduced due to inherent inaccuracies of the models. The results showed that the relative importance of the combined scoring function increases with the decrease of the protein models’ accuracy. The proposed approach to discriminate incorrect docking solutions should become more potent as more proteins get high-quality GO annotation describing their specific features (i.e. more distant from the root of the GO-terms graph).
ACKNOWLEDGMENTS
This study was supported by NIH grant R01GM074255 and NSF grants DBI1262621, DBI1565107 and CNS1337899.
REFERENCES
- 1.Vakser IA. Protein-protein docking: From interaction to interactome. Biophys J 2014;107:1785–1793. [DOI] [PMC free article] [PubMed] [Google Scholar]
- 2.Kozakov D, Brenke R, Comeau SR, Vajda S. PIPER: An FFT-based protein docking program with pairwise potentials. Proteins 2006;65:392–406. [DOI] [PubMed] [Google Scholar]
- 3.Anishchenko I, Kundrotas PJ, Vakser IA. Modeling complexes of modeled proteins. Proteins 2017;85:470–478. [DOI] [PMC free article] [PubMed] [Google Scholar]
- 4.Kundrotas PJ, Zhu ZW, Janin J, Vakser IA. Templates are available to model nearly all complexes of structurally characterized proteins. Proc Natl Acad Sci USA 2012;109:9438–9441. [DOI] [PMC free article] [PubMed] [Google Scholar]
- 5.Zhang Y, Skolnick J. Scoring function for automated assessment of protein structure template quality. Proteins 2004;57:702–710. [DOI] [PubMed] [Google Scholar]
- 6.Sinha R, Kundrotas PJ, Vakser IA. Docking by structural similarity at protein-protein interfaces. Proteins 2010;78:3235–3241. [DOI] [PMC free article] [PubMed] [Google Scholar]
- 7.Kundrotas PJ, Anishchenko I, Dauzhenka T, Vakser IA. Modeling CAPRI targets 110–120 by template-based and free docking using contact potential and combined scoring function. Proteins 2018;86:302–310. [DOI] [PMC free article] [PubMed] [Google Scholar]
- 8.Negroni J, Mosca R, Aloy P. Assessing the applicability of template-based protein docking in the twilight zone. Structure 2014;22:1356–1362. [DOI] [PubMed] [Google Scholar]
- 9.Gene Ontology C, Blake JA, Dolan M, Drabkin H, Hill DP, Li N, Sitnikov D, Bridges S, Burgess S, Buza T, McCarthy F, Peddinti D, Pillai L, Carbon S, Dietze H, Ireland A, Lewis SE, Mungall CJ, Gaudet P, Chrisholm RL, Fey P, Kibbe WA, Basu S, Siegele DA, McIntosh BK, Renfro DP, Zweifel AE, Hu JC, Brown NH, Tweedie S, Alam-Faruque Y, Apweiler R, Auchinchloss A, Axelsen K, Bely B, Blatter M, Bonilla C, Bouguerleret L, Boutet E, Breuza L, Bridge A, Chan WM, Chavali G, Coudert E, Dimmer E, Estreicher A, Famiglietti L, Feuermann M, Gos A, Gruaz-Gumowski N, Hieta R, Hinz C, Hulo C, Huntley R, James J, Jungo F, Keller G, Laiho K, Legge D, Lemercier P, Lieberherr D, Magrane M, Martin MJ, Masson P, Mutowo-Muellenet P, O’Donovan C, Pedruzzi I, Pichler K, Poggioli D, Porras Millan P, Poux S, Rivoire C, Roechert B, Sawford T, Schneider M, Stutz A, Sundaram S, Tognolli M, Xenarios I, Foulgar R, Lomax J, Roncaglia P, Khodiyar VK, Lovering RC, Talmud PJ, Chibucos M, Giglio MG, Chang H, Hunter S, McAnulla C, Mitchell A, Sangrador A, Stephan R, Harris MA, Oliver SG, Rutherford K, Wood V, Bahler J, Lock A, Kersey PJ, McDowall DM, Staines DM, Dwinell M, Shimoyama M, Laulederkind S, Hayman T, Wang S, Petri V, Lowry T, D’Eustachio P, Matthews L, Balakrishnan R, Binkley G, Cherry JM, Costanzo MC, Dwight SS, Engel SR, Fisk DG, Hitz BC, Hong EL, Karra K, Miyasato SR, Nash RS, Park J, Skrzypek MS, Weng S, Wong ED, Berardini TZ, Huala E, Mi H, Thomas PD, Chan J, Kishore R, Sternberg P, Van Auken K, Howe D, Westerfield M. Gene Ontology annotations and resources. Nucleic Acids Res 2013;41(Database issue):D530–535. [DOI] [PMC free article] [PubMed] [Google Scholar]
- 10.Gene Ontology Consortium: going forward. Nucleic Acids Res 2015;43(Database issue):D1049–1056. [DOI] [PMC free article] [PubMed] [Google Scholar]
- 11.Yu G, Zhu H, Domeniconi C, Liu J. Predicting protein function via downward random walks on a gene ontology. BMC Bioinformatics 2015;16:271. [DOI] [PMC free article] [PubMed] [Google Scholar]
- 12.King OD, Foulger RE, Dwight SS, White JV, Roth FP. Predicting gene function from patterns of annotation. Genome research 2003;13:896–904. [DOI] [PMC free article] [PubMed] [Google Scholar]
- 13.Yang L, Tang X. Protein-protein interactions prediction based on iterative clique extension with gene ontology filtering. TheScientificWorldJournal 2014;2014:523634. [DOI] [PMC free article] [PubMed] [Google Scholar]
- 14.Wu X, Zhu L, Guo J, Zhang DY, Lin K. Prediction of yeast protein-protein interaction network: Insights from the Gene Ontology and annotations. Nucleic Acids Res 2006;34:2137–2150. [DOI] [PMC free article] [PubMed] [Google Scholar]
- 15.Khatri P, Draghici S. Ontological analysis of gene expression data: Current tools, limitations, and open problems. Bioinformatics 2005;21:3587–3595. [DOI] [PMC free article] [PubMed] [Google Scholar]
- 16.Qin T, Matmati N, Tsoi LC, Mohanty BK, Gao N, Tang J, Lawson AB, Hannun YA, Zheng WJ. Finding pathway-modulating genes from a novel Ontology Fingerprint-derived gene network. Nucleic Acids Res 2014;42:e138. [DOI] [PMC free article] [PubMed] [Google Scholar]
- 17.Thomas PD, Wood V, Mungall CJ, Lewis SE, Blake JA, Gene Ontology C. On the use of Gene Ontology annotations to assess functional similarity among orthologs and paralogs: A short report. PLoS computational biology 2012;8:e1002386. [DOI] [PMC free article] [PubMed] [Google Scholar]
- 18.Lord PW, Stevens RD, Brass A, Goble CA. Investigating semantic similarity measures across the Gene Ontology: The relationship between sequence and annotation. Bioinformatics 2003;19:1275–1283. [DOI] [PubMed] [Google Scholar]
- 19.Pesquita C, Faria D, Bastos H, Ferreira AE, Falcao AO, Couto FM. Metrics for GO based protein semantic similarity: A systematic evaluation. BMC Bioinformatics 2008;9 Suppl 5:S4. [DOI] [PMC free article] [PubMed] [Google Scholar]
- 20.Wu X, Pang E, Lin K, Pei ZM. Improving the measurement of semantic similarity between gene ontology terms and gene products: Insights from an edge- and IC-based hybrid method. PloS one 2013;8:e66745. [DOI] [PMC free article] [PubMed] [Google Scholar]
- 21.Apweiler R, Bairoch A, Wu CH, Barker WC, Boeckmann B, Ferro S, Gasteiger E, Huang H, Lopez R, Magrane M, Martin MJ, Natale DA, O’Donovan C, Redaschi N, Yeh LS. UniProt: the Universal Protein knowledgebase. Nucleic Acids Res 2004;32(Database issue):D115–119. [DOI] [PMC free article] [PubMed] [Google Scholar]
- 22.Resnik P Using information content to evaluate semantic similarity in a taxonomy. Proc 14th Int Joint Conf Artificial intelligence - Volume 1. Montreal, Quebec, Canada: Morgan Kaufmann Publishers Inc.; 1995. p 448–453. [Google Scholar]
- 23.Jiang JJ, Conrath DW. Semantic Similarity Based on Corpus Statistics and Lexical Taxonomy 1997; Taipei, Taiwan: p 19–33. [Google Scholar]
- 24.Lin D An information-theoretic definition of similarity. Proc 15th Int Conf Machine Learning: Morgan Kaufmann Publishers Inc.; 1998. p 296–304. [Google Scholar]
- 25.Schlicker A, Domingues FS, Rahnenfuhrer J, Lengauer T. A new measure for functional similarity of gene products based on Gene Ontology. BMC Bioinformatics 2006;7:302. [DOI] [PMC free article] [PubMed] [Google Scholar]
- 26.Couto FM, Silva MJ, Coutinho PM. Measuring semantic similarity between Gene Ontology terms. Data & Knowledge Eng 2007;61:137–152. [Google Scholar]
- 27.Sinha R, Kundrotas PJ, Vakser IA. Protein docking by the interface structure similarity: How much structure is needed? PloS one 2012;7:e31349. [DOI] [PMC free article] [PubMed] [Google Scholar]
- 28.Anishchenko I, Kundrotas PJ, Tuzikov AV, Vakser IA. Structural templates for comparative protein docking. Proteins 2015;83:1563–1570. [DOI] [PMC free article] [PubMed] [Google Scholar]
- 29.Zhang Y, Skolnick J. TM-align: a protein structure alignment algorithm based on the TM-score. Nucleic acids research 2005;33(7):2302–2309. [DOI] [PMC free article] [PubMed] [Google Scholar]
- 30.Hunjan J, Tovchigrechko A, Gao Y, Vakser IA. The size of the intermolecular energy funnel in protein-protein interactions. Proteins 2008;72:344–352. [DOI] [PubMed] [Google Scholar]
- 31.Kundrotas PJ, Vakser IA. Protein-protein alternative binding modes do not overlap. Protein Sci 2013;22:1141–1145. [DOI] [PMC free article] [PubMed] [Google Scholar]
- 32.Davis J, Goadrich M. The relationship between Precision-Recall and ROC curves. Proc 23rd Int Conf Machine Learning. Pittsburgh, PA: ACM; 2006. p 233–240. [Google Scholar]
- 33.Douguet D, Chen HC, Tovchigrechko A, Vakser IA. DOCKGROUND resource for studying protein-protein interfaces. Bioinformatics 2006;22:2612–2618. [DOI] [PubMed] [Google Scholar]
- 34.Berman HM, Westbrook J, Feng Z, Gilliland G, Bhat TN, Weissig H, Shindyalov IN, Bourne PE. The Protein Data Bank. Nucleic Acids Res 2000;28:235–242. [DOI] [PMC free article] [PubMed] [Google Scholar]
- 35.Kundrotas PJ, Anishchenko I, Dauzhenka T, Kotthoff I, Mnevets D, Copeland MM, Vakser IA. DOCKGROUND: A comprehensive data resource for modeling of protein complexes. Protein Sci 2018;27:172–181. [DOI] [PMC free article] [PubMed] [Google Scholar]
- 36.Anishchenko I, Kundrotas PJ, Tuzikov AV, Vakser IA. Protein models docking benchmark 2. Proteins 2015;83:891–897. [DOI] [PMC free article] [PubMed] [Google Scholar]
- 37.Hennig S, Groth D, Lehrach H. Automated Gene Ontology annotation for anonymous sequence data. Nucleic Acids Res 2003;31:3712–3715. [DOI] [PMC free article] [PubMed] [Google Scholar]
- 38.Khan S, Situ G, Decker K, Schmidt CJ. GoFigure: Automated Gene Ontology annotation. Bioinformatics 2003;19:2484–2485. [DOI] [PubMed] [Google Scholar]
- 39.Roy A, Yang J, Zhang Y. COFACTOR: An accurate comparative algorithm for structure-based protein function annotation. Nucleic Acids Res 2012;40(Web Server issue):W471–477. [DOI] [PMC free article] [PubMed] [Google Scholar]
- 40.Skunca N, Altenhoff A, Dessimoz C. Quality of computationally inferred gene ontology annotations. PLoS computational biology 2012;8:e1002533. [DOI] [PMC free article] [PubMed] [Google Scholar]
- 41.Storn R, Price K. Differential evolution – A simple and efficient heuristic for global optimization over continuous cpaces. J Global Optimization 1997;11:341–359. [Google Scholar]
- 42.Vakser IA. Low-resolution structural modeling of protein interactome. Curr Opin Struct Biol 2013;23:198–205. [DOI] [PMC free article] [PubMed] [Google Scholar]


