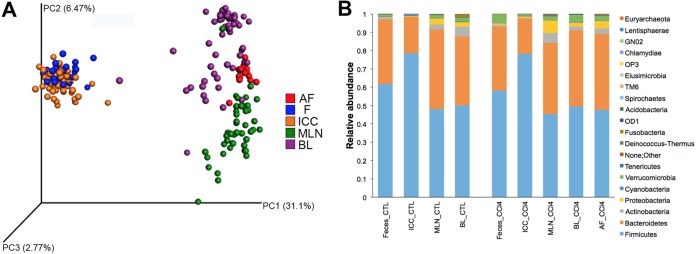
FIG 1.
Spatial microbial community compositions in control and CCl4-treated rats. (A) Weighted principal coordinate analysis (PCoA) UniFrac metrics (taxonomic clustering). (B) Relative abundance at the phylum level; n = 23 for stool, n = 59 for ICC, n = 46 for MLN, n = 57 for blood, and n = 15 for AF.

