Abstract
Song learning in zebra finches (Taeniopygia guttata) requires exposure to the song of a tutor, resulting in an auditory memory. This memory is the foundation for later sensorimotor learning, resulting in the production of a copy of the tutor's song. The cortical premotor nucleus HVC (proper name) is necessary for auditory and sensorimotor learning as well as the eventual production of adult song. We recently discovered that the intrinsic physiology of HVC neurons changes across stages of song learning, but are those changes the result of learning or are they experience-independent developmental changes? To test the role of auditory experience in driving intrinsic changes, patch-clamp experiments were performed comparing HVC neurons in juvenile birds with varying amounts of tutor exposure. The intrinsic physiology of HVC neurons changed as a function of tutor exposure. Counterintuitively, tutor deprivation resulted in juvenile HVC neurons showing an adult-like phenotype not present in tutor-exposed juveniles. Biophysical models were developed to predict which ion channels were modulated by experience. The models indicate that tutor exposure transiently suppressed the Ih and T-type Ca2+ currents in HVC neurons that target the basal ganglia, whereas tutor exposure increased the resting membrane potential and decreased the spike amplitude in HVC neurons that drive singing. Our findings suggest that intrinsic plasticity may be part of the mechanism for auditory learning in the HVC. More broadly, models of learning and memory should consider intrinsic plasticity as a possible mechanism by which the nervous system encodes the lasting effects of experience.
SIGNIFICANCE STATEMENT It is well established that learning involves plasticity of the synapses between neurons. However, the activity of a neural circuit can also be dramatically altered by changes in the intrinsic properties (ion channels) of the component neurons. The present experiments show experience-dependent changes in the intrinsic physiology of neurons in the cortical premotor nucleus HVC (proper name) in juvenile zebra finches (Taeniopygia guttata) during auditory learning of a tutor's song. Tutor deprivation does not “arrest” development of intrinsic properties, but rather results in neurons with a premature adult-like physiological phenotype. It is possible that auditory learning involves a form of nonsynaptic plasticity and that experience-dependent suppression of specific ion channels may work in concert with synaptic plasticity to promote vocal learning.
Keywords: auditory learning, birdsong, intrinsic plasticity, ion channels, modeling, zebra finch
Introduction
At the neurophysiological level of analysis, learning is an experience-dependent change in the way the brain processes information. It is well accepted that experience alters the synaptic connectivity of neurons, resulting in new memories and behaviors. Here, we explore the possibility that, beyond altering synaptic connectivity, experience has a role in shaping the intrinsic physiology (passive membrane properties and composition of ion channels) of neurons in the cortical premotor nucleus HVC (proper name) needed for song learning and production in male zebra finches (Taeniopygia guttata). If the intrinsic properties of HVC neurons can be altered through experience, then this would provide the nervous system with a new dimension by which it can be modified to encode vocal learning.
The learning of song is a sensory-dependent process of the imitation of a tutor and occurs over distinct auditory and sensorimotor stages (Tchernichovski et al., 2001; Brainard and Doupe, 2002). The auditory stage begins when a juvenile male is exposed to the song of an adult tutor, resulting in the encoding of an auditory memory of the tutor song. Once an auditory memory is formed, exposure to a tutor is no longer necessary for normal song copying (Funabiki and Konishi, 2003). Proper functioning of nucleus HVC is required for the formation of the auditory memory of the tutor (Roberts et al., 2010, 2012). Additionally, it has been shown that juvenile HVC neurons are responsive to tutor song in awake behaving birds (Nick and Konishi, 2005). HVC is also required for sensorimotor learning and production of the adult vocal pattern (Aronov et al., 2008; Long and Fee, 2008).
A network's output is the product of both the activity of its constituent neurons and their connectivity. Changing either network feature will alter the output of the network. Synaptic plasticity, a change in neuronal connectivity, has been studied in HVC across development (Day et al., 2013). It has also been studied as a function of tutor exposure (Roberts et al., 2010), where blocking NMDA receptors in HVC impaired auditory learning (Roberts et al., 2012). The present experiments test the hypothesis that, beyond synaptic plasticity, intrinsic plasticity functions as a complementary mechanism for auditory learning in HVC. The experiments are predicated on previous work showing that the intrinsic physiology of HVC is not stable over development, but changes in a systematic way in concert with song learning (Ross et al., 2017).
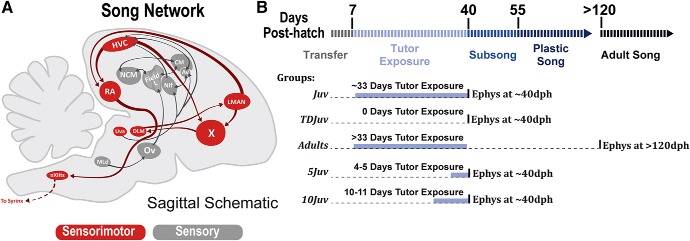
As a follow-up to our studies showing developmental changes in the physiology of HVC neurons, the present studies sought to determine whether auditory learning drives these intrinsic changes. Comparisons were made between groups of juvenile birds with varying durations of exposure to a tutor. Figure 1B shows experimental and control groups along with the timing of tutor exposure. Experimental results were supplemented with biophysical models to indicate changes in ion channel expression associated with tutor exposure.
Figure 1.
Song circuit of the zebra finch and major experimental groups. A, Abridged sagittal schematic of the song network in the male zebra finch. The HVC contains two major populations of projection neurons (HVCX neurons and HVCRA neurons) and interneurons (HVCINT). Additionally, there is a small population of nucleus avalanche-projecting HVC neurons not shown in the schematic (Roberts et al., 2017). LMAN, Llateral portion of the magnocellular nucleus of the anterior nidopallium; Area X, basal ganglia homolog; RA, robust nucleus of the arcopallium; DLM, medial dorsolateral nucleus of the thalamus; NCM, caudal medial nidopallium; NIF, forebrain nucleus interface of the nidopallium; CMM, caudal medial mesopallium; Av, nucleus avalanche; Field L; Ov, ovoidalis; Uva, nucleus uvaeformis; MLd, dorsal lateral nucleus of the mesencephalon; nXIIts, nucleus XII tracheosyringeal part. B, Different experimental groups along with their tutor exposure time. For all juveniles, electrophysiological recording took place at ∼40 dph. For all adults, electrophysiological recording took place at >120 dph.
The results of these experiments provide evidence that cell-type-specific changes in the intrinsic physiology of HVC projection neurons are shaped by tutor exposure. This suggests that there exists a mechanism by which experience drives systematic changes in ion channel expression in HVC neurons. The results also open the possibility that intrinsic changes induced during the formation of an auditory memory may encourage greater plasticity during sensorimotor learning.
Materials and Methods
Experimental subjects.
Male zebra finches (n = 35) were used in all experiments and were either hatched in individual breeding chambers or in aviary housing facilities at Florida State University. Animal care and experimental procedures were performed in accordance with National Science Foundation guidelines and approved by the Florida State University Animal Care and Use Committee. Juvenile finches were raised in acoustically isolated, climate-controlled recording chambers with an adult female. For the 5 d and 10 d tutor-exposed juveniles, a male tutor was introduced to the chamber at specific time points depending on the experimental group. For the normal tutor-exposed juveniles and the normal tutor-exposed adults, the tutor was present when the juveniles were transferred from the aviaries. The adult male tutors had the same song (tutor 2 was the offspring of tutor 1). Therefore, all juveniles with tutor exposure were tutored to the same song. Juveniles were transferred from the breeding aviaries at 7 d posthatch (dph).
Experimental groups.
Electrophysiological recordings were compared from six groups that varied in age and tutor exposure (Fig. 1B). Data from the Juv and Adult groups were originally reported in Ross et al. (2017). Recordings were reanalyzed here using an updated MATLAB script and these data were then used for the current statistical analyzes that compare the various tutor deprivation groups with these normal developmental data.
Normal tutor-exposed juveniles (Juv) were exposed to a tutor for ∼33 d and were at the onset of the subsong stage of vocal learning. This time of exposure is sufficient to establish an auditory memory of tutor song (Elliott et al., 2014). Birds in the Juv group (n = 5) were 39–42 dph.
Tutor-deprived juveniles (TDJuv) were never exposed to a tutor after being transferred from the aviaries. Transfer at 7 dph is sufficient to create the tutor-deprived phenotype (Fehér et al., 2009). Birds in the TDJuv group (n = 8) were 39–41 dph.
Normal tutor-exposed adult birds (Adult) sang a stable vocal pattern with minimal variability in syllable repertoire and sequence across bouts of singing. Birds in the adult song group (n = 10) were >120 dph.
Five-day tutor-exposed juveniles (5Juv) were tutor deprived at 7 dph. A tutor was then introduced between 4 and 5 d before electrophysiology. Birds in the 5Juv group (n = 4) were 40–41 dph. There was no significant difference between the 4 and 5 d exposures, so they were treated as one group.
Ten-day tutor-exposed juveniles (10Juv) were tutor deprived at 7 dph. A tutor was then introduced between 10 and 11 d before electrophysiological recording. Birds in the 10Juv group (n = 6) were 40–41 dph. There was no significant difference between the 10 and 11 d exposures, so they were treated as one group.
Five-day tutor-exposed 5 d-delay juveniles (5E5DJuv) were tutor deprived at 7 dph. A tutor was then introduced for 5 d followed by a 5 d delay before electrophysiological recording. Birds in the 5E5DJuv group (n = 2) were 40–41 dph.
Exposure durations for the 5 and 10 d exposure groups were based on the findings of Roper and Zann (2006) showing that 10 d of tutor exposure as a juvenile resulted in adult vocal behavior that was indistinguishable from control exposure conditions, whereas 5 d of exposure resulted in limited song learning.
Song recording, measurement, and analysis.
To assess the potential effect of tutor deprivation on the structure of juvenile subsong, the vocalizations of groups of tutor-deprived (n = 4) and tutored (n = 4) juvenile males were recorded, measured, and subjected to statistical analysis. During the 3 d before electrophysiology, vocalizations produced by juvenile male birds in the recording chambers were captured by microphones that were connected to a PC running sound-event triggered software (Avisoft Recorder; Avisoft Bioacoustics). Sound was sampled at a rate of 44 kHz. Each captured sound event was saved to the computer's hard drive as a time-stamped audio (.wav) file. Audio files were manually sorted to identify isolated instances of juvenile male singing (i.e., singing that occurred while the other adult male and/or female birds in the chamber were silent). Using the Explore and Score tool in Sound Analysis Pro (SAP 2011) software (Tchernichovski et al., 2001) we quantified the acoustic properties (pitch, FM, entropy, pitch goodness, and duration) of 200 individual syllables per bird. For each bird, syllable measures were exported to Excel (Microsoft) and the mean value was calculated for each acoustic property.
Figure 2 shows graphs of individual and group (tutor-deprived vs tutored) data for each of the measured acoustic properties of subsong (pitch, FM, entropy, pitch goodness, and duration). The results of statistical tests, shown within each graph in Figure 2, indicated that the acoustic properties of subsong did not vary as a function of tutor deprivation: all between-group comparisons were nonsignificant. Although the sample size is small, there is no hint of any differences between these groups, suggesting that tutor deprivation did not affect the acoustic structure of subsong.
Figure 2.

Subsong production. No differences were detected in the vocal behavior of birds before the preparation of slices (39–42 dph). Each panel displays the results of sound analysis of different acoustic properties of the vocalizations from tutor-deprived and normally tutored birds. There was clear overlap between groups in all of these features and no statistically significant differences were observed. Tutor deprivation did not affect the acoustic features of subsong.
HVC and cell identification using retrograde tracers.
To aid in the identification of HVC and to positively identify HVCX neurons, the retrograde tracer DiI (Life Technologies; ∼400 nl volume) was bilaterally pressure injected into Area X. This procedure was performed as in Ross et al. (2017) using the coordinates from Basista et al. (2014), injecting dye 3.5 mm anterior to the stereotaxic zero and 1.5 mm lateral to the midsagittal sinus. Dye injections were allowed to transport for at least 7 d before electrophysiological recording.
Slice preparation and whole-cell electrophysiology.
Slice preparation and electrophysiology was performed using previously established methods and thus are only summarized here (Ross et al., 2017). The ACSF contained the following (in mm): 119 NaCl, 2.5 KCl, 1.3 MgCl2, 2.5 CaCl2, 1 NaH2PO4, 26.2 NaHCO3, and 22 glucose. ACSF osmolality was between 290–295 mOsm and pH was ∼7.2. Throughout the procedure and electrophysiological recording, ACSF was gassed with 95% O2-5% CO2. After dissecting the brain out of the skull, the hippocampus was resected to facilitate HVC sectioning. Then, 250–300 μm parahorizontal slices of HVC were sectioned and transferred to an incubation chamber for ∼1 h before electrophysiological recording. Recordings were made using room temperature ACSF. Recording electrodes were unpolished with a resistance of 5–9 MΩ (pulled on a Sutter Instruments P-80 micropipette puller). The intracellular solution contained the following (in mm): 125 K-gluconate, 15 KCl, 1 MgCl2, 10 HEPES, 5 EGTA, 2 Mg-ATP, and 0.3 Na3-GTP. The pH was adjusted to ∼7.2 using KOH and the osmolality was adjusted to ∼295–300 mOsm using sucrose. To limit synaptic communication between neurons, the AMPA/kainate receptor antagonist CNQX and the GABAA receptor antagonist picrotoxin were bath applied for all experiments. Epifluorescence illumination was used to identify HVC and HVCX neurons. If the neuron showed a stable resting membrane potential (Vrest) below ∼−50 mV, a stable access resistance, and exhibited action potentials in response to depolarizing current injection, then it would undergo a series of current injection protocols and included in analysis. The liquid junction potential was measured to be ∼−2.8 mV and was left uncorrected. Bridge balance was set using the “auto” setting of Multiclamp Commander software. Although this may not have perfectly balanced the bridge for all cells, this objective method ensures that there is no possibility of experimenter bias in establishing these settings.
Electrophysiological trace analysis.
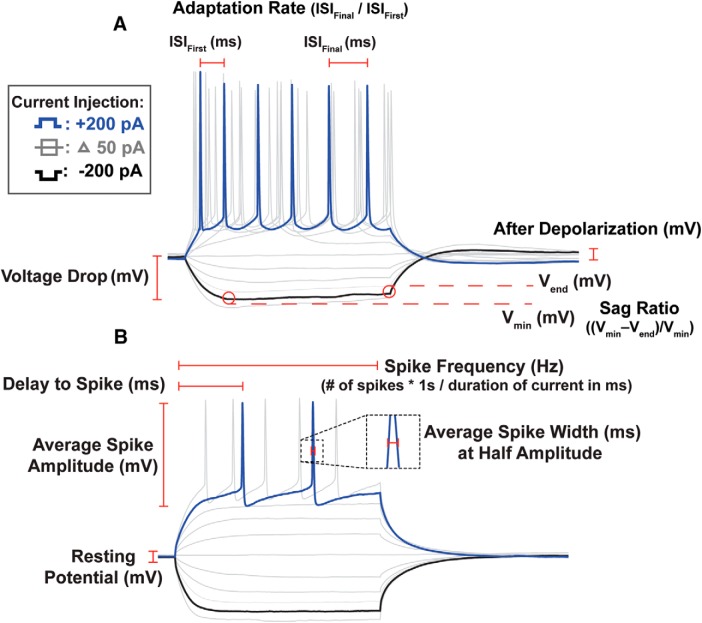
Although some group differences in some physiological features were readily apparent by visual inspection of the traces, a wide variety of physiological features were measured to determine whether more subtle differences were also present. Figure 3 illustrates the computation of many of the features measured. Although these features were measured in response to multiple current pulses of varying amplitude, in many cases, detailed below, we simplified our statistical analyzes by comparing the feature only at a specific amplitude of current pulse. All measurements were obtained using custom a MATLAB script. The computations, paraphrased below, are detailed in previous work (Daou et al., 2013; Ross et al., 2017). To determine the passive membrane properties of the neurons, an average was taken of a 100 ms pulse of −10 pA of current over 10 sweeps. This protocol was used to minimize the activation of voltage-gated channels (Franzen et al., 2015; Hong et al., 2016). Data were evaluated against a simple RC curve using the MATLAB “fit” function and those with poor fits (two cells) were excluded from analysis, one Juv HVCRA cell and one Adult HVCRA cell. To calculate membrane input resistance (RM), the magnitude of the voltage deflection was divided by the value of the applied current (−10 pA). To calculate the membrane time constant (τM), a single exponential was fit to the first 50 ms of the voltage trace following current onset. To calculate the membrane capacitance (CM), the membrane τM was divided by the RM (CM = τM/RM). The remainder of the physiological features were analyzed based on the voltage response to square wave current pulses, typically ranging from −200 pA to 200 pA and lasting 300 ms. To calculate the Vrest, the voltage of the traces before the onset of the current injection was averaged. To calculate the average spike amplitude, the mean was taken across all depolarizing current injections for the first spike amplitude, calculated as the maximum voltage of the spike peak minus the minimum voltage of the afterhyperpolarization of the spike. The average spike width was calculated as the mean of the onset spike width at half amplitude for all depolarizing current injections. Spike latency was defined as the time from the onset of a 100 pA current injection to the peak of the triggered spike. To calculate spike frequency, the number of spikes elicited by a current injection was multiplied by 1000/duration of the pulse to obtain the number of spikes/s, providing the average spike frequency. Statistical comparisons of spike frequency were performed for a standard 200 pA pulse amplitude. Interspike interval was calculated as the duration between spikes measured at half-amplitude. To calculate spike frequency adaptation, the adaptation ratio (AR) was computed comparing the final interspike interval and the first interspike interval. An AR of 1 indicates there is no adaptation, whereas a larger AR indicates a slowing of spiking over the current injection. Statistical comparisons of AR were performed for a standard 200 pA pulse amplitude. The voltage drop (Vdrop) was statistically analyzed at −200 pA and was calculated as Vrest − Vmin. The sag ratio (SR) was statistically analyzed at −200 pA equaling (Vmin− Vend)/Vmin, such that Vend is the final voltage at the offset of the current injection and Vmin is the minimum voltage during the current injection. The ratio was used, rather than the absolute sag value because the sag would typically be larger with cells exhibiting larger (in magnitude) Vmin. This effect is offset by the normalization. The afterdepolarization was calculated as the amount of depolarization above Vrest following a hyperpolarizing current injection, omitting data if this resulted in an action potential. The proportion of cells showing rebound action potentials was also compared. Both rebound measures were statistically compared at a −200 pA current pulse.
Figure 3.
Electrophysiolgical trace analysis. Shown is an illustration of many of the features analyzed and compared across experimental conditions. A, Example from an HVCX neuron. B, Example from an HVCRA neuron.
Experimental design and statistical analysis.
n = 5 birds were recorded in the Juv group, n = 8 birds in TDJuv group, n = 4 birds in the 5Juv group, n = 6 birds in the 10Juv group, n = 2 birds in the 5E5DJuv group, and n = 10 birds in the Adult group. The numbers of cells recorded for each group are detailed in the Results. To compare across groups, the values for each measured feature were compared using a one-way ANOVA for select current injection values (detailed above). The first set of experiments compared Juv, TDJuv, and Adult, resulting in three levels of comparison. The second set of experiments compared TDJuv, 5Juv, 10Juv, and Juv, resulting in four levels of comparison. Because multiple ANOVAs were performed for 12 different features of the traces, the criterion for claiming statistical differences was adjusted using a Bonferroni correction (with the new significance threshold being p < 0.05/12 = 0.004). Therefore, the corrected p-values, which are reported below, were calculated by multiplying each individual ANOVA p-value by 12. The term “statistically significant” is used if the corrected p-value was < 0.05. This very conservative criterion may miss legitimate, but smaller differences in other features, but whether these subtle differences truly exist does not alter the overall conclusions of this study. Therefore, all of these analyses are reported, but only the most robust differences are declared to be statistically significant. The ANOVA was followed up by post hoc pairwise comparisons, also using Bonferroni correction. The results were also compared using a nonparametric Kruskal–Wallis test. The results of these analyses were congruent with the ANOVA analyses. Therefore, for simplicity, only the commonly used ANOVA analyses are presented. As detailed in the Results, in some cases, multiple cells were recorded from an individual bird. The common practice of treating each cell as an individual “subject” in the statistical analysis was followed, but it should be noted that this could underestimate error variance if cells of a given class within a bird are more similar than those cells between birds. Our sampling is too small to determine whether this is true because cell numbers ranged from only one to four cells per bird. Nevertheless, effects deemed statistically significant using the one-way ANOVA were confirmed using a more complex mixed-effects general linear model analysis in which individual cells were nested within the various birds. All statistically significant effects by ANOVA also met criterion for statistical significance by these mixed-model analyses. Because claims of statistical significance were identical after all of the various methods used to analyze the results, full details of these analyses are reported using only the commonly understood ANOVA. Statistics were computed with MATLAB using the “anova” and “multcompare” functions, Microsoft Excel, and SPSS.
Mathematical modeling.
The mathematical models presented here are from Ross et al. (2017), with parameters calibrated to fit the current data. The models consist of voltage-gated Na+ and K+ currents (INa and IK), a hyperpolarization-activated cation current (Ih), a high-threshold L-type Ca2+ current (ICa-L), a low-threshold T-type Ca2+ current (ICaT), a small conductance Ca2+-activated K+ current (ISK), a persistent Na+ current (INap), an M-type K+ current (IM), an A-type K+ current (IA), and a leak current (IL). Different values for capacitance and other parameters are used for the different neuron types and different durations of tutor exposure.
The membrane potential is determined by the following equation:
 |
where C is the cell CM, and IApp is the applied current. Channel kinetics are as described in Ross et al. (2017).
Parameters in each model were calibrated to current-clamp data from a single neuron with pulses of ±200 pA. The solution was then evaluated by examining the model output to different applied currents and comparing that output with the physiological traces from that cell. Different calibrations were made for different durations of tutor exposure. Model calibration was focused primarily on the responses to hyperpolarizing current pulses, where the major tutor-induced changes were observed. The parameter values of the calibrated models serve to generate predictions of which channels are changing as a result of tutor experience. For Ih, both the magnitude of the current and proportion of channels having fast versus slow kinetics were fit to the data.
Code accessibility.
Computer simulations of the models were performed using the MATLAB solver ode23. Computer codes can be downloaded as freeware from https://www.math.fsu.edu/∼bertram/software/birdsong/.
Results
These experiments test the hypothesis that experience, specifically the exposure of a juvenile to an adult tutor, shapes the intrinsic physiology of HVC neurons. All juveniles used in experiments were ∼40 dph and varied only in the length of time that they were exposed to a tutor before electrophysiological recording. Patch-clamp recordings showed that tutor deprivation alters the intrinsic physiology of HVC projection neurons and that this effect can be offset in a “dose-dependent” manner through limited exposure to a tutor. The traces were analyzed for a variety of features and tested for statistically significant differences across tutor exposure conditions (see Methods). Although only selected properties of interest are discussed in detail below, the population data and statistics for all analyzed features are shown in Tables 1, 2, 3, 4, and 5. HVCX neurons were positively identified using a retrograde tracer, while HVCRA and HVCINT neurons were putative, with their classification based on distinct physiological features that were confirmed by retrograde labeling in adult tissue (Daou et al., 2013). Key features that readily distinguish between HVCRA and HVCINT neurons are Vrest, sag ratio and spike frequency. HVCRA neurons show a developmental (and as shown below, experience-dependent) change in Vrest (Ross et al., 2017), but two populations of cells could be readily identified using the other two features at all of the ages and experience levels tested. Figure 4 shows a scatterplot of our cell classification using the sag and spike frequency. Adult neurons could also be identified by Vrest, as in the previous publications (Daou et al., 2013, Ross et al., 2017). Because the categorization was based on similarities of these features to cell types in the adult HVC, it remains possible that an immature HVCRA cell could be masquerading as an HVCINT neuron, or vice versa, and developmental/experiential changes reported for these cells are underestimated. Nevertheless, the results show that there are cell-type specific changes in the intrinsic physiology of (putative) HVCRA and (identified) HVCX neurons as a function of tutor exposure.
Table 1.
Physiological features measured for HVCX neurons from Juv, TDJuv, and normal Adult birds
| HVCX (stable features) | Juv | TDJuv | Adult | ||||
|---|---|---|---|---|---|---|---|
| Vrest (mV) | −67.00 ± 1.51 | −63.66 ± 1.93 | −65.45 ± 1.00 | ||||
| τM (ms) | 31.60 ± 5.16 | 28.50 ± 5.63 | 48.23 ± 10.38 | ||||
| RM (MΩ) | 236.88 ± 43.72 | 245.41 ± 41.43 | 299.46 ± 48.11 | ||||
| CM (pF) | 170.55 ± 47.66 | 126.33 ± 32.32 | 185.40 ± 42.55 | ||||
| Spike amplitude (mV) * | 64.65 ± 4.98 | 80.68 ± 4.25 | 82.04 ± 4.49 | ||||
| Spike frequency (HZ) | 27.35 ± 4.61 | 28.33 ± 3.33 | 27.57 ± 2.40 | ||||
| Adaptation rate | 1.55 ± 0.11 | 1.75 ± 0.17 | 1.75 ± 0.11 | ||||
| Spike latency (ms) | 79.61 ± 26.40 | 33.31 ± 6.87 | 40.68 ± 18.14 | ||||
| Spike width (ms) | 2.19 ± 0.14 | 1.89 ± 0.13 | 1.87 ± 0.15 | ||||
| Voltage drop (mV) * | 29.32 ± 2.91 | 37.52 ± 3.75 | 46.07 ± 4.88 | ||||
| HVCX (affected features) | Juv | TDJuv | Adult | TDJuv vs Juv (p) | TDJuv vs Adult (p) | Juv vs Adult (p) | DF |
| Sag ratio | 0.008 ± 0.001 | 0.034 ± 0.003 | 0.040 ± 0.006 | < 0.01 | 0.68 | < 0.01 | 27 |
| Afterdepolarization (mV) | 1.68 ± 0.39 | 4.71 ± 0.94 | 8.06 ± 1.88 | 0.09 | 0.11 | < 0.01 | 17 |
Mean values for each feature (± SEM) are presented. Features that showed statistically significant differences between groups are presented separately, along with the p-values and degrees of freedom (DF) for the Bonferroni-corrected pairwise comparisons. Two features (*) trended toward statistical significance but did not meet our strict standard following Bonferroni correction for the multiple ANOVAs.
Table 2.
Physiological features measured for HVCRA neurons from Juv, TDJuv, and normal Adult birds
| HVCRA (stable features) | Juv | TDJuv | Adult | ||||
|---|---|---|---|---|---|---|---|
| τM (ms) | 15.91 ± 3.95 | 20.24 ± 1.71 | 14.58 ± 2.68 | ||||
| RM (MΩ) | 221.78 ± 58.35 | 323.37 ± 36.78 | 268.67 ± 41.75 | ||||
| CM (pF) | 72.74 ± 11.70 | 63.84 ± 3.52 | 56.58 ± 7.81 | ||||
| Spike frequency (HZ) | 12.00 ± 4.51 | 13.70 ± 5.84 | 8.61 ± 2.37 | ||||
| Adaptation rate | 1.82 ± 0.36 | 0.88 ± 0.28 | 1.34 ± 0.16 | ||||
| Spike latency (ms) | 12.01 ± 3.55 | 18.93 ± 4.43 | 21.22 ± 7.81 | ||||
| Spike width (ms) | 1.98 ± 0.15 | 1.69 ± 0.20 | 1.90 ± 0.16 | ||||
| Sag ratio | 0.01 ± 0.00 | 0.01 ± 0.00 | 0.01 ± 0.00 | ||||
| Afterdepolarization (mV) | 1.26 ± 0.51 | 0.89 ± 0.16 | 1.06 ± 0.22 | ||||
| Voltage drop (mV) | 33.61 ± 5.74 | 35.92 ± 5.82 | 25.50 ± 3.20 | ||||
| HVCRA (affected features) | Juv | TDJuv | Adult | TDJuv vs Juv (p) | TDJuv vs Adult (p) | Juv vs Adult (p) | DF |
| Vrest (mV) | −62.31 ± 1.71 | −76.71 ± 1.31 | −76.92 ± 0.64 | 0.01 | 0.92 | 0.01 | 32 |
| Spike amplitude (mV) | 53.30 ± 4.88 | 74.10 ± 4.19 | 76.50 ± 3.89 | < 0.01 | 0.99 | 0.01 | 32 |
Mean values for each feature (± SEM) are presented. Features that showed statistically significant differences between groups are presented separately, along with the p-values and degrees of freedom (DF) for the Bonferroni-corrected pairwise comparisons.
Table 3.
Physiological features measured for HVCINT neurons from Juv, TDjuv, and normal Adult birds
| HVCINT | Juv | TDJuv | Adult |
|---|---|---|---|
| Vrest (mV) | −54.53 ± 1.04 | −58.11 ± 0.90 | −56.94 ± 1.21 |
| Spike frequency (Hz) | 78.61 ± 14.75 | 71.33 ± 5.83 | 107.58 ± 11.14 |
| Adaptation rate | 1.22 ± 0.07 | 1.17 ± 0.10 | 1.16 ± 0.06 |
| Spike latency (ms) | 6.18 ± 1.89 | 9.13 ± 2.31 | 7.01 ± 1.46 |
| Spike width (ms) | 0.89 ± 0.13 | 1.13 ± 0.11 | 0.97 ± 0.08 |
| Spike amplitude (mV)* | 73.43 ± 6.75 | 73.92 ± 2.80 | 55.67 ± 2.71 |
| Sag ratio | 0.12 ± 0.03 | 0.15 ± 0.02 | 0.13 ± 0.02 |
| Voltage drop (mV) | 42.93 ± 5.77 | 43.51 ± 9.76 | 46.83 ± 4.88 |
Mean values for each feature (± SEM) are presented.
*Spike amplitude was the only feature showing a statistically significant variation with the TDJuv amplitude being greater than adult (Bonferroni corrected, DF = 19, p = 0.017) but not different from Juv (p = 0.99).
Table 4.
Physiological features measured for HVCX neurons from 5Juv and 10Juv
| HVCX (stable features) | 5Juv | 10Juv | |||||||
|---|---|---|---|---|---|---|---|---|---|
| Vrest (mV) | −65.59 ± 1.68 | −64.78 ± 2.29 | |||||||
| τM (ms) | 33.24 ± 3.56 | 39.55 ± 10.21 | |||||||
| RM (MΩ) | 309.63 ± 43.87 | 314.67 ± 73.91 | |||||||
| CM (pF) | 114.56 ± 11.74 | 129.14 ± 18.18 | |||||||
| Spike frequency (HZ) | 26.25 ± 3.85 | 22.00 ± 3.59 | |||||||
| Adaptation rate | 1.65 ± 0.14 | 1.60 ± 0.11 | |||||||
| Spike latency (ms) | 39.95 ± 8.56 | 86.81 ± 25.95 | |||||||
| Spike width (ms) | 2.16 ± 0.08 | 2.52 ± 0.62 | |||||||
| Voltage drop (mV) | 35.48 ± 2.79 | 31.52 ± 6.26 | |||||||
| Spike amplitude (mV) | 79.00 ± 5.34 | 77.26 ± 8.41 | |||||||
| HVCX (affected features) | 5Juv | 10Juv | TDJuv vs 5Juv (p) | TDJuv vs 10Juv (p) | TDJuv vs Juv (p) | 5Juv vs 10Juv (p) | 5Juv vs Juv (p) | 10Juv vs Juv (p) | DF |
| Sag ratio | 0.042 ± 0.008 | 0.006 ± 0.000 | 0.69 | < 0.01 | < 0.01 | < 0.01 | < 0.01 | 0.99 | 27 |
| Afterdepolarization (mV) | 5.48 ± 1.05 | 1.11 ± 0.53 | 0.91 | 0.05 | 0.05 | < 0.01 | < 0.01 | 0.95 | 24 |
Mean values for each feature (± SEM) are presented. These measurements were compared with those of TDJuv and Juv birds, which are presented in Table 1. Features that showed statistically significant differences between groups are presented separately, along with the p-values and degrees of freedom (DF) for the Bonferroni-corrected pairwise comparisons.
Table 5.
Physiological features measured for HVCRA neurons from 5Juv and 10Juv
| HVCRA (stable features) | 5Juv | 10Juv | |||||||
|---|---|---|---|---|---|---|---|---|---|
| Vrest (mV) | −71.15 ± 2.50 | −66.33 ± 2.49 | |||||||
| Spike amplitude (mV) | 84.36 ± 7.44 | 67.61 ± 4.44 | |||||||
| τM (ms) | 24.23 ± 1.30 | 22.26 ± 4.53 | |||||||
| RM (MΩ) | 290.44 ± 50.19 | 304.86 ± 65.14 | |||||||
| CM (pF) | 90.15 ± 9.76 | 86.34 ± 26.50 | |||||||
| Spike frequency (Hz) | 4.76 ± 2.28 | 11.11 ± 4.01 | |||||||
| Adaptation rate | 1.59 ± 0.42 | 1.28 ± 0.18 | |||||||
| Spike latency (ms) | 44.83 ± 12.47 | 45.05 ± 16.07 | |||||||
| Spike width (ms) | 2.20 ± 0.17 | 2.30 ± 0.17 | |||||||
| Sag ratio | 0.01 ± 0.00 | 0.01 ± 0.00 | |||||||
| Afterdepolarization (mV) | 1.01 ± 0.36 | 1.17 ± 0.53 | |||||||
| Voltage drop (mV) | 26.80 ± 5.31 | 34.35 ± 7.54 | |||||||
| HVCRA (affected features) | 5Juv | 10Juv | TDJuv vs 5Juv (p) | TDJu vs 10Juv (p) | TDJuv vs Juv (p) | 5Juv vs 10Juv (p) | 5Juv vs Juv (p) | 10Juv vs Juv (p) | DF |
| Vrest (mV) | −71.15 ± 2.50 | −66.33 ± 2.49 | 0.22 | < 0.01 | < 0.01 | 0.39 | 0.02 | 0.47 | 29 |
| Spike amplitude (mV) | 84.36 ± 7.44 | 67.61 ± 4.44 | 0.53 | 0.82 | 0.03 | 0.18 | < 0.01 | 0.24 | 29 |
Mean values for each feature (± SEM) are presented. These measurements were compared with those of TDJuv and Juv birds, which are presented in Table 2. Features that showed statistically significant differences between groups are presented separately, along with the p-values and degrees of freedom (DF) for the Bonferroni-corrected pairwise comparisons.
Figure 4.
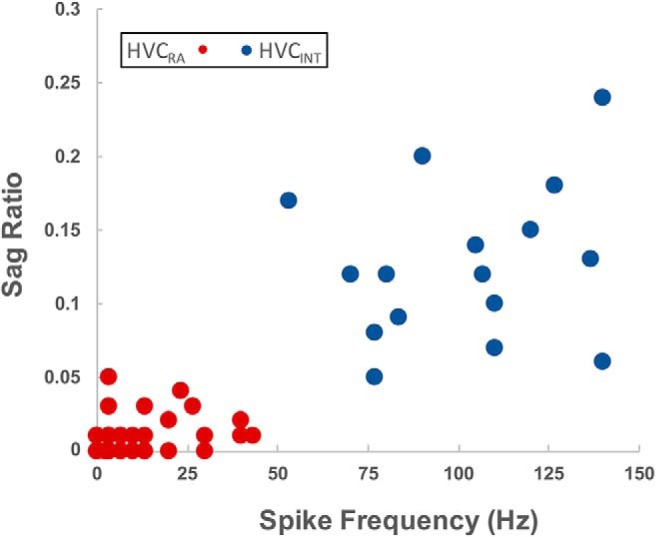
Segregation of putative HVCRA and HVCINT neurons. Unlabeled neurons were segregated based on similarity to the physiological phenotype of adult HVCRA and HVCINT neurons (Daou et al., 2013). This plot of two of the key discriminating features, sag ratio and spike frequency, shows the clustering of the two groups (red = HVCRA, blue = HVCINT).
Effect of tutor deprivation on the intrinsic physiology of HVC
The first set of experiments compared the intrinsic physiology of Juv neurons, those with normal tutor exposure, TDJuv neurons, those with no exposure to a tutor, and Adult neurons. The results show that tutor deprivation has a clear effect on the intrinsic physiology of HVC projection neurons. Separate between-subjects ANOVAs, comparing Juv, TDJuv and Adult neurons, were performed for each physiological feature for each neuron type. HVCX neurons showed statistically significant differences between groups in aspects of their hyperpolarizing response: sag ratio [F(2,27) = 15.1, corrected p < 0.01] and rebound depolarization [F(2,17) = 11.53, corrected p = 0.008]. Two aspects approached statistical significance: the magnitude of the voltage drop (F(2,27) = 4.41, uncorrected p = 0.02), along with changes in spike amplitude evoked by depolarizing current (F(2,27) = 4.5, uncorrected p = 0.02), but because Bonferroni correction brings those probabilities to 0.2, no claims of statistical differences are made based on this sample. HVCRA neurons showed statistically significant differences between groups in their Vrest (F(2,32) = 50.0, corrected p < 0.01) and spike amplitude (F(2,32) = 8.2, corrected p = 0.016). Fewer features were measured on HVCINT neurons because they showed no developmental changes (Ross et al., 2017) and rebound depolarization could not be measured because all cells showed action potentials upon release from the hyperpolarizing current pulse. This sample did, however, show a statistically significant variation in spike amplitude (F(2,19) = 7.25, p = 0.036, using Bonferroni correction for 8 ANOVAs). Details of the pairwise comparisons between these three groups are presented in the following sections. Overall, when comparing TDJuv projection neurons with those of Adults, there is a striking similarity in their intrinsic physiology despite the difference in age and singing behavior. This is in contrast to the notable age-dependent difference in physiology observed between normal Juv and Adults (Ross et al., 2017).
HVCX neurons
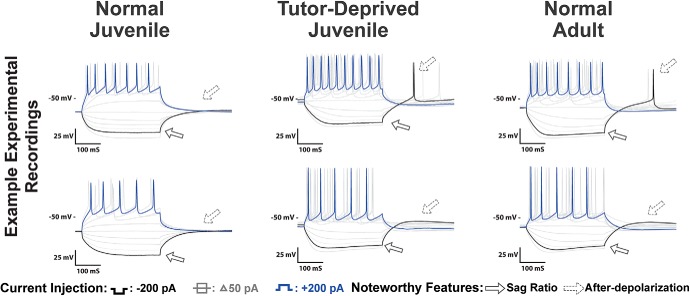
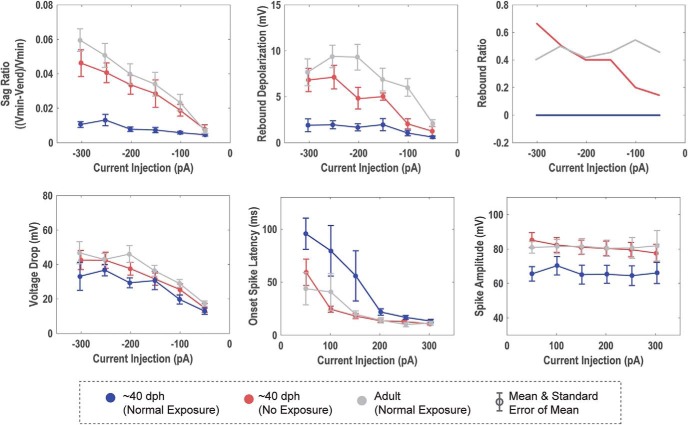
Figure 5 shows multiple examples of the physiological response of subsong HVCX neurons as a function of tutor exposure. A total of n = 8 TDJuv HVCX neurons were recorded from 5 birds, ranging from 1 to 3 neurons recorded per bird. A total of n = 11 Juv HVCX neurons were recorded from 4 birds, ranging from 2 to 4 recordings per bird. A total of n = 12 normal adult HVCX neurons were recorded from 7 birds, ranging from 1 to 4 recordings per bird. Figures 6 and 7 show the mean response for all neurons across current injections for many of the features analyzed. Statistical comparisons were made at select current injections and individual data for key features are shown later in Figure 11. Two features showed statistically significant differences between TDJuv and Juv, whereas other features remained stable despite exposure, or lack thereof, to a tutor (Table 1).
Figure 5.
Voltage traces of HVCX neurons for Juv, TDJuv and Adult. Features that showed experiential differences included an increase in the sag ratio and an increase in rebound depolarization. The TDJuv HVCX neurons had a greater similarity to Adult than to Juv. The two rows provide two different examples from each group.
Figure 6.
Tutor deprivation alters the intrinsic physiology of HVCX neurons: The averaged response of HVCX neurons for the Juv, TDJuv, and Adult. Tutor exposure showed statistically significant effects on the sag ratio, rebound depolarization, and rebound spike ratio and trended toward differences in onset spike latency and spike amplitude of HVCX neurons. Tutor exposure did not show an effect on the voltage drop of HVCX neurons. The TDJuv exhibited physiology that was much more similar to the Adult than to the Juv.
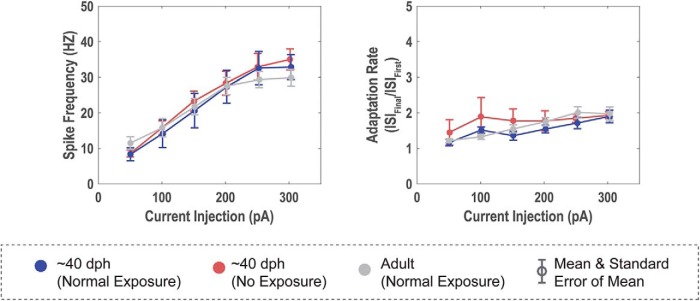
Figure 7.
Firing rate and adaptation rate show no differences between groups. A, Rates of action potentials produced in HVCX neurons to suprathreshold depolarizing stimuli. Note that the input–output functions for the three groups do not show consistent differences across the range of currents tested; these are average rates across the 300 ms current pulse. B, Adaptation rates across these 300 ms pulses also do not differ between groups. This is in contrast to the statistically significant differences observed in these same cells to hyperpolarizing current injection (Figs. 5, 6).
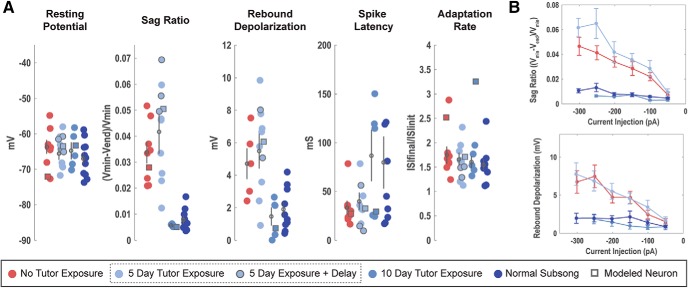
Figure 11.
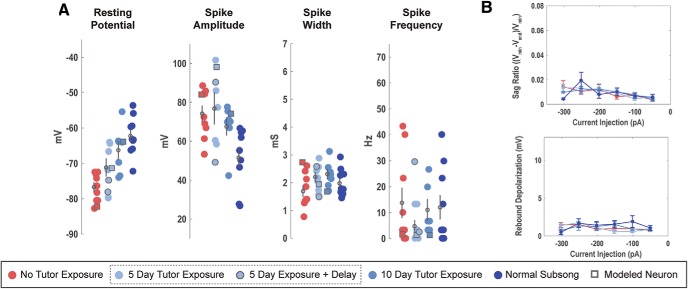
Changes in HVCX neurons as a function of variable tutor exposure: A, Each scatterplot depicts a physiological feature of interest where each point represents measurement from a single neuron. The means and SEMs are plotted over each dataset. For the 5 d exposure data, features measured from birds tutored 5 d (30–35 dph) and then isolated for 5 d (35–40 dph) are plotted separately as outlined dots and were not entered into the plotted mean and SEM. The remaining circles are features measured from birds immediately after 5 d (35–40 dph) of tutor exposure. B, Mean (±SEM) for sag ratio and rebound depolarization across a range of current injection amplitudes.
Passive membrane properties
The passive membrane properties of HVCX neurons did not vary as a function of tutor deprivation or age. The Vrest, τM, RM, and capacitance did not show statistically significant variation. The Vrest was an average of −67.00 ± 1.51 mV for Juv HVCX neurons and −63.66 ± 1.93 mV for tutor-deprived HVCX neurons.
Response to hyperpolarizing applied current
For quantitative comparisons, responses to −200 pA current injections were analyzed when measuring the hyperpolarizing response of the cell. TDJuv showed a significantly greater sag ratio at an average of 0.034 ± 0.003 compared with Juv, which had an averaged sag ratio of 0.008 ± 0.001. The TDJuv sag ratio was not significantly different from that of the Adult at an average of 0.040 ± 0.006. Similarly, TDJuv had an increased rebound depolarization response compared with Juv. In adults, this rebound depolarization can often result in a rebound spike, a feature not observed in the Juv. This feature is, however, present in the TDJuv. To compare the presence of rebound spiking, the ratio of neurons that exhibit rebound spiking is calculated against the cells that do not exhibit rebound spiking. Like Adult HVCX neurons, TDJuv HVCX neurons can exhibit rebound firing, whereas this feature was not observed in Juv. At −200 pA, ∼38% of TDJuv HVCX neurons (3 of 8) exhibited rebound spiking compared with ∼42% (5 of 12) observed in the Adult. At −250 pA this ratio grew to 50% for TDJuv and 50% for Adult. The Juv never exhibited rebound spiking at any of the applied current injections. The data suggest that the threshold for rebound spiking is greater in the TDJuv than in the Adult because Adult HVCX neurons more readily exhibited rebound spiking at smaller hyperpolarizing currents than the TDJuv. Despite this difference, it remains telling that this feature is present in Adult and TDJuv, but not the Juv. For a better comparison of the rebound response, the neurons that exhibited rebound spiking were removed from the rebound depolarization measurement because they would heavily weight the mean voltage depolarization toward the rebound spike amplitude. The results show that TDJuv HVCX neurons have an average rebound depolarization of 4.71 ± 0.94 mV, whereas the Juv have an average of 1.68 ± 0.39 mV. The response of the TDJuv is not significantly different from the response of the Adult at 8.06 ± 1.88 mV, whereas it is statistically different from that of the Juv.
Response to depolarizing applied current
Tutor deprivation had less dramatic effects on the depolarizing response of HVCX neurons than it did on the hyperpolarizing response. This is not surprising because Ross et al. (2017) showed that many of the depolarizing responses of HVCX neurons were more stable across development than the hyperpolarizing responses. On average, the TDJuv HVCX neurons had spikes that were faster (1.89 ± 0.13 ms) and of greater amplitude (80.68 ± 4.25 mv) than the Juv neurons, at 2.19 ± 0.14 ms and 64.65 ± 4.98 mV, respectively. The average spike width and spike amplitude of TDJuv was more similar to the adult (1.89 ± 0.13 ms and 82.04 ± 4.49 mV, respectively). The differences in spike amplitude and width, however, were not statistically significant following Bonferroni correction for multiple ANOVAs. Across current injections, TDJuv HVCX neurons showed a trend toward a shortened spike onset latency compared with the tutor-exposed juveniles. Again, the response of the TDJuv neurons was more similar to the Adult than to that of Juv. HVCX neurons exhibited a similar degree of spike frequency adaptation regardless of tutor exposure.
HVCRA neurons
Figure 8 shows multiple examples of the physiological response of subsong HVCRA neurons as a function of tutor exposure. A total of n = 9 tutor-deprived HVCRA neurons were recorded from 5 birds, ranging from 1 to 3 recordings per bird. A total of n = 10 normal subsong HVCRA neurons were recorded from 5 birds, ranging from 1 to 4 recordings per bird. A total of n = 16 Adult HVCRA neurons were recorded from 8 birds, ranging from 1 to 3 recordings per bird. Figure 9 shows the distributions of Vrest for all cells and the mean response for all neurons across current injections for many of the other features analyzed. Statistical comparisons were made at select current injections. Two features showed statistically significant differences between TDJuv and Juv, whereas other features remained stable despite exposure, or lack thereof, to a tutor. The final results for all of the features measured can be found in Table 2.
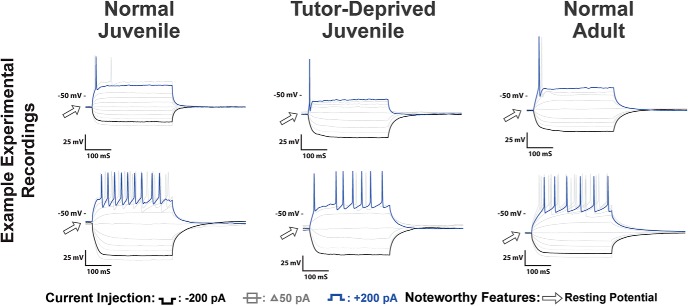
Figure 8.
Voltage traces of HVCRA neurons for Juv, TDJuv, and Adult. Some of the more prominent changes as a result of tutor deprivation were a decrease in the Vrest and an increase in spike amplitude of HVCRA neurons. The TDJuv HVCRA neurons had a greater similarity to Adults than to Juv. The two rows provide two different examples from each group.
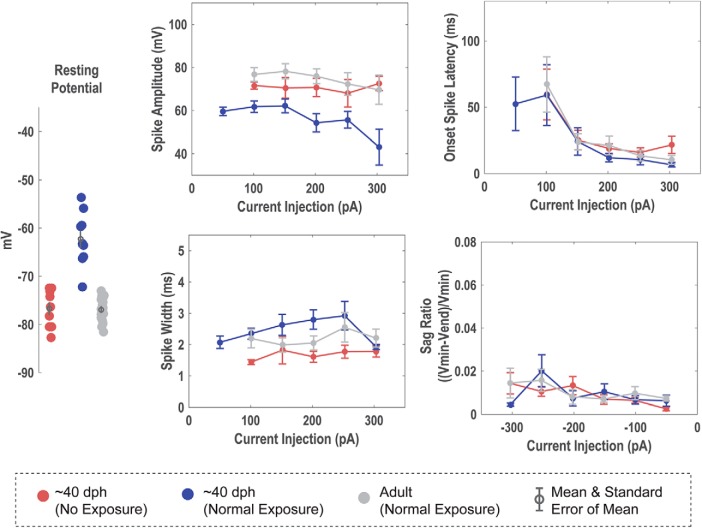
Figure 9.
Tutor deprivation alters the intrinsic physiology of HVCRA neurons: Left, Vrest for each neuron along with the group mean and SEM. Right, Average feature response across current injections and the SEM.
Passive membrane properties
One of the major findings in Ross et al. (2017) was that the Vrest of HVCRA neurons shifted downwards during song learning such that the Vrest of the adult was much lower than that of the juveniles. The Vrest of the TDJuv neurons was significantly lower at −76.71 ± 1.31 mV than tutor-exposed neurons at −62.31 ± 1.71 mV, showing more similarity to the Adults at −76.92 ± 0.64. τM, RM, and CM showed no large or consistent change as a result of tutor exposure.
Response to hyperpolarizing applied current
Both Adult and Juv HVCRA neurons showed no sag and little if any rebound depolarization to hyperpolarizing currents (Ross et al., 2017). Tutor deprivation did not result in any significant difference across any of the hyperpolarizing features that were measured.
Response to depolarizing applied current
Juv HVCRA neurons had an average spike amplitude of 53.30 ± 4.88, which is significantly lower than that observed in adults at 76.50 ± 3.89. The TDJuv HVCRA neurons had a spike amplitude of 74.10 ± 4.19 and was significantly different from the Juv, but not from the Adult. When comparing the average onset spike width for each current injection, there is a trend toward wider spikes in the Juv than the Adult. The spike width for TDJuv was more similar to the Adult than to the Juv.
HVCINT neurons
HVCINT neurons were recorded to identify any possible physiological effects of tutor deprivation. A total of n = 5 TDJuv HVCINT neurons were recorded from 4 birds, ranging from 1 to 2 neurons recorded per bird. A total of n = 6 Juv HVCINT neurons were recorded from 4 birds, ranging from 1 to 2 recordings per bird. A total of n = 11 normal adult HVCINT neurons were recorded from 4 birds, ranging from 1 to 5 recordings per bird. Ross et al. (2017) previously showed that the intrinsic physiology showed no consistent changes across development. Given this, we hypothesized little change as a result of song exposure. One unexpected result is that spike amplitude may be influenced by tutor deprivation. The amplitude of the first spike evoked by a depolarizing current injection was greater in TDJuv cells than in Adult neurons. The TDJuv amplitude was not statistically different than the Juv, however, nor was the normal Juv different than Adult (Ross et al., 2017). The full results from these neurons can be seen in Table 3. As a population, HVCINT physiology seems to be more developmentally stable compared with projection neurons and are established before auditory learning.
Tutor exposure recovers the effect of tutor deprivation
The results from the tutor deprivation experiments show that tutor exposure altered specific physiological features. The following experiments test the hypothesis that limited tutor exposure will offset the effect of tutor deprivation. Furthermore, they explore the duration of exposure required to shift the physiology of TDJuv to be consistent with their normal tutor-exposed counterparts, effectively creating a dose–response curve of tutor exposure and physiology. Features were analyzed using ANOVA on the data from four groups: TDJuv, 5Juv, 10Juv, and Juv. This effectively produces a “dose–response” curve for tutor exposure duration while comparing cells at the same age after hatching. Statistically significant results were followed up with Bonferroni-corrected pairwise comparison. The results show that 10 d of tutor exposure before electrophysiological recording can fully rescue the physiology of HVCX neurons and partially recover the physiology of HVCRA neurons, suggesting a possible difference in the timescale of tutor exposure's effect on intrinsic physiology. Five days of tutor exposure was not sufficient to shift the intrinsic physiology of HVC projection neurons in a meaningful way. Because the HVCINT neurons did not show significant developmental changes in their intrinsic physiology, they were not included in these experiments.
HVCX neurons
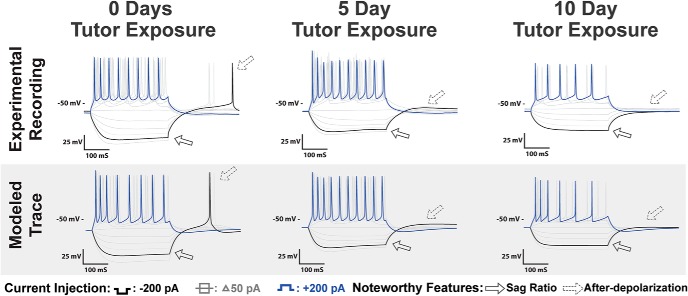
Figure 10 shows examples of the physiological response of subsong HVCX neurons as a function of variable tutor exposure and corresponding fits of computational models of these cells. A total of n = 8 5 d exposure HVCX neurons were recorded from 3 birds, ranging from 2 to 4 neurons recorded per bird. A total of n = 5 10 d exposure HVCX neurons were recorded from 4 birds, ranging from 1 to 2 neurons recorded per bird. These recordings were compared with the TDJuv and Juv data presented earlier. Figure 11 shows the data points and mean response of all neurons for many of the features analyzed at select current injections. Because one of the major changes was in the hyperpolarizing response, Figure 11 shows the mean response across current injections for sag ratio and rebound depolarization. Statistical comparisons were made at select current injections. Two features showed statistically significant differences as a function of increased tutor exposure, whereas some features remained stable across exposure time to a tutor. The final results for all of the features measured can be found in Table 4.
Figure 10.
HVCX recordings as a function of variable tutor exposure: Top, Voltage traces of HVCX neurons recorded with 0, 5, and 10 d of tutor exposure before recording. Features that changed as a consequence of increased tutor exposure included a decreased sag ratio and rebound depolarization and diminished rebound spike ratio. There was also an increase in the onset spike latency for moderate current injections. Bottom, Simulations of biophysical models calibrated to the experimental traces with current pulses of ±200 pA. The models predict that tutor exposure results in several parameter changes, as discussed in the Results.
The results show that 5 d of tutor exposure before electrophysiological recording was insufficient to rescue the physiological profile of HVCX neurons from tutor deprivation. However, 10 d of exposure was sufficient to rescue HVCX intrinsic physiology, making the 10Juv indistinguishable from the Juv.
Passive membrane properties
The passive membrane properties of HVCX neurons were not affected by tutor exposure and showed no significant changes as a result.
Response to hyperpolarizing applied current
Both sag ratio and rebound depolarization showed statistically significant differences between groups (F(3,27) = 14.3, F(3,24) = 7.9, respectively, corrected p < 0.01). 10Juv neurons showed significantly less sag than 5Juv neurons, averaging a sag ratio of 0.006 ± 0.000 and 0.042 ± 0.008, respectively. The 10 d birds were not significantly different from the Juv. Similarly, 10 d of exposure reduced the rebound depolarization to 1.11 ± 0.53 mV, significantly less than that observed in the 5Juv at 5.48 ± 1.05. Again, the 10 d exposure was not significantly different from the Juv. Rebound spiking was not observed in any of the 5 or 10 d exposure birds; however, the rebound depolarization observed in the 5Juv was not different from that observed in the TDJuv.
Response to depolarizing applied current
Variable tutor exposure had less dramatic effects on the depolarizing response of HVCX neurons than it did on the hyperpolarizing response. 5Juv HVCX neurons had an average spike width of 2.16 ± 0.08 ms and an average amplitude of 79.00 ± 5.34 mV. 10Juv HVCX neurons had an average spike width of 2.52 ± 0.62 ms and an average amplitude of 77.26 ± 8.41 mV. These values were not significantly different across exposure groups. As shown in Figure 11, normal Juv showed a greater variation in spike latency to depolarizing currents than TDJuv. The spike latency of 10Juv was much more similar at 86.81 ± 25.95 ms to normal juveniles at 79.61 ± 26.40 ms than it was to either 5 d exposure birds or tutor-deprived birds at 39.95 ± 8.56 ms and 33.31 ± 6.87 ms, respectively. All HVCX neurons, regardless of tutor exposure, exhibited a similar degree of spike frequency adaptation.
Determination of the likely sources of tutor-induced physiology changes in HVCX neurons
We used mathematical modeling to determine which ionic current properties changed with tutor exposure. The biophysical models are briefly described in the Materials and Methods and are described in detail in Ross et al. (2017). Parameters in each model were calibrated to current-clamp data from a single neuron with pulses of ±200 pA (voltage traces highlighted in Fig. 10) and modeled responses to other applied currents were then generated to examine the quality of the fit (light gray voltage traces). Different calibrations were made for different durations of tutor exposure. Model calibration was focused primarily on the responses to hyperpolarizing current pulses because the major tutor-induced changes in HVCX neurons occurred under such conditions.
Figure 10 (bottom) shows the model neuron traces corresponding to neurons with 0, 5, and 10 d of tutor exposure. As shown in the data, there is a sag in response to hyperpolarizing current corresponding to 0 and 5 d exposure, but not 10 d exposure. There is also a rebound spike with 0 d exposure that is not present with tutor exposure. Spike frequency is also considerably lower for model neurons corresponding to 10 d exposure. These features are quantified in Figure 11, plotted along with features from the population of neurons.
To quantify changes in maximum conductance with tutor duration, we scaled the maximum conductance parameter by the CM for each case. Because the impact that a channel has on membrane dynamics depends on CM, this scaling serves to normalize results for the effects of different capacitances. In the models, there was an ≈78% decrease in the scaled T-type Ca2+ current conductance when comparing 10 d tutor exposure with 0 d exposure. This decrease explains the lack of a rebound spike or rebound depolarization in the 10 d exposure model neurons. There was also an ≈137% increase in the fraction of h-type inward current that activates rapidly versus slowly. This increase is responsible for the less hyperpolarized voltage during the negative current pulse and the reduction in sag for 10 d tutor exposure versus 0 d exposure. The difference in spike frequency among the groups in the model cells is due primarily to the variation in the scaled M-current conductance. There was an ≈23% increase in its scaled conductance when comparing 10 d tutor exposure with 0 d exposure. Meanwhile there was an ≈45% decrease in its scaled conductance when comparing 5 d tutor exposure with 0 d exposure.
HVCRA neurons
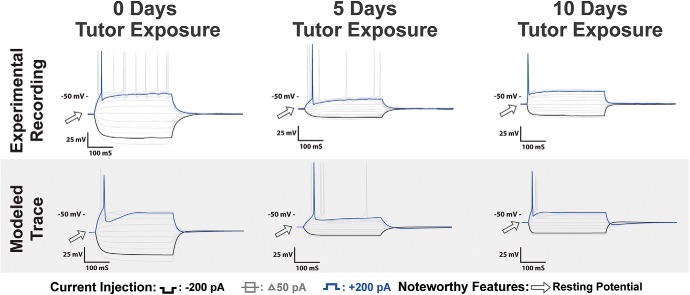
Figure 12 shows examples of the physiological response of subsong HVCRA neurons as a function of variable tutor exposure, along with the output of computational models of these cells. A total of n = 7 5 d exposure HVCRA neurons were recorded from 4 birds, ranging from 1 to 3 recordings per bird. A total of n = 7 10 d exposure HVCRA neurons were recorded from 4 birds, ranging from 1 to 3 recordings per bird. These recordings were compared with the TDJuv and Juv data presented earlier. Figure 13 shows the data points and mean response of all neurons for many of the features analyzed at select current injections. It also shows the mean response across current injections for sag ratio and rebound depolarization. Statistical comparisons were made at select current injections. The final results for all of the features measured can be found in Table 5.
Figure 12.
HVCRA recordings as a function of variable tutor exposure: Top, Voltage traces of HVCRA neurons recorded with 0, 5, and 10 d of tutor exposure before recording. Features that changed as a consequence of increased tutor exposure included an increased Vrest and decreased spike amplitude. Bottom, Simulations of biophysical models calibrated to the experimental traces with current pulses of ±200 pA. The models predict that tutor exposure results in several parameter changes, as discussed in the Results.
Figure 13.
Changes in HVCRA neurons as a function of variable tutor exposure. A, Each scatterplot depicts a physiological feature of interest where each point represents measurement from a single neuron. The means and SEMs are plotted over each dataset. Features values from model simulations shown in Figure 12 are shown by filled squares. For the 5 d exposure data, features measured from birds tutored 5 d (30–35 dph) and then isolated for 5 d (35–40 dph) are plotted separately as outlined dots and were not entered into the plotted mean and SEM. The remaining circles are features measured from birds immediately after 5 d (35–40 dph) of tutor exposure. B, Average feature response across current injections and the SEM.
The results show that neither 5 nor 10 d of tutor exposure was sufficient to fully rescue the physiology of HVCRA neurons from tutor deprivation; however, increased exposure did induce increased recovery. This suggests that the effect of tutor exposure on the intrinsic physiology of HVCRA neurons may function on a longer timescale than on HVCX neurons.
Passive membrane properties
There was a statistically significant difference between groups in Vrest (F(3,29) = 11.3, corrected p < 0.01). Increased tutor exposure shifted the Vrest of HVCRA neurons upward. The average Vrest was −71.15 ± 2.50 for 5 d of exposure and −66.33 ± 2.49 for 10 d of exposure. The Vrest of the 5 d exposure birds was not statistically different from the TDJuv at −76.71 ± 1.31 mV, but was significantly different from the normal tutor-exposed birds at −62.31 ± 1.71 mV. In contrast, the 10 d exposure group was significantly different from the TDJuv, but was not significantly different from the normal tutor-exposed birds. The remaining passive membrane properties were not affected by tutor exposure and showed no significant changes as a result.
Response to hyperpolarizing applied current
Variable tutor exposure had little effect on the hyperpolarizing response of HVCRA neurons.
Response to depolarizing applied current
Across the four groups, there was statistically significant change in spike amplitude (F(3,29) = 6.4, corrected p = 0.022). Pairwise comparisons showed that the spike amplitude in TDJuv (74.10 ± 4.19 mv) did not differ from either 5Juv (84.36 ± 7.44) or 10Juv (67.61 ± 4.44) groups. This result trended such that increased tutor exposure resulted in a spike amplitude more similar to that observed in normally exposed juveniles, such that only the 5Juv amplitudes differed significantly from those of the Juv group.
Determination of the likely sources of tutor-induced physiology changes in HVCRA neurons
As we did with HVCX neurons, we calibrated biophysical models to representative HVCRA neurons for 0, 5, and 10 d of tutor exposure. Voltage traces from the model neurons match the increase in Vrest that is the key feature affected by tutor exposure (Figs. 12, 13). Because one of the main findings was a change in Vrest, the models provide somewhat less specific hypotheses than in the case of HVCX neurons. The key driver for this change in Vrest in the model is a 17 mV increase in the equilibrium potential for the leak current. The change in equilibrium potential might be set up by a change in ion pump activity, affecting such things as Cl− concentrations, but the underlying mechanism for this change has not been determined. With the increase in leak equilibrium potential, a 75% increase in the leak conductance was also made to prevent the cell from spiking more than once during depolarization with a 200 pA applied current. The reduction in spike amplitude that comes with tutor exposure is predicted to be primarily due to an ≈37% reduction in the τM for delayed rectifier activation.
Tutor exposure timing in relation to physiological changes
One potential confound in comparing the 5Juv and 10Juv groups is the 10Juv group had 5 extra days between the beginning of exposure and the day of recording. Therefore, the difference could be because of the passage of time since the beginning of tutor exposure, not because of the amount of exposure. To evaluate this possibility, a limited number of neurons were recorded from juveniles that had 5 d of tutor exposure followed by 5 d of no exposure. This equates the time between the beginning of exposure and the recording day in the 5 and 10 d exposure groups. A total of n = 3 5E5DJuv HVCX neurons were recorded from 2 birds, ranging from 1 to 2 recordings per bird. A total of n = 2 5E5DJuv HVCRA neurons were recorded from 2 birds, with 1 recording per bird. Figure 14 shows example traces from HVCX and HVCRA neurons. Individual data points for various measured features are incorporated into Figures 11 and 13. Both HVCX and HVCRA neurons exhibited similar physiology to the 5Juv group despite having 5 additional days of delay between exposure and recording.
Figure 14.
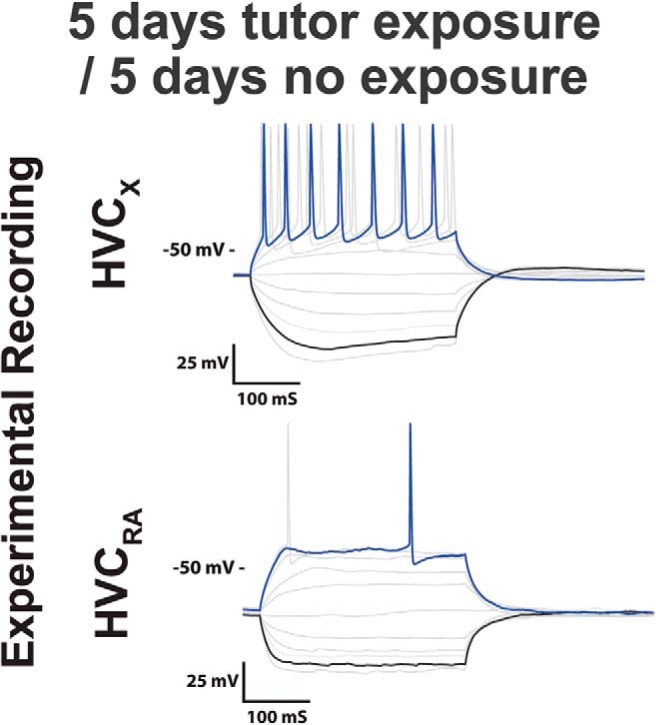
Example traces of juvenile neurons with 5 d of tutor exposure followed by 5 d of no exposure. The physiological profile of neurons with 5 d of tutor exposure followed by 5 d of no exposure were indistinguishable from traces that only had 5 d of exposure immediately followed by electrophysiological recording. This suggests that the amount of exposure is of greater importance than the delay between exposure and physiology for shaping the physiological profile of these neurons at the time points studied.
Comparison of 5E5DJuv cells to the Juv group showed statistically significant differences that are similar to the previous 5Juv versus Juv comparisons. Specifically, 5E5DJuv HVCX cells had greater sag ratio (t(11) = 12.4, p < 0.01) and afterdepolarization (t(10) = 4.8, p < 0.01) than normally tutored birds, but did not differ on these measures from the 5Juv birds (t(9) = 1.2, p = 0.26 and t(8) = 0.61, p = 0.59, respectively). 5E5DJuv HVCRA neurons had a higher Vrest than Juv birds (t(10) = 3.55, p = 0.005), but did not differ from the 5Juv birds (t(7) = 1.1, p = 0.30). The difference in spike amplitude did not reach statistical significance for the comparison of 5E5DJuv with Juv, but, for unknown reasons, this measure was highly variable in our relatively small sample of 5E5DJuv cells (SEM = 21.63 mv). Overall, the data suggest that the amount of exposure appears more important than the timing of exposure within the 10 d period studied.
Discussion
These experiments were motivated by the goal of understanding the neurobiological changes that underlie learning. The model system, song learning, requires that a juvenile bird hear and memorize the song of an adult tutor. In the zebra finch, auditory learning involves the proper functioning of the telencephalic nucleus HVC (Roberts et al., 2012). Therefore, these experiments focused on the HVC neurons and how they change in response to tutor exposure. Rather than looking for experience-dependent synaptic changes in HVC (Roberts et al., 2010), these experiments explored the hypothesis that experience shapes the intrinsic physiology of HVC neurons. This hypothesis stems from the fact that the activity of a neural circuit could be changed by altering either the synapses between neurons or by altering the intrinsic properties of the component neurons in that circuit. We previously reported (Ross et al., 2017) that the intrinsic properties of HVC projection neurons changed over the course of development and that the magnitude of these changes is sufficient to change the input–output function of a simple hypothetical neural circuit. As a follow-up, the present experiments sought to determine whether such changes are driven by auditory experience. If so, then these experience-dependent changes in a neuron's individual function, an intrinsic plasticity, may be part of the neurobiological basis of sensory learning.
The results showed that tutor exposure drives cell-type-specific intrinsic plasticity in HVC projection neurons. Counterintuitively, tutor deprivation did not “arrest” physiological development, but rather resulted in neurons in a juvenile bird sharing the physiological phenotype of the adult. Our experiments showed that varying the amount of tutor exposure influenced the intrinsic plasticity of HVC projection neurons in a “dose-dependent” manner, such that increased exposure led to greater physiological change. The HVCX neurons exhibited a tutor-exposure-dependent decrease in their sag ratio and rebound depolarization, leading to fewer neurons showing rebound action potentials following a hyperpolarizing pulse. HVCRA neurons exhibited tutor-exposure-dependent decreases in their Vrest and spike amplitude. Biophysical models were used to interpret these physiological changes in terms of which ion channels may underlie the observed intrinsic plasticity. These changes are most pronounced at low voltages, such as those attained during application of hyperpolarizing current pulses. Based on analyses of the models, it appears that the primary effect of tutor exposure observed during and after hyperpolarizing pulses in HVCX neurons was a reduction of T-type Ca2+ current conductance, as well as a significant increase in the fraction of h-current that activates rapidly versus slowly. In HVCRA neurons, model analysis suggests that the marked increase in the Vrest driven by tutor exposure is due to changes in the equilibrium potential for the leak conductance, T-type Ca2+ conductance, and h-current conductance. These findings show that tutor exposure can drive experience-dependent cell-specific intrinsic plasticity in HVC neurons, providing HVC with a dimension beyond solely manipulating synaptic strength by which it can be modified to encode novel information.
Timing of song learning and tutor exposure
The amount of song exposure needed to see normal levels of intrinsic plasticity compares well with the amount of exposure needed for finches to learn and produce an accurate copy of the tutor's song. Roper and Zann (2006) found that 10 d of tutor exposure as a juvenile (from 25 to 35 dph) was sufficient for an adult bird to produce an accurate copy of the tutor's song. Our results suggest that 10 d of tutor exposure (from 30 to 40 dph) is sufficient to produce levels of physiological changes equal to those observed in normally raised juveniles, fully reversing the effects of tutor deprivation on HVCX neurons. Roper and Zann (2006) also found that 5 d of exposure (from 25 to 30 dph) was insufficient to produce an accurate song copy. In the present studies, 5 d of exposure (at either 30–35 dph or 35–40 dph) was insufficient to restore normal juvenile-like physiology.
In contrast to the prolonged exposure necessary for intrinsic plasticity and behavioral song copying, Roberts et al. (2010) found that tutor exposure produced rapid synaptic changes in HVC in just 24 h. The juveniles that they studied were between 60 and 90 dph. Even though the birds showed rapid spine stabilization immediately following tutor exposure, they showed limited learning. These birds at best copied up to 40% of the song given 3 d of tutor exposure. The limited amount of copying is unsurprising given the results of Roper and Zann (2006), but it does suggest that there may be other experience-dependent mechanisms of learning that function on larger timescales than synaptic stabilization. The data from our experiments suggest that experience-dependent changes in intrinsic physiology could be that mechanism. A limitation of the present studies and existing studies on synaptic changes is the unknown specificity of these changes. Both types of changes are observed when evaluated across the population of HVC neurons. A more nuanced approach will be needed to account for different aspects of song learning such as the independent acquisition of syllable repertoire and syllable sequence (Lipkind et al., 2017) or the acquisition of new syllables while protecting the encoding of already-learned syllables (Ravbar et al., 2012).
Experience-dependent changes and the “critical period” for learning
The results of Ross et al. (2017) combined with the present results suggest that tutor exposure transiently suppresses specific ion channels in HVC projection neurons. What is the advantage of these transient intrinsic changes for learning? If channel changes constitute “what is learned,” then one would expect them to be relatively permanent. In the following, we propose a model of how channel suppression produced by tutor exposure may work in concert with synaptic plasticity to establish vocal learning and that the later reemergence of these channels provides stabilization of that learning.
There is evidence that the ion channels hypothesized to change in HVC have a role in learning in other model systems. Nolan et al. (2004) showed that mice with an HCN1 knock-out, one of the four known subtypes responsible for Ih, show increased long-term potentiation, a common synaptic proxy for learning, at the perforant path input of CA1 hippocampal neurons. However, the HCN1 knock-outs also exhibited synaptic connectivity that was less stable in the long term. Broadly speaking, learning requires two major steps: a change in the circuit followed by a stabilization of that change. The maintenance of a circuit is just as important as the alteration of the circuit resulting from the experience that elicited the change. In a learning juvenile, the HVC circuit needs to be more flexible and unstable to allow for a greater change in circuitry. Based on the Nolan et al. (2004) findings, the suppression of Ih by tutor exposure may place HVC neurons in this more malleable state. As the song is learned, the circuit must be stabilized to allow for the unchanging, highly stereotyped vocal pattern that is typical in the adult zebra finch. The reemergence of higher levels of Ih in adulthood may serve to close the circuit to further changes. A similar argument could be made with regard to the changes in Vrest in HVCRA neurons. Tutor exposure results in a more depolarized membrane potential. This could result in cells being more prone to synaptic plasticity by traditional NMDA-dependent mechanisms because depolarized cells would be closer to the potential needed to remove the Mg2+ blockade of the NMDA channel. Again, the more hyperpolarized Vrest that emerges later in development could work to stabilize the system in adulthood. Together, these changes in the intrinsic properties of neurons could constitute a biological mechanism for learning that is restricted to a “critical period.”
It is interesting that the direction of the effect of tutor exposure on currents such as Ih is through the inhibition of the adult-like physiological phenotype rather than an experience-dependent increase in the expression of ion channels. The tutor deprivation data suggest that the adult-like phenotype is the “default” phenotype. This is not unreasonable because the neuron will exist in this phenotype for a greater duration of the finch's life. The hypothesis that suppression of specific currents enhances learning and that they then reemerge to stabilize changes leads to a number of predictions. For example, one might expect that seasonal songbirds, in addition to the previously observed changes in neuronal morphology and density, would show a seasonal shift in channel expression and a corresponding seasonal variation in the capacity for synaptic plasticity as they learn new vocal patterns (Brenowitz, 2004).
Even if this modulation and stabilization of learning is not the ultimate role of the observed changes in ion channels, the present experiments add to a relatively small but growing body of research on the role of experience-dependent intrinsic plasticity in learning (Zhang and Linden, 2003; Mozzachiodi and Byrne, 2010). The present results emphasize the point that intrinsic plasticity should be more widely considered when exploring the mechanisms of learned behaviors.
Footnotes
This work was supported by the National Science Foundation (Grant IOS 1656360).
The authors declare no competing financial interests.
References
- Aronov D, Andalman AS, Fee MS (2008) A specialized forebrain circuit for vocal babbling in the juvenile songbird. Science 320:630–634. 10.1126/science.1155140 [DOI] [PubMed] [Google Scholar]
- Basista MJ, Elliott KC, Wu W, Hyson RL, Bertram R, Johnson F (2014) Independent premotor encoding of the sequence and structure of birdsong in avian cortex. J Neurosci 34:16821–16834. 10.1523/JNEUROSCI.1940-14.2014 [DOI] [PMC free article] [PubMed] [Google Scholar]
- Brainard MS, Doupe AJ (2002) What songbirds teach us about learning. Nature 417:351–358. 10.1038/417351a [DOI] [PubMed] [Google Scholar]
- Brenowitz EA. (2004) Plasticity of the adult avian song control system. Ann NY Acad Sci 1016:560–585. 10.1196/annals.1298.006 [DOI] [PubMed] [Google Scholar]
- Daou A, Ross MT, Johnson F, Hyson RL, Bertram R (2013) Electrophysiological characterization and computational models of HVC neurons in the zebra finch. J Neurophysiol 110:1227–1245. 10.1152/jn.00162.2013 [DOI] [PubMed] [Google Scholar]
- Day NF, Terleski KL, Nykamp DQ, Nick TA (2013) Directed functional connectivity matures with motor learning in a cortical pattern generator. J Neurophysiol 109:913–923. 10.1152/jn.00937.2012 [DOI] [PMC free article] [PubMed] [Google Scholar]
- Elliott KC, Wu W, Bertram R, Johnson F (2014) Disconnection of a basal ganglia circuit in juvenile songbirds attenuates the spectral differentiation of song syllables. Dev Neurobiol 74:574–590. 10.1002/dneu.22151 [DOI] [PMC free article] [PubMed] [Google Scholar]
- Fehér O, Wang H, Saar S, Mitra PP, Tchernichovski O (2009) De novo establishment of wild-type song culture in the zebra finch. Nature 459:564–568. 10.1038/nature07994 [DOI] [PMC free article] [PubMed] [Google Scholar]
- Franzen DL, Gleiss SA, Berger C, Kümpfbeck FS, Ammer JJ, Felmy F (2015) Development and modulation of intrinsic membrane properties control the temporal precision of auditory brainstem neurons. J Neurophysiol 113:524–536. 10.1152/jn.00601.2014 [DOI] [PubMed] [Google Scholar]
- Funabiki Y, Konishi M (2003) Long memory in song learning by zebra finches. J Neurosci 23:6928–6935. 10.1523/JNEUROSCI.23-17-06928.2003 [DOI] [PMC free article] [PubMed] [Google Scholar]
- Hong H, Rollman L, Feinstein B, Sanchez JT (2016) Developmental profile of ion channel specializations in the avian nucleus magnocellularis. Front Cell Neurosci 10:80. 10.3389/fncel.2016.00080 [DOI] [PMC free article] [PubMed] [Google Scholar]
- Lipkind D, Zai AT, Hanuschkin A, Marcus GF, Tchernichovski O, Hahnloser RHR (2017) Songbirds work around computational complexity by learning song vocabulary independently of sequence. Nat Commun 8:1247. 10.1038/s41467-017-01436-0 [DOI] [PMC free article] [PubMed] [Google Scholar]
- Long MA, Fee MS (2008) Using temperature to analyse temporal dynamics in the songbird motor pathway. Nature 456:189–194. 10.1038/nature07448 [DOI] [PMC free article] [PubMed] [Google Scholar]
- Mozzachiodi R, Byrne JH (2010) More than synaptic plasticity: role of nonsynaptic plasticity in learning and memory. Trends Neurosci 33:17–26. 10.1016/j.tins.2009.10.001 [DOI] [PMC free article] [PubMed] [Google Scholar]
- Nick TA, Konishi M (2005) Neural song preference during vocal learning in the zebra finch depends on age and state. J Neurobiol 62:231–242. 10.1002/neu.20087 [DOI] [PubMed] [Google Scholar]
- Nolan MF, Malleret G, Dudman JT, Buhl DL, Santoro B, Gibbs E, Vronskaya S, Buzsáki G, Siegelbaum SA, Kandel ER, Morozov A (2004) A behavioral role for dendritic integration: HCN1 channels constrain spatial memory and plasticity at inputs to distal dendrites of CA1 pyramidal neurons. Cell 119:719–732. 10.1016/j.cell.2004.11.020 [DOI] [PubMed] [Google Scholar]
- Ravbar P, Lipkind D, Parra LC, Tchernichovski O (2012) Vocal exploration is locally regulated during song learning. J Neurosci 32:3422–3432. 10.1523/JNEUROSCI.3740-11.2012 [DOI] [PMC free article] [PubMed] [Google Scholar]
- Roberts TF, Gobes SM, Murugan M, Ölveczky BP, Mooney R (2012) Motor circuits are required to encode a sensory model for imitative learning. Nat Neurosci 15:1454–1459. 10.1038/nn.3206 [DOI] [PMC free article] [PubMed] [Google Scholar]
- Roberts TF, Tschida KA, Klein ME, Mooney R (2010) Rapid spine stabilization and synaptic enhancement at the onset of behavioural learning. Nature 463:948–952. 10.1038/nature08759 [DOI] [PMC free article] [PubMed] [Google Scholar]
- Roberts TF, Hisey E, Tanaka M, Kearney MG, Chattree G, Yang CF, Shah NM, Mooney R (2017) Identification of a motor-to-auditory pathway important for vocal learning. Nat Neurosci 20:978–986. 10.1038/nn.4563 [DOI] [PMC free article] [PubMed] [Google Scholar]
- Roper A, Zann R (2006) The onset of song learning and song tutor selection in fledgling zebra finches. Ethology 112:458–470. 10.1111/j.1439-0310.2005.01169.x [DOI] [Google Scholar]
- Ross MT, Flores D, Bertram R, Johnson F, Hyson RL (2017) Neuronal intrinsic physiology changes during development of a learned behavior. eNeuro 4:ENEURO.0297–17.2017. 10.1523/ENEURO.0297-17.2017 [DOI] [PMC free article] [PubMed] [Google Scholar]
- Tchernichovski O, Mitra PP, Lints T, Nottebohm F (2001) Dynamics of the vocal imitation process: how a zebra finch learns its song. Science 291:2564–2569. 10.1126/science.1058522 [DOI] [PubMed] [Google Scholar]
- Zhang W, Linden DJ (2003) The other side of the engram: experience-driven changes in neuronal intrinsic excitability. Nat Rev Neurosci 4:885–900. 10.1038/nrn1248 [DOI] [PubMed] [Google Scholar]


