

Abstract
Overreactivity and defensive behaviors in response to tactile stimuli are common symptoms in autism spectrum disorder (ASD) patients. Similarly, somatosensory hypersensitivity has also been described in mice lacking ASD-associated genes such as Fmr1 (fragile X mental retardation protein 1). Fmr1 knock-out mice also show reduced functional connectivity between sensory cortical areas, which may represent an endogenous biomarker for their hypersensitivity. Here, we measured whole-brain functional connectivity in Engrailed-2 knock-out (En2−/−) adult mice, which show a lower expression of Fmr1 and anatomical defects common to Fmr1 knock-outs. MRI-based resting-state functional connectivity in adult En2−/− mice revealed significantly reduced synchronization in somatosensory-auditory/associative cortices and dorsal thalamus, suggesting the presence of aberrant somatosensory processing in these mutants. Accordingly, when tested in the whisker nuisance test, En2−/− but not WT mice of both sexes showed fear behavior in response to repeated whisker stimulation. En2−/− mice undergoing this test exhibited decreased c-Fos-positive neurons (a marker of neuronal activity) in layer IV of the primary somatosensory cortex and increased immunoreactive cells in the basolateral amygdala compared with WT littermates. Conversely, when tested in a sensory maze, En2−/− and WT mice spent a comparable time in whisker-guided exploration, indicating that whisker-mediated behaviors are otherwise preserved in En2 mutants. Therefore, fearful responses to somatosensory stimuli in En2−/− mice are accompanied by reduced basal connectivity of sensory regions, reduced activation of somatosensory cortex, and increased activation of the basolateral amygdala, suggesting that impaired somatosensory processing is a common feature in mice lacking ASD-related genes.
SIGNIFICANCE STATEMENT Overreactivity to tactile stimuli is a common symptom in autism spectrum disorder (ASD) patients. Recent studies performed in mice bearing ASD-related mutations confirmed these findings. Here, we evaluated the behavioral response to whisker stimulation in mice lacking the ASD-related gene Engrailed-2 (En2−/− mice). Compared with WT controls, En2−/− mice showed reduced functional connectivity in the somatosensory cortex, which was paralleled by fear behavior, reduced activation of somatosensory cortex, and increased activation of the basolateral amygdala in response to repeated whisker stimulation. These results suggest that impaired somatosensory signal processing is a common feature in mice harboring ASD-related mutations.
Keywords: autism, behavior, c-Fos, cortex, imaging, somatosensory
Introduction
Autism spectrum disorder (ASD) research has typically focused on the social, communication, and cognitive impairments associated with these conditions. More recently, several studies have suggested that impaired sensory processing might represent a core component of autistic features. For example, atypical sensory experience affecting all sensory modalities (taste, touch, audition, smell, and vision) is estimated to occur in almost 90% of autistic patients (Robertson and Baron-Cohen, 2017). Consistent with this, tactile perception abnormalities have been widely observed in patients with fragile X syndrome (FXS), a syndromic form of ASD caused by mutations in the fragile X mental retardation protein 1 (Fmr1) gene (Rogers et al., 2003). Moreover, the presence of ASD traits in human patients is associated with a diminished activation of “social brain” areas following gentle touch (Voos et al., 2013).
Neural mechanisms underlying sensory processing are relatively well understood in typically developing individuals and are conserved between humans and other animals. For this reason, animal studies of sensory behavior may considerably contribute to understanding the neurobiological bases of ASD (Robertson and Baron-Cohen, 2017). Mice use their whiskers to locate and identify objects during environment navigation. Afferent whisker information reaches layer IV of primary somatosensory cortex (SSp) for further processing (Deschênes et al., 2005; Petersen, 2007; Diamond et al., 2008). Several monogenic mouse lines harboring ASD-related mutations display hypersensitivity to somatosensory stimulation. For instance, Fmr1 mutant mice, a model for syndromic autism, display hypersensitivity to somatosensory stimuli following whisker stimulation, resembling tactile defensiveness in FXS patients (Zhang et al., 2014; He et al., 2017). Interestingly, imaging studies recently showed that these behavioral deficits are accompanied by functional hypoconnectivity selectively located in sensory brain areas (Haberl et al., 2015; Zerbi et al., 2018).
Genetic studies (Gharani et al., 2004; Benayed et al., 2005, 2009; Hnoonual et al., 2016) and expression analyses on postmortem brain tissues (James et al., 2013, 2014; Choi et al., 2014) suggested that deregulated expression of the human EN2 gene coding for the homeobox-containing transcription factor Engrailed-2 is linked to ASD. Accordingly, mice lacking En2 (En2−/− mice) are considered a reliable model for investigating the neurodevelopmental basis of ASD. En2−/− mice display neuroanatomical and behavioral deficits relevant to ASD, such as defective cerebellar patterning (Joyner et al., 1991), reduction of Purkinje cell number (Kuemerle et al., 1997), and reduced sociability (Cheh et al., 2006; Brielmaier et al., 2012). The En2-null mutation also results in the selective reduction of GABAergic interneurons in the hippocampus and SSp (Sgadò et al., 2013). Interestingly, Fmr1 expression is downregulated in the brain of En2−/− mice at both mRNA and protein level (Provenzano et al., 2015).
We thus investigated whether the anatomical defects observed in the SSp, accompanied by the significantly reduced expression of Fmr1, might affect somatosensory cortex connectivity and function in En2−/− mice. To this aim, we mapped whole-brain functional connectivity in En2−/− and control littermates via resting-state functional magnetic resonance imaging (rs-fMRI), a readout that has proven exquisitely sensitive to network alterations produced by ASD-associated etiologies (Sforazzini et al., 2014; Haberl et al., 2015; Liska et al., 2018; Bertero et al., 2018). WT and En2−/− mice were also tested in a battery of behavioral tasks aimed at evaluating their somatosensory function. After these tests, we analyzed c-Fos induction in different brain areas as a marker of neuronal activation due to somatosensory stimulation (Filipkowski et al., 2000). We also analyzed c-fos mRNA induction in SSp in WT and En2−/− mice subjected to repeated whisker stimulation under anesthesia. Our results show functional hypoconnectivity of SSp in En2−/− mice, accompanied by fear behaviors, reduced SSp activation and increased activation of the basolateral amygdala in response to repeated whisker stimulation. Repeated whisker stimulation under anesthesia also resulted in reduced SSp activation in En2−/− mice. These results suggest impaired somatosensory processing as a core feature of mouse lines harboring ASD-related mutations.
Materials and Methods
Animals
All animal procedures were performed in accordance with the University of Trento and ETH Zürich animal care committee regulations. Animals were housed in a 12 h light/dark cycle with food and water available ad libitum. All surgeries were performed under chloral hydrate anesthesia and all efforts were made to minimize suffering. En2 mutants (Joyner et al., 1991; mixed 129Sv × C57BL/6 and outbred genetic background; strain B6;129S2-En2tm1Alj/J) were crossed at least five times into a C57BL/6 background. Heterozygous mating (En2+/− × En2+/−) were used to generate the En2+/+ (WT) and En2−/− littermates used in this study. PCR genotyping was performed according to the protocol available on The Jackson Laboratory website (www.jax.org). A total of 66 age-matched adult littermates (33 mice per genotype; 3–6 months old; weight = 25–35 g) of both sexes were used. Sixteen mice (8 per genotype) were used for MRI experiments and 32 mice (16 per genotype) were used for behavioral testing. A subset of animals subjected to behavioral tests (10 WT and 10 En2−/− mice) was used for c-Fos immunohistochemistry. Four mice per genotype were used for the c-fos mRNA study following whisker stimulation under anesthesia. An additional group of 10 mice (5 per genotype) was used to check physiological parameters under the anesthesia conditions used for MRI. Previous studies showed that similar group sizes are sufficient to obtain statistically significant results in MRI (Haberl et al., 2015; Sforazzini et al., 2016; Pagani et al., 2018), behavioral (Brielmaier et al., 2012; Provenzano et al., 2014), immunohistochemical (Sgadò et al., 2013; Gonzalez-Perez et al., 2018), and in situ hybridization (Tripathi et al., 2009) studies. All experiments were performed by operators blinded to genotype. Animals were assigned a numerical code by an operator who did not take part in the experiments and codes were associated to genotypes only at the moment of data analysis.
MRI
Eight WT (4 males, 4 females) and 8 En2−/− (3 males, 5 females) littermates underwent one MRI scanning session to evaluate whole-brain functional connectivity and white matter microstructure. During the imaging sessions, experimenters were blinded to genotype. Data acquisition was performed on a Biospec 70/16 small animal MRI system (Bruker BioSpin) equipped with a cryogenic quadrature surface coil (Bruker BioSpin). For rs-fMRI acquisition, we used a standard gradient-echo echoplanar imaging sequence (GE-EPI, repetition time TR = 1 s, echo time TE = 15 ms, in-plane resolution RES = 0.22 × 0.2 mm2, number of slices NS = 20, slice thickness ST = 0.4 mm, slice gap SG = 0.1 mm, 900 volumes, scan time = 15 min). In addition, we acquired diffusion weighted images (DWIs) for white matter structural integrity evaluation (multishot Spin Echo EPI sequence, 4 segments, TR = 2 s, TE = 22 ms, RES = 0.2 × 0.2 mm2, NS = 28, ST = 0.4 mm, SG = 0 mm, b-values = 0–1000 s/mm2, 94 directions encoding, scan time = 9 min).
Throughout the MRI scanning, the level of anesthesia and mouse physiological parameters were monitored following an established protocol to obtain a reliable measurement of functional connectivity (Grandjean et al., 2014; Zerbi et al., 2015). Briefly, anesthesia was induced with 4% isoflurane and the animals were endotracheally intubated and the tail vein cannulated. Mice were positioned on an MRI-compatible cradle and artificially ventilated at 80 breaths/min, 1:4 O2 to air ratio, and 1.8 ml/h flow (CWE). A bolus injection of medetomidine 0.04 mg/kg and pancuronium bromide 0.05 mg/kg was administered and isoflurane was reduced to 1%. After 5 min, an infusion of medetomidine 0.09 mg/kg/h and pancuronium bromide 0.15 mg/kg/h was administered and isoflurane was further reduced to 0.5%. The animal temperature was monitored using a rectal thermometer probe and maintained at 36.5°C ± 0.5 during the measurements with a water heating system in the cradle. The preparation of the animals did not exceed 20 min (15 ± 3 min).
Arterial blood pressure and gas measurements
Arterial blood pressure and blood gas measurements were performed in a subset of 5 WT (2 females and 3 males) and 5 En2−/− (3 females and 2 males) mice under the same anesthesia conditions used for MRI. Blood pressure recordings were performed as described previously (Ferrari et al., 2012; Sforazzini et al., 2014). Briefly, the left femoral artery was cannulated for continuous blood pressure monitoring, medetomidine administration, and blood sampling. During these procedures, mice were anesthetized (4% isoflurane induction), intubated, artificially ventilated, and subjected to the same sedation regimen used in MRI recordings. Surgical sites were preinfiltrated with a non-brain-penetrant local anesthetic (Tetracaine 0,05%; Sigma-Aldrich). Blood pressure recordings started 15 min (15 ± 3 min) after the beginning of medetomidine infusion and lasted 30 min. At the end of the procedure, arterial blood gas pressures (paCO2 and paO2) were also measured to rule out nonphysiological conditions.
MRI data preprocessing
rs-fMRI.
Datasets were preprocessed using an existing pipeline for removal of unwanted confounds from the time series following guidelines of the Human Connectome Project, adapted to the mouse (Zerbi et al., 2015). Briefly, each rs-fMRI dataset was despiked with AFNI (Patel et al., 2014) and fed into MELODIC (Multivariate Exploratory Linear Optimized Decomposition of Independent Components; Beckmann and Smith, 2004) to perform a within-subject spatial independent component analysis (ICA) with a fixed dimensionality estimation (number of components set to 60). This included correction and regression for head motion (Jenkinson et al., 2002) and in-plane smoothing with a 0.3 × 0.3 mm kernel. We applied FSL-FIX with a study-specific classifier obtained from an independent dataset of 15 mice and used a “conservative” removal of the variance of the artifactual components (for more details, see Griffanti et al., 2014). Thereafter, artifact-cleaned datasets were band-pass filtered (0.01–0.25 Hz), coregistered to a GE-EPI study-specific template, and normalized to the Australian Mouse Brain Mapping Consortium (AMBMC) template (www.imaging.org.au/AMBMC) using Advanced Normalization Tools (ANTs v2.1, picsl.upenn.edu/ANTS). Blood oxygenation level-dependent (BOLD) time series were extracted using the Allen's Common Coordinate Framework version 3 (CCFv3), rescaled to 0.2 mm isotropic, and normalized into the AMBMC template (ANTs). In total, 65 regions of interest (ROIs) in each hemisphere were considered (130 ROIs), including regions from isocortex, hippocampal formation, cortical subplate, striato-pallidum, amygdala, thalamus, midbrain, and hindbrain. Functional connectivity between pairs of brain regions was inferred via Pearson's correlation of the respective time series. Individual connectivity matrices were additionally regularized to scale for global signal confounding using FSLNets (https://fsl.fmrib.ox.ac.uk/fsl/fslwiki/FSLNets). In total, 65 ROIs in each hemisphere were considered, including regions from isocortex, hippocampal formation, cortical subplate, striato-pallidum, amygdala, thalamus, midbrain, and hindbrain.
Diffusion tensor imaging (DTI) parameter estimation.
Through measurement of water diffusivity in multiple directions, DTI reconstructs an ellipsoid to model the diffusion in every voxel. The preprocessing steps consisted of individual realignment of the diffusion images, followed by eddy current correction and tensor estimation as in Zerbi et al. (2013). From the eigenvalues of the diffusion tensor, fractional anisotropy (FA), mean diffusivity (MD), and first eigenvalue (λ1) maps were calculated. The resulting volumes were spatially normalized to the AMBMC template using linear affine and nonlinear elastic transformations in ANTs and thereafter FA, MD, and λ1 values were extracted from seven major white matter structures identified by the Allen's CCFv3: anterior commissure, fimbria, corpus callosum, fornix, cingulum, internal capsule, and cerebral peduncle. Moreover, spatial maps of FA, MD, and λ1 were tested for voxelwise differences between groups using nonparametric testing with 5000 random permutations (FSL randomize) and the threshold-free cluster enhancement method, which can enhance cluster-like structures without having to define an initial cluster-forming threshold (Smith and Nichols, 2009).
Behavioral procedures
Starting from 1 week before the first day of behavioral testing, animals in their home cages were removed from the housing room daily and placed in the experimental room for 1–2 h to habituate to the novel environment and experimenter presence. Sixteen WT (8 females, 8 males) and 16 En2−/− (8 females, 8 males) littermates were subjected to a battery of tests to assess their sensory-motor function (see Fig. 3).
Figure 3.

Schematic representation of the behavioral experimental procedures. Habituation started 1 week before the beginning of the first test (CH) and lasted until the end of the experiment. CH was performed in the home cage. The second (WGE) and third (WN) tests were performed 1 week after the previous one to minimize animals' work overload. The sensory maze for WGE included zones with smooth walls lacking any tactile cues (white areas in the figure) and angle-shaped zones with textured walls to guide the animal's whisker exploration (black areas in the figure). Gray areas indicated in the figure were excluded from the final quantification as considered biased. WN was performed in a novel empty cage (experimental cage). A small fraction of the home cage bedding was placed overnight in the experimental cage to facilitate habituation to the novel environment and then removed right before the introduction of the mouse into the experimental cage. Mice were perfused 2 h after the WN test.
Capellini handling (CH).
The CH test was performed according to Tennant et al. (2010). During the week before the test, animals were gradually habituated to food restriction. Six hours of food deprivation were applied every testing day. Trials were performed in the home cage to minimize anxious response and to increase the chance to visualize the animal first contact with the piece of pasta. During the 4 sessions of the test (1/d, 4 consecutive d), 5 pieces of capellini pasta (2.6 cm length) were placed in the cage. During the first day, observation period lasted 30 min, after which the animals were placed back in the housing room with the remaining capellini inside the cage. On the subsequent days, the observation was interrupted once the animal performed three to four trials or when it showed lack of interest in further eating. A trial was defined as the sequence of actions from picking to eating (or showing no more interest for) a piece of capellini. In each daily session, manipulation time without drops per trial (s/trial) and the total number of drops per trial (drops/trial, error rate) were used to assess the animal's sensorimotor accuracy.
Whisker-guided exploration (WGE).
To assess spontaneous WGE activity, mice were placed in a specially shaped arena (“sensory maze”; Learoyd et al., 2012) composed by zones with smooth walls (see white areas in Fig. 3) and zones with angles and textured walls (which should stimulate whisker-dependent exploration; see black areas in Fig. 3). Gray areas indicated in Figure 3 were excluded from the final quantification as considered biased. The test was performed in an almost completely dark room to avoid the employment of visual cues during exploration. Mice were allowed to move freely and explore the arena for 15 min. Animals' movements in the maze were recorded by a video camera and automatically tracked by the ANY-maze software (RRID:SCR_014289). For each animal, the percentage of time spent exploring each zone over the total time spent in exploration was used to extrapolate the time spent in whisker-mediated exploration during the task. Immobility periods were excluded from quantification analysis.
Whisker nuisance (WN).
The WN test was performed according to McNamara et al. (2010). On the 2 d before the test, animals were allowed to habituate for 30 min to a novel empty cage (experimental cage). A small fraction of the home cage bedding was placed overnight in the experimental cage to facilitate habituation to the novel environment; bedding was removed right before the introduction of the mouse into the experimental cage. Sessions lasted ∼1 h per mouse, divided into a 35 min pretest (30 min of environment habituation and 5 min of experimenter habituation) followed by a 20 min test. The 20 min test was split into 4 sessions of 5 min each. During the first session (“sham” condition), a wooden stick was presented to the animals, reproducing the same modality used for the stimulation sessions but avoiding any tactile contact with the mouse whiskers or body. Subsequently, mice underwent three consecutive stimulation sessions (trials 1–3), each consisting of continuous touch of the whiskers with the wooden stick (bilateral stimulation). The predominant behavioral response during the four test sessions was scored over a 10-point scale (see Table 2), which represents a modified version of the WN scoring scale by McNamara et al. (2010). Scoring criteria were divided into five categories; the predominant behavioral responses were recorded for fearful behavior (freezing), stance, breathing (hyperventilation), aggressive response to stick presentation, and evasiveness on a 0–2 points qualitative scale (where 0 = absent, 1 = scarcely present during the observation period, and 2 = present for the vast majority of the observation period). Normal behavioral responses to stimulation were assigned a 0 value, whereas meaningful abnormal behavioral responses (i.e., for the vast majority of the observation period) were assigned a value of 2. Compared with the published scale (McNamara et al., 2010), three categories were omitted (whisker position, whisking response, and grooming) because they could not be reliably scored in preliminary observations. The maximum WN score is 10. High scores (8–10) indicate abnormal responses to the stimulation in which the mouse freezes, becomes agitated, or is aggressive. Low scores (0–3) indicate normal responses in which the mouse is either curious or indifferent to the stimulation. Scoring was performed by two independent operators and no variability in scoring was observed.
Table 2.
WN scoring table
| Behaviors | Score |
||
|---|---|---|---|
| 0 | 1 | 2 | |
| Fearful behavior | Curious, insensible | Ambivalent behavior | Freezing |
| Stance | Skyward head, relaxed | Ambivalent behavior | Guarded |
| Breathing | Normal | Ambivalent behavior | Hyperventilated |
| Response to stick presentation | Interested, ignore | Ambivalent behavior | Attacking, startle |
| Evasiveness | Explorative behavior | Ambivalent behavior | Run away, avoiding |
| Total score | 0–3: curious, restful | 4–7: annoyed, bothered | 8–10: scared, worried |
The predominant behavioral response during each test session (sham and trials 1–3) was scored over a 10-point scale, which represents a modified version of the WN scoring scale by McNamara et al. (2010) (see Materials and Methods for details).
c-Fos immunostaining
A subset of 10 WT (5 females, 5 males) and 10 En2−/− (5 females, 5 males) mice was used for c-Fos immunohistochemistry following behavioral tests. Mice were killed 2 h after the end of the WN test. Brains were fixed by transcardial perfusion with 4% paraformaldehyde, followed by 1 h postfixation at 4°C, and coronal sections (40 μm thick) were prepared using a vibratome. Serial sections at the level of the SSp, dorsal hippocampus, and amygdala were incubated for 72 h with a rabbit primary antibody against c-Fos (Santa Cruz Biotechnology sc-52, 1:4000 dilution; RRID:AB_2106783). Signals were revealed by incubation with a biotin-conjugated secondary antibody and VECTASTAIN ABC-Peroxidase Kit antibody (Vector Laboratories catalog #PK-4001, RRID:AB_2336810) followed by diaminobenzidine reaction. Brain areas were identified on Nissl-stained adjacent sections according to the Allen Mouse Brain Atlas (www.brain-map.org).
Whisker stimulation under anesthesia and c-fos mRNA in situ hybridization
Four En2−/− (2 males, 2 females) mice and 4 WT littermates (2 males, 2 females) were anesthetized with urethane (20% solution in sterile double-distilled water, 1.6 g/kg body weight, i.p.) and head-fixed on a stereotaxic frame. Urethane anesthesia was chosen because it preserves whisker-dependent activity in the somatosensory cortex (Unichenko et al., 2018). Whisker stimulation was performed in 3 consecutive sessions (5 min each, with 1 min intervals), each consisting in continuous touch of the whiskers with a wooden stick (bilateral stimulation). This protocol was chosen to reproduce the stimulation protocol used in the WN test. Mice were killed 20 min after the end of whisker stimulation and brains were rapidly frozen on dry ice. Coronal cryostat sections (20 μm thick) were fixed in 4% paraformaldehyde and processed for nonradioactive in situ hybridization (Tripathi et al., 2009) using a digoxigenin-labeled c-fos riboprobe. Signal was detected by alkaline phosphatase-conjugated anti-digoxigenin antibody followed by alkaline phosphatase staining. Brain areas were identified according to the Allen Mouse Brain Atlas.
Statistical analyses
Functional imaging data.
Statistical analyses of functional imaging data were performed using nonparametric permutation testing. A general linear model was used to evaluate overall genotype differences considering gender and bodyweight as covariates. Uncorrected permutation testing (5000 permutations) of the Z-scored Pearson's correlation matrices (130 × 130 nodes, retaining only the top 10% of connections based on connectivity strength, Fig. 1A) was performed using FSL randomize. Network-based statistics (NBS) was used to control for multiple-comparisons false-positives (Zalesky et al., 2010). Briefly, a test statistic was computed for each connection and a threshold was applied (t = 2.3) to produce a set of suprathreshold connections, thereby identifying anatomical networks that show significant differences in connectivity between groups correcting for multiple comparisons (p < 0.05). For DWI analysis, multivariate ANOVA was performed on FA, MD, and λ1 values of seven white matter structures. This was followed by false detection rate testing to control for multiple comparisons.
Figure 1.

Decreased fMRI functional connectivity in En2−/− mice. A, Graphical and circos-plot representation of the whole-brain functional connectome (65 nodes in each hemisphere) in the mouse brain obtained from the average of 16 datasets (WT and En2−/−). The averaged connectivity matrix was set using an arbitrary sparsity of 10% to preserve strong and positive functionally connected edges. Only these connections are included in the analysis. B, Results of group difference permutation testing (5000 permutation, uncorrected) are shown for two contrasts (En2−/− < WT and En2−/− > WT). The vast majority of connectivity differences were seen in the first contrast, suggesting an underconnectivity phenotype in En2−/− mice. Cohen's D effect size analysis revealed a reduced coherence in rs-fMRI in sensory-related structures, whereas only few connections displayed increased coherence. C, Correction for multiple comparisons using NBS revealed two significant large-scale networks in which connectivity was significantly reduced in En2−/− mice. (5000 permutations, N1, red: p = 0.002; N2, green: p = 0.019, NBS corrected). N1 included intrahemispheric and interhemispheric connections between primary somatosensory areas (trunk, SSp-tr; lower limb, SSp-ll) and auditory/associative (AUD). N2 included superior colliculus (SCs, SCm), postsubiculum (POST), thalamus polymodal association and sensory-motor cortex related (DORpm, DORsm), prectal region (PRT), and periacqueductal gray (PAG). Plots report the average value of the network strength per animal. Genotypes are as indicated. **p < 0.01, ***p < 0.001, two-way ANOVA.
Behavioral and c-fos expression data.
Statistical analyses of behavioral, immunohistochemistry, and in situ hybridization data were performed with GraphPad Prism 6.0 software (RRID:SCR_002798) with the level of significance set at p < 0.05.
For behavioral experiments, statistical analysis was performed by unpaired t test or two-way ANOVA (with or without repeated measures) followed by Holm–Sidak's, Tukey's, or multiple t tests with Bonferroni correction for post hoc comparisons as appropriate.
Quantitative analyses of c-Fos-positive cells were performed in the SSp (layers II/III, IV, and V/VI), dorsal hippocampus (CA1, CA2, CA3, and dentate gyrus, DG), and basolateral amygdala (BLA). Brain areas were identified according to the Allen Mouse Brain Atlas. Digital images from c-Fos-stained sections (at least three sections per animal) were acquired using a Zeiss AxioImager II microscope at a 10× primary magnification. c-Fos-positive cells were counted in an automatic mode using ImageJ (RRID:SCR_003070). Acquired images were converted to 8-bit (gray-scale), inverted, and processed for background subtraction (background was calculated in acellular regions of stratum radiatum for the hippocampus and cortical layer I for the SSp and BLA). To automatically identify c-Fos-positive nuclei, the “watershed” function of ImageJ was used to select circular objects with a minimal surface of 30 μm2 (minimal diameter, 6.18 μm). For cortical layers, a counting frame with an area of 500 μm × 200 μm (0.1 mm2) was used. The sampling field was moved systematically through the cortical layer of interest at least three times per section. To count positive cells in the hippocampus and amygdala, the counting area was drawn to identify pyramidal cell layers (CA1, CA2, and CA3), the upper blade of DG, and BLA. Average values per animal were calculated and cell densities were plotted as the number of positive cells/0.1 mm2. Differences between groups were assessed by unpaired t test.
To quantify c-fos mRNA in situ hybridizations, digital images from 3–4 sections per animal were acquired at the level of the SSp/dorsal hippocampus using a Zeiss AxioImager II microscope at 10× primary magnification. Images were converted to 8-bit (gray-scale), inverted, and analyzed using the ImageJ. For each section, mean signal intensity was measured in 3 different counting windows (0.1 mm2) spanning layers II/III, IV, and V/VI of the SSp. Mean signal intensity was divided by the background calculated in layer I. Statistical analysis was performed by unpaired t test.
Results
En2−/− mice show an underconnectivity phenotype in sensory-related cortical and thalamic brain regions
Eight En2−/− mice (3 males, 5 females) and eight WT littermates (4 males, 4 females) underwent one MRI scanning session to evaluate whole-brain functional connectivity and white matter microstructure. There was no significant difference in bodyweight between genotypes (average: 26 ± 3 g); however, there was a significant effect of gender on bodyweight in both groups (males: 29 ± 2 g, females: 24 ± 2 g, p < 0.001). For an unbiased comparison between groups, gender and bodyweight were considered as covariates in all statistical analyses.
rs-fMRI examines the temporal correlations of slow fluctuations of the BOLD signal across the brain during rest; that is, without overt perceptual inputs or motor output typically present in traditional fMRI studies. Synchronization in BOLD fluctuations between brain regions (i.e., functional connectivity) is a parameter often used to determine the brain's capability to share and integrate information (Zhang et al., 2010). This can be used as a translational tool to study complex circuitry interactions and their pathology in laboratory animals (Haberl et al., 2015; Zerbi et al., 2015; Gozzi and Schwarz, 2016; Grandjean et al., 2017).
Permutation testing over 846 edges in the functional connectivity matrix revealed an overall underconnectivity phenotype of En2−/− mice compared with their WT littermates. Regions that were significantly underconnected (WT > En2−/−; 5000 permutations, p < 0.05, uncorrected, n = 8 per genotype) were mainly located in the somatosensory and auditory cortical areas, hippocampus and thalamus. Instead, only a few connections showed increase in connectivity in En2−/− mice and defined nodes of the mouse default mode network (anterior cingulate, retrosplenial, and temporal association areas) (Fig. 1B).
Multiple-comparisons correction using NBS identified two symmetric networks with reduced connectivity in the En2−/− model (WT > En2−/−; 5000 permutations; N1, p = 0.002, and N2, p = 0.019; n = 8 per genotype); the first comprises 7 nodes (i.e., ROIs) and 9 edges (i.e., connections), all belonging to sensory cortical areas (Fig. 1C, red). The second network consists of 11 nodes and 15 edges including thalamic and midbrain structures. No connections depicting overconnectivity were identified as significant by NBS.
To test for the presence of possible genotype-dependent differences in sensitivity to the anesthesia, we measured peripheral parameters sensitive to anesthesia depth in control and mutant mice (Steffey et al., 2003) under the same sedation regimen used for rs-fMRI. We did not find any differences in mean blood pressure (0–30 min; WT, 106 ± 9.4 mmHg; En2−/−, 101 ± 17.6 mmHg; p = 0.61, Student's t test), mean paCO2 (WT, 31 ± 4.3 mmHg; En2−/−, 29 ± 7.2mmHg; p = 0.48, Student's t test), or mean paO2 (WT, 184 ± 20.8 mmHg; En2−/−, 178 ± 24.3 mmHg; p = 0.69, Student's t test) between WT and En2−/− mice (n = 5 per genotype).
En2−/− mice display cerebellar white matter structural deficits
The structural integrity of major axon bundles was quantified by extracting FA, MD, and λ1 in seven major white matter structures of the forebrain and midbrain of WT and En2−/− mice identified by the Allen Mouse Brain atlas. There were no genotype differences in any of the selected white matter tracts (Table 1). However, in agreement with previous studies showing structural defects, cellular loss, and overall shrinkage in the En2−/− cerebellum (Joyner et al., 1991; Kuemerle et al., 1997; Ellegood et al., 2015), we observed reduced mean and axial diffusivity in cerebellar lobules in En2−/− mice compared with WT controls (Fig. 2).
Table 1.
DTI data for forebrain and midbrain white matter tracts
| Anterior commissure | Fimbria | Corpus callosum | Fornix | Cingulum | Internal capsule | Cerebral peduncle | |
|---|---|---|---|---|---|---|---|
| FA | |||||||
| WT | 0.33 ± 0.02 | 0.50 ± 0.02 | 0.37 ± 0.01 | 0.36 ± 0.01 | 0.45 ± 0.02 | 0.46 ± 0.01 | 0.47 ± 0.01 |
| En2−/− | 0.34 ± 0.03 | 0.58 ± 0.02 | 0.37 ± 0.01 | 0.37 ± 0.02 | 0.45 ± 0.02 | 0.46 ± 0.01 | 0.47 ± 0.01 |
| p-value (FDR) | 0.971 | 0.154 | 0.301 | 0.971 | 0.659 | 0.659 | 0.971 |
| MD | |||||||
| WT | 0.59 ± 0.02 | 0.73 ± 0.07 | 0.64 ± 0.03 | 0.75 ± 0.03 | 0.64 ± 0.03 | 0.57 ± 0.02 | 0.69 ± 0.02 |
| En2−/− | 0.59 ± 0.01 | 0.64 ± 0.04 | 0.61 ± 0.02 | 0.74 ± 0.02 | 0.61 ± 0.02 | 0.56 ± 0.01 | 0.69 ± 0.02 |
| p-value (FDR) | 0.738 | 0.119 | 0.128 | 0.738 | 0.128 | 0.738 | 0.803 |
| λ1 | |||||||
| WT | 0.82 ± 0.02 | 1.16 ± 0.09 | 0.90 ± 0.04 | 1.10 ± 0.05 | 0.98 ± 0.03 | 0.88 ± 0.02 | 1.13 ± 0.04 |
| En2−/− | 0.81 ± 0.01 | 1.03 ± 0.05 | 0.86 ± 0.02 | 1.08 ± 0.04 | 0.93 ± 0.03 | 0.87 ± 0.02 | 1.13 ± 0.04 |
| p-value (FDR) | 0.403 | 0.077 | 0.126 | 0.403 | 0.126 | 0.790 | 0.689 |
Figure 2.

Whole-brain DTI mapping show abnormal water diffusion in the En2−/− cerebellum. Voxel-based analysis (VBA) with permutation testing (5000 permutations, threshold-free cluster enhancement corrected) indicates significant differences in MD and λ1 in En2−/− mice compared with WT. VBA results are overlaid onto FA, MD, and λ1 study-specific templates derived from the whole dataset. Six anterior to posterior axial diffusion maps (distance from bregma; 1.10 mm anterior to −5.80 mm posterior) are overlaid with voxels that showed a significant difference between groups (p < 0.05). The voxel color indicates positive changes in water diffusion proprieties in En2−/− mice compared with WT, whereas no negative changes appeared significant. MD and λ1 increases are found in both the left and right paraflocculus and parafloccular sulci of the cerebellum.
Preserved manipulation skills in En2−/− mice
rs-fMRI data clearly indicate that En2−/− mice display a significant underconnectivity in specific brain regions, including the somatosensory cortex, and microstructural abnormalities in the cerebellum. Previous studies showed that cerebellar defects in En2−/− mice (Joyner et al., 1991; Kuemerle et al., 1997; Ellegood et al., 2015) are accompanied by subtle motor coordination deficits in the rotarod test and reduced forelimb grip strength (which might be relevant for forelimb motor coordination) (Brielmaier et al., 2012). We therefore set up a battery of behavioral tests to evaluate sensorimotor and whisker-dependent skills in WT and En2−/− mice. Sixteen WT and 16 En2−/− mice were sequentially tested in the CH, WGE, and WN tasks, over a 24 d period. Mice were food restricted for 6 d and then performed the CH task from day 6 to day 9. Days 10–16 were dedicated to habituation for the WGE and the test was performed on day 17. Subsequently, on days 18–23, mice were habituated to WN and finally subjected to the WN task on day 24. Mice were then killed 2 h after the end of WN (Fig. 3).
The performance of En2−/− mice in the CH task did not significantly differ from that of WT mice during the 4 d of test. During the first day, the time spent in manipulations without drops did not differ between WT and En2−/− mice (unpaired t test; WT vs En2−/−; p = 0.3283; n = 16 per genotype; Fig. 4A). Because both WT and En2−/− male mice were reported to have a significantly higher forelimb grip strength compared with females of the same genotype (Brielmaier et al., 2012), we investigated whether this difference might affect the performance in the capellini test. For both genotypes, no difference between male and female mice was observed in time spent in manipulations without drops during the first day of test (two-way ANOVA, main effect of sex F(1,28) = 0.9529, p = 0.3373; n = 8 per sex and genotype; Fig. 4B).
Figure 4.

Preserved manipulation skills and normal sensory-guided exploration in En2−/− mice. The figure shows quantification of CH and WGE tests in WT and En2−/− mice. No differences were detected between WT and En2−/− mice in both tests. A, Manipulation time without drops (per trial) during the first day of the CH test. B, Performance of female and male WT and En2−/− mice during the first day of the CH test (manipulation time without drops per trial). C, Error rate (number of drops per trial) during days 2–4 of the CH test. D, Total exploration time spent in the sensory maze during the WGE test. E, Performance of female and male WT and En2−/− mice in the WGE test (total exploration time spent in the sensory maze). F, Percentage of time spent in textured and smooth zones of the sensory maze the WGE test. All plots report the mean values ± SEM. In A, B, D, and E, each dot represents the average value per animal. Genotypes and sexes are as indicated.
To extrapolate the sensory component of this sensorimotor task, we counted the total number of drops during each daily session (days 2–4) normalized to the total number of trials performed during that day. Both genotypes showed the same error rate (number of drops per trial) during days 2–4 (two-way repeated-measures ANOVA, main effect of training day F(2,60) = 0.5915, p = 0.5567; n = 16 per genotype; Fig. 4C) and CH performance did not differ between genotypes over days 2–4 of training (two-way repeated-measures ANOVA; main effect of genotype F(1,30) = 0.3449, p = 0.5614; n = 16 per genotype; Fig. 4C). These results indicate that En2−/− mice display a preserved ability to acquire a normal sensorimotor function.
Normal sensory-guided exploration in En2−/− mice
To assess whether En2−/− mice rely on their sensory function during a freely moving task, we tested the spontaneous behavior of WT and En2−/− mice in the sensory maze arena. In this task, WT mice should be more attracted by textured walls. Conversely, if En2−/− mice had an altered sensitivity to whisker stimulation, then they would spend a significantly different time than WT mice exploring (or whisking) these zones.
The total exploration time spent in the sensory maze did not differ between genotypes (unpaired t test; WT vs En2−/−; p = 0.2091; n = 16 per genotype; Fig. 4D) nor between sexes within each genotype (two-way ANOVA, main effect of sex F(1,28) = 1.731, p = 0.1990; main effect of genotype F(1,28) = 0.3446, p = 0.5619; n = 8 per sex and genotype; Fig. 4E). Within the total exploration time, WT and En2−/− mice spent the same time exploring the textured and smooth zones (two-way ANOVA; main effect of genotype F(1,60) = F(1,60) = 6.797e−14, p > 0.9999; main effect of maze zone F(1,60) = 2.964, p = 0.0903; n = 16 per genotype; Fig. 4F). Therefore, En2−/− mice appear to be fully capable of using whisker sensations to guide their exploratory behavior, further supporting the idea of preserved perceptive function in these mutants. However, it is important to point out that, because the WT mice did not appear to discriminate between the two wall surfaces, the assay seems to be more informative for general activity rather than somatosensory function.
En2−/− mice display overreactivity to repeated whisker stimulation
To understand whether preserved somatosensory skills in En2−/− mice were associated with an intact processing of somatosensory information, we evaluated the behavioral response of WT and En2−/− mice in the WN test. During this test, the animal's whiskers were repeatedly stimulated with a wooden stick over 3 sequential trial sessions of 5 min each. Behaviors were scored according to 0–10 point scale (Table 2). En2−/− mice displayed a significantly higher score across the 3 trials compared with WT controls (unpaired t test, WT vs En2−/−; p = 0.0173; n = 16 per genotype; Fig. 5A). No differences between sexes were observed within the 2 genotypes (2-way ANOVA, main effect of sex F(1,28) = 0.352, p = 0.5571; main effect of genotype F(1,28) = 5.517, p = 0.0261; n = 8 per sex and genotype; Fig. 5B). Two-way repeated-measures ANOVA revealed a significant effect of genotype and trial (main effect of genotype F(1,30) = 6.070, p = 0.0197; main effect of trial F(3,90) = 59,29, p < 0.0001; n = 16 per genotype; Fig. 5C,D). Both genotypes displayed a normal behavior during the prestimulation session (sham), showing no anxious behavior when the stick was presented in proximity of the animal's head, avoiding any tactile contact (Holm–Sidak's test following two-way repeated-measures ANOVA; WT vs En2−/−; p > 0.05; n = 16 per genotype; Fig. 5C). This indicates that both genotypes react in the same way to the stick approach in the absence of whisker stimulation. Both WT and En2−/− mice exhibited a significant reduction in the anxious response from the first to the third trial (Tukey's test following two-way repeated-measures ANOVA; trial 1 vs trial 3 within WT, < 0.01; trial 1 vs trial 3 within En2−/−, p < 0.01; n = 16 per genotype; Fig. 5D). Conversely, during the three trials of whisker stimulation, the behavioral response of En2−/− mice always resulted significantly higher than that of WT mice (multiple t tests with Bonferroni correction following 2-way repeated-measures ANOVA; WT vs En2−/−; p < 0.05 for all trials; n = 16 per genotype; Fig. 5C,D). We then analyzed the behavioral response of WT and En2−/− mice for each of the five categories used to calculate the WN score. When compared with WT controls, En2−/− mice displayed a significantly higher score in freezing and breathing, indicating a predominant fearful behavior of En2 mutants in response to repeated whisker stimulation (mean score across trials, WT vs En2−/−; unpaired t test, p = 0.0055 for freezing and p = 0.0004 for breathing; n = 16 per genotype; Fig. 5E).
Figure 5.

En2−/− mice are overreactive to repeated whisker stimulation. The figure shows the quantification of behavioral responses in the whisker WN test in WT and En2−/− mice. Five different parameters (response to stick, evasion, stance, fearful behavior, and breathing) were monitored across different trials; the total score indicates three major categories of behavioral responses (0–3 = curious/restful; 4–7 = annoyed/bothered; 8–10 = scared/worried) (Table 2). En2−/− but not WT mice showed fearful responses to repeated whisker stimulation. A, Total WN scores across trials. Single dots indicate the mean value of WN score for each animal across the three trials. B, Total WN scores across trials in female and male mice. Single dots indicate the mean value of WN score for each animal across the three trials. C, WN scores recorded for each animal in sham conditions (no tactile stimulation) and trials. D, Average WN scores assigned to WT and En2−/− mice during trials. E, Mean score across trials for each of the five behavioral parameters monitored during the WN test. All plots report the mean values ± SEM. In A–C, each dot represents the average value per animal. Genotypes are and sexes are as indicated. *p < 0.05, **p < 0.01, ***p < 0.001 (A, E, unpaired t test, WT vs En2−/−; C, D, Multiple t tests with Bonferroni correction following two-way repeated-measures ANOVA, WT vs En2−/−. D, Tukey's test following two-way repeated-measures ANOVA, trial 1 versus trial 3 within both WT and En2−/−).
En2−/− mice show reduced c-Fos activation in the hippocampus and SSp and increased c-Fos expression in the amygdala following WN
The immediate-early gene c-Fos is a reliable marker of neuronal activation due to tactile stimulation (Filipkowski et al., 2000). Therefore, c-Fos induction was analyzed by immunohistochemistry on WT and En2−/− brains 2 h after the end of the WN task to map brain areas activated in the two genotypes following repeated whisker stimulation. SSp layers, hippocampal subfields, and BLA were identified on Nissl-stained adjacent sections (Fig. 5A,D). SSp and hippocampal layering do not differ between WT and En2−/− mice (Sgadò et al., 2013), whereas an anterior shift in the position of the amygdala has been reported in En2−/− mice (Kuemerle et al., 2007).
In both WT and En2−/− mice, c-Fos protein staining was detected in the SSp, hippocampus, and amygdala. Immunohistochemistry experiments revealed a lower number of c-Fos-positive cells in SSp layer IV (Fig. 6B), CA1 pyramidal layer of the hippocampus (Fig. 6C), and BLA (Fig. 6D) of En2−/− mice compared with WT controls. Quantification of immunohistochemistry experiments confirmed a statistically significant reduction of c-Fos-labeled cells in SSp layer IV compared with WT (unpaired t test; WT vs En2−/−; p = 0.0040; n = 10 per genotype; Fig. 6E). The number of c-Fos-labeled cells was also significantly lower in CA1 of En2−/− mice compared with WT (unpaired t test; WT vs En2−/−; p = 0.0078; n = 10 per genotype; Fig. 6F). No difference was detected in the other cortical layers or hippocampal subfields examined (Fig. 6E,F). Conversely, a significantly increased number of c-Fos-labeled cells was detected in the BLA of En2−/− mice compared with WT (unpaired t test; WT vs En2−/−; p = 0.0179; n = 10 per genotype; Fig. 6G).
Figure 6.

WN results in a significantly altered expression of c-Fos-positive in the primary somatosensory cortex, hippocampus, and amygdala of En2−/− mice. A, Representative Nissl-stained coronal sections from WT and En2−/− brains taken at the level of SSp/dorsal hippocampus. B, C, Representative pictures showing c-Fos-positive cells (white) in the SSp (B) and CA1 pyramidal layer (C) of WT and En2−/− mice 2 h after the WN test. Cortical layers are indicated by Roman numbers and layer IV boundaries are indicated by dashed lines. D, Representative pictures showing c-Fos-positive cells (black) in the BLA of WT and En2−/− mice 2 h after the WN test. Scale bars: A, 500 μm; B, 200 μm; C, 100 μm; D, 400 μm. E–G, Quantification of c-Fos-immunoreactive cells in the SSp (E), hippocampus (F), and BLA (G). Values are expressed as the mean number (±SEM) of positive cells per area (0.1 mm2; see Materials and Methods) per group; each dot represents the average value per animal. Genotypes are as indicated. *p < 0.05, **p < 0.01, unpaired t test.
En2−/− mice show reduced c-fos mRNA induction in the SSp following whisker stimulation under anesthesia
To confirm that the reduced c-Fos expression observed in the En2−/− SSp following WN was specifically due to whisker stimulation, we investigated c-fos mRNA induction in the SSp following whisker stimulation in anesthetized WT and En2−/− mice. Whisker stimulation was performed by the same protocol used in the WN test (3 sessions of 5 min each) under urethane anesthesia, which is known to preserve whisker-dependent cortical activity (Unichenko et al., 2018). In situ hybridization experiments showed a reduction of c-fos mRNA staining in the SSp 20 min after the end of the last session (Fig. 7A). Quantification of mean signal intensity confirmed a significantly lower c-fos mRNA expression in the SSp of En2−/− mice compared with WT (unpaired t test; WT vs En2−/−; p = 0.0165; n = 12–16 sections from 4 animals per genotype; Fig. 7B).
Figure 7.
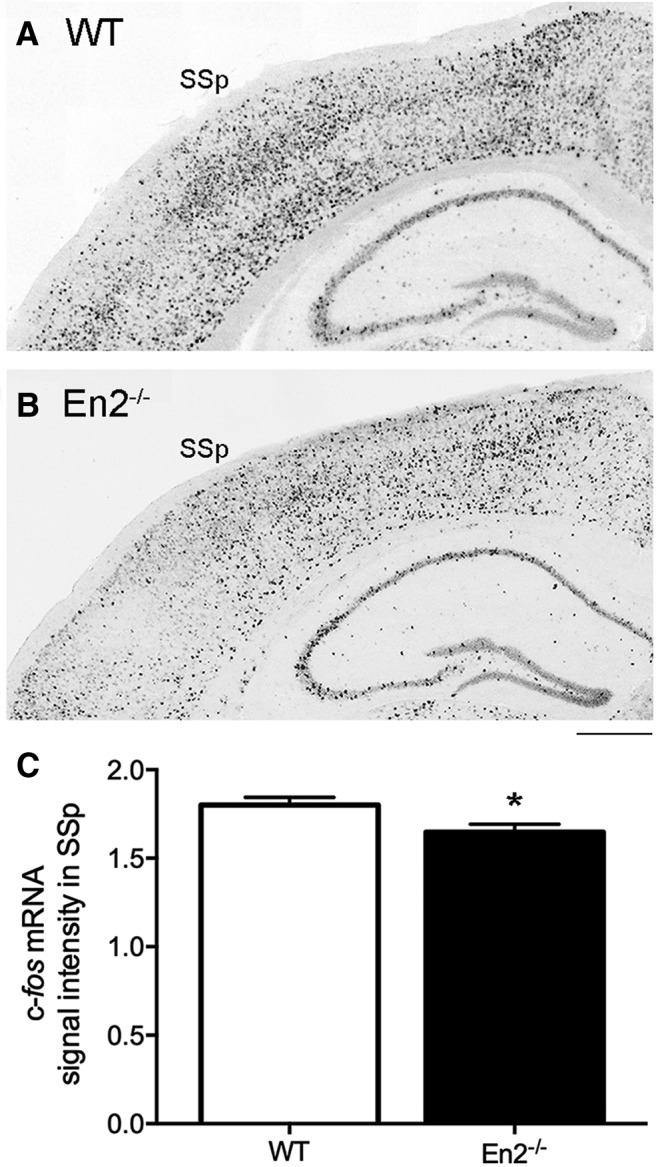
Whisker stimulation under anesthesia results in a significantly reduced induction of c-fos mRNA in the primary somatosensory cortex of En2−/− mice. A, B, Representative pictures showing c-fos mRNA in situ hybridization (dark staining) in the SSp, 20 min after repeated whisker stimulation in anesthetized WT (A) and En2−/− (B) mice. Scale bar, 300 μm. C, Quantification of c-fos mRNA signal intensity in the SSp. Values are expressed as the mean normalized signal intensities (±SEM) per group (see Materials and Methods). Genotypes are as indicated. *p < 0.05, unpaired t test.
Discussion
Functional defects of sensory cortical areas, including the SSp, are common in mice lacking ASD genes. Fmr1 knock-out mice display a hypoconnectivity phenotype for the hippocampus, somatosensory, and auditory cortex (Haberl et al., 2015; Zerbi et al., 2018), similar to what was observed in En2 mutants. Interestingly, En2−/− and Fmr1 knock-out mice share other anatomical and molecular alterations. MRI-based phenotyping showed that both En2 and Fmr1 mutants have an increased volume of frontal/parietal/temporal lobes and a decreased volume of the cerebellar cortex (Ellegood et al., 2015). Moreover, En2−/− mice present a downregulation of Fmr1 mRNA and protein in the hippocampus (Provenzano et al., 2015).
Functional hypoconnectivity of En2−/− sensory cortical areas detected by rs-fMRI (Fig. 1) was not paralleled by microstructural alterations of forebrain and midbrain white matter bundles resulting from DTI (Table 1). This is not surprising because white matter microstructure is known to be a poor predictor of functional connectivity and these two parameters often diverge (Bertero et al., 2018). However, we observed a significant increase of water diffusivity (MD and λ1) in the En2−/− cerebellum (Fig. 2). Given that increases in MD and λ1 in gray matter have been associated with breakdown of microarchitecture and reduced cellularity (Huisman, 2010), this is consistent with earlier reports of cerebellar atrophy in En2 mutants (Joyner et al., 1991; Kuemerle et al., 1997; Ellegood et al., 2015) and in human postmortem samples (Palmen et al., 2004). The notorious sensistivity of rsfMRI to respiratory- and susceptibility-induced artifacts in cerebellar areas (Gozzi and Schwarz, 2016) unfortunately prevented an assessment of the resting state connectivity of this regions with respect to other forebrain areas. A further investigation of this aspect is warranted using complementary neurotechniques.
Cerebellar hypoplasia in En2−/− mice results from disrupted function of En2, which regulates cerebellar patterning during embryonic and early postnatal development (Sudarov and Joyner, 2007; Cheng et al., 2010; Sillitoe et al., 2010). However, cerebellar anatomical defects in En2−/− mice were not accompanied by motor coordination deficits as detected by the CH test (Fig. 4). Therefore, the differences in grip strength detected between En2−/− and WT mice and between male and female animals in both genotypes (Brielmaier et al., 2012) did not affect forelimb dexterity in the CH task. Indeed, En2 mutants display only mild motor deficits (Brielmaier et al., 2012). Purkinje cell loss in the En2−/− cerebellum (Kuemerle et al., 1997) seems instead to mainly affect spatial learning, which indeed depends on Purkinje cell synaptic integrity (Rochefort et al., 2011, 2013) and is altered in En2−/− mice (Cheh et al., 2006; Brielmaier et al., 2012; Provenzano et al., 2014). Exploratory activity in the sensory maze was comparable in WT and En2−/− mice and did not differ between sexes (Fig. 4), indicating that En2−/− mice have preserved somatosensory function. Intriguingly, En2−/− mice did not show altered whisker sensitivity in this sensory task, possibly due to lower anxiety levels in the dark enclosure. En2−/− mice instead showed hyperresponsiveness to whisker stimulation (Figs. 5, 6, 7). Mice bearing ASD-related mutations display altered tactile discrimination and hypersensitivity to gentle touch (Gabrb3 or Mecp2 mutants; Orefice et al., 2016) or hypersensitivity to whisker stimulation (Fmr1 mutants; Zhang et al., 2014; He et al., 2017), suggesting that developmental somatosensory deficits might result in social deficits in adulthood.
The preserved sensorimotor and somatosensory functions observed in En2 mutants suggest that their hyperreactivity to whisker stimulation might be due to an altered signal processing in the SSp. Behavioral hypersensitivity to somatosensory stimuli is often associated with impaired whisker-dependent cortical processing in mice harboring ASD-related mutations. Gabrb3 heterozygote mutant mice display tactile hypersensitivity in the static tactile allodynia task (DeLorey et al., 2011). Mice with Gabrb3 or Mecp2 deletion in somatosensory neurons, as well as Shank3b and Fmr1 mutants, exhibit abnormal sensorimotor gating in a tactile prepulse inhibition test (Orefice et al., 2016). Repetitive whisker stimulation in young (postnatal day 14–16) and adult Fmr1 mutants, respectively, resulted in exaggerated locomotor and active avoidance responses accompanied by a lower number of SSp layer II/II neurons responding to whisker stimulation (He et al., 2017).
Our results expand these findings. En2−/− mice displayed fearful responses to repeated whisker stimulation (Fig. 5). In accordance with SSp functional hypoconnectivity observed in En2 knock-outs, these behaviors were accompanied by a reduced activation of SSp, as shown by decreased c-Fos immunoreactivity in layer IV (Fig. 6). Increased c-Fos staining was instead detected in the BLA of En2−/− mice, indicating an increased activation of the amygdala following WN. Until now, WN has been used to study whisker-dependent behavior in rats with lesions of the somatosensory cortex (McNamara et al., 2010). Our results describing specific behavioral and c-Fos expression patterns in En2−/− mice following WN corroborate the use of this task to evaluate whisker-dependent responses in mice in the absence of experimentally induced lesions. WT and En2−/− mice exhibited a comparable reduction in the anxious response from the first to the third trial during the WN test (Fig. 5D), suggesting that both control and En2 mutant mice tend to habituate to repeated whisker stimulation. Previous studies also showed no difference in anxiety between the two genotypes (Brielmaier et al., 2012). WN score did not differ between sexes in both control and En2 mutant mice (Fig. 5), confirming that En2−/− female and male mice comparably perform in several behavioral tests (Brielmaier et al., 2012) despite some neurochemical differences in cortical areas (Genestine et al., 2015).
We used c-Fos staining to detect activity changes in the brain of En2−/− mice following the WN test. c-Fos induction has long been used as a marker of neuronal activity (Morgan and Curran, 1991) and to map SSp activation following whisker stimulation (Filipkowski et al., 2000; Bisler et al., 2002, Staiger, 2006). Considering that En2−/− mice exhibited behavioral hypersensitivity to repeated stimulation in the WN test (Fig. 5), we would have expected to detect an increased c-Fos staining in the mutant SSp compared with WT controls. Unexpectedly, somatosensory hyperresponsiveness resulted in decreased c-Fos induction in layer IV of SSp in En2−/− mice (Fig. 6). Whisker stimulation under anesthesia also resulted in reduced c-fos expression in the En2−/− SSp (Fig. 7), thus strengthening the data obtained following WN. This is in agreement with a recent study showing decreased (and not increased) whisker-evoked neuronal activity in SSp layer II/III of adult Fmr1 mutant mice (He et al., 2017). As postulated in the Fmr1 study, one possible explanation of our results would be that functional circuits for whisker-dependent information processing are dispersed over a larger spatial area in the En2−/− SSp layer IV, resulting in an apparently reduced proportion of whisker-activated neurons. Indeed, single-whisker stimulation can activate a larger spatial area across the SSp of Fmr1 knock-out mice compared with WT (Arnett et al., 2014; Juczewski et al., 2016). Therefore, similar anatomical defects might be present in the SSp of En2−/− mice, which share anatomical and functional abnormalities with Fmr1 mutants (Ellegood et al., 2015; Haberl et al., 2015; Zerbi et al., 2018).
The limbic system represents one of the convergent zones of cortical processing and is known to receive inputs from all sensory modalities (Shi and Cassell, 1998; Lavenex and Amaral, 2000). Recent studies indicate that somatosensory inputs may control the plastic responses of limbic neurons. As an example, whisker deprivation diminished the firing rate of CA3 neurons (Milshtein-Parush et al., 2017) and altered fear-related c-Fos induction in the amygdala of adult mice (Soumiya et al., 2016). The reduced c-Fos staining observed in En2−/− hippocampal neurons following WN might therefore reflect a diminished hippocampal cell response to repetitive whisker stimulation. Similarly, En2−/− mice showed downregulation of the immediate early gene Arc in hippocampal neurons following Morris water maze training (Provenzano et al., 2014). Therefore, decreased hippocampal activation seems to be a common response to aberrant behavioral performance in these mutants. c-Fos activation in the En2−/− BLA perfectly matches the freezing response shown by mutant mice following WN, as c-Fos induction is a hallmark of fear behavior (Campeau et al., 1991). An anterior shift in the position of the amygdala was detected in En2−/− brains without any differences in volumetric, cell density, or gene expression profile in the mutant amygdalar complex (Kuemerle et al., 2007). Our data also rule out an abnormal functional connectivity of the En2−/− amygdala (Fig. 1). Therefore, the abnormal activation of the BLA in mutant mice is likely due to abnormal processing of somatosensory stimuli rather than major anatomical alterations.
In summary, our results suggest that En2 deletion disrupts functional connectivity and somatosensory stimuli processing in the SSp and connected areas. The disruption of sensory processing in ASD is likely due to impaired function of GABAergic signaling. Accordingly, altered electrophysiological and behavioral markers of sensory processing can be rescued by pharmacologically enhancing GABAergic signaling in ASD mouse models (Provenzano et al., 2017; Bozzi et al., 2018). En2−/− mice present a reduced number of GABAergic interneurons in the hippocampus and somatosensory cortex (Sgadò et al., 2013). Further work is needed to dissect the molecular and anatomical networks by which GABAergic deficits impact somatosensory processing in mice harboring mutations in ASD genes.
Footnotes
This work was supported by a start-up grant from the University of Trento (S.C. and Y.B.). G.C. is supported by Fondazione Telethon (Italy). G.P. is supported by a postdoctoral fellowship from Fondazione Veronesi (Milan, Italy). V.Z. is supported by ETH Career Seed Grant SEED-42 16-1 and by the SNSF AMBIZIONE PZ00P3_173984/1. A.G. is supported by the Simons Foundation (SFARI 314688 and 400101), the Brain and Behavior Foundation (NARSAD Independent Investigator Grant), the National Institute of Mental Health of the National Institutes of Health (Grant R21MH116473), and the European Research Council. Y.B. is a recipient of the Strategic Project TRAIN-Trentino Autism Initiative from the University of Trento. We thank the administrative staff of Center for Integrative Biology (CIBIO) and Center for Mind/Brain Sciences (CIMeC), University of Trento, for assistance and Uwe Mayer (CIMeC) for the kind gift of c-Fos antibody.
The authors declare no competing financial interests.
References
- Arnett MT, Herman DH, McGee AW (2014) Deficits in tactile learning in a mouse model of fragile X syndrome. PLoS One 9:e109116. 10.1371/journal.pone.0109116 [DOI] [PMC free article] [PubMed] [Google Scholar]
- Beckmann CF, Smith SM (2004) Probabilistic independent component analysis for functional magnetic resonance imaging. IEEE Trans Med Imaging 23:137–152. 10.1109/TMI.2003.822821 [DOI] [PubMed] [Google Scholar]
- Benayed R, Gharani N, Rossman I, Mancuso V, Lazar G, Kamdar S, Bruse SE, Tischfield S, Smith BJ, Zimmerman RA, Dicicco-Bloom E, Brzustowicz LM, Millonig JH (2005) Support for the homeobox transcription factor gene ENGRAILED 2 as an autism spectrum disorder susceptibility locus. Am J Hum Genet 77:851–868. 10.1086/497705 [DOI] [PMC free article] [PubMed] [Google Scholar]
- Benayed R, Choi J, Matteson PG, Gharani N, Kamdar S, Brzustowicz LM, Millonig JH (2009) Autism-associated haplotype affects the regulation of the homeobox gene, ENGRAILED 2. Biol Psychiatry 66:911–917. 10.1016/j.biopsych.2009.05.027 [DOI] [PMC free article] [PubMed] [Google Scholar]
- Bertero A, Liska A, Parolisi R, Masferrrer ME, Pagani M, Gritti M, Pedrazzoli M, Galbusera A, Sarica A, Cerasa A, Buffelli M, Tonini R, Buffo A, Gross C, Pasqualetti M, Gozzi A (2018) Autism-associated 16p11.2 microdeletion impairs prefrontal functional connectivity in mouse and human. Brain 141:2055–2065. 10.1093/brain/awy111 [DOI] [PubMed] [Google Scholar]
- Bisler S, Schleicher A, Gass P, Stehle JH, Zilles K, Staiger JF (2002) Expression of c-fos, ICER, Krox-24 and JunB in the whisker-to-barrel pathway of rats: time course of induction upon whisker stimulation by tactile exploration of an enriched environment. J Chem Neuroanat 23:187–198. 10.1016/S0891-0618(01)00155-7 [DOI] [PubMed] [Google Scholar]
- Bozzi Y, Provenzano G, Casarosa S (2018) Neurobiological bases of autism-epilepsy comorbidity: a focus on excitation/inhibition imbalance. Eur J Neurosci 47:534–548. 10.1111/ejn.13595 [DOI] [PubMed] [Google Scholar]
- Brielmaier J, Matteson PG, Silverman JL, Senerth JM, Kelly S, Genestine M, Millonig JH, DiCicco-Bloom E, Crawley JN (2012) Autism-relevant social abnormalities and cognitive deficits in engrailed-2 knockout mice. PLoS One 7:e40914. 10.1371/journal.pone.0040914 [DOI] [PMC free article] [PubMed] [Google Scholar]
- Campeau S, Hayward MD, Hope BT, Rosen JB, Nestler EJ, Davis M (1991) Induction of the c-fos proto-oncogene in rat amygdala during unconditioned and conditioned fear. Brain Res 565:349–352. 10.1016/0006-8993(91)91669-R [DOI] [PubMed] [Google Scholar]
- Cheh MA, Millonig JH, Roselli LM, Ming X, Jacobsen E, Kamdar S, Wagner GC (2006) En2 knockout mice display neurobehavioral and neurochemical alterations relevant to autism spectrum disorder. Brain Res 1116:166–176. 10.1016/j.brainres.2006.07.086 [DOI] [PubMed] [Google Scholar]
- Cheng Y, Sudarov A, Szulc KU, Sgaier SK, Stephen D, Turnbull DH, Joyner AL (2010) The engrailed homeobox genes determine the different foliation patterns in the vermis and hemispheres of the mammalian cerebellum. Development 137:519–529. 10.1242/dev.027045 [DOI] [PMC free article] [PubMed] [Google Scholar]
- Choi J, Ababon MR, Soliman M, Lin Y, Brzustowicz LM, Matteson PG, Millonig JH (2014) Autism associated gene, engrailed2, and flanking gene levels are altered in post-mortem cerebellum. PLoS One 9:e87208. 10.1371/journal.pone.0087208 [DOI] [PMC free article] [PubMed] [Google Scholar]
- DeLorey TM, Sahbaie P, Hashemi E, Li WW, Salehi A, Clark DJ (2011) Somatosensory and sensorimotor consequences associated with the heterozygous disruption of the autism candidate gene, Gabrb3. Behav Brain Res 216:36–45. 10.1016/j.bbr.2010.06.032 [DOI] [PMC free article] [PubMed] [Google Scholar]
- Deschênes M, Timofeeva E, Lavallée P, Dufresne C (2005) The vibrissal system as a model of thalamic operations. Prog Brain Res 149:31–40. 10.1016/S0079-6123(05)49003-2 [DOI] [PubMed] [Google Scholar]
- Diamond ME, von Heimendahl M, Knutsen PM, Kleinfeld D, Ahissar E (2008) 'Where' and 'what' in the whisker sensorimotor system. Nat Rev Neurosci 9:601–612. 10.1038/nrn2411 [DOI] [PubMed] [Google Scholar]
- Ellegood J, Anagnostou E, Babineau BA, Crawley JN, Lin L, Genestine M, DiCicco-Bloom E, Lai JK, Foster JA, Peñagarikano O, Geschwind DH, Pacey LK, Hampson DR, Laliberté CL, Mills AA, Tam E, Osborne LR, Kouser M, Espinosa-Becerra F, Xuan Z, et al. (2015) Clustering autism: using neuroanatomical differences in 26 mouse models to gain insight into the heterogeneity. Mol Psychiatry 20:118–125. 10.1038/mp.2014.98 [DOI] [PMC free article] [PubMed] [Google Scholar]
- Ferrari L, Turrini G, Crestan V, Bertani S, Cristofori P, Bifone A, Gozzi A (2012) A robust experimental protocol for pharmacological fMRI in rats and mice. J Neurosci Methods 204:9–18. 10.1016/j.jneumeth.2011.10.020 [DOI] [PubMed] [Google Scholar]
- Filipkowski RK, Rydz M, Berdel B, Morys J, Kaczmarek L (2000) Tactile experience induces c-fos expression in rat barrel cortex. Learn Mem 7:116–122. 10.1101/lm.7.2.116 [DOI] [PMC free article] [PubMed] [Google Scholar]
- Genestine M, Lin L, Durens M, Yan Y, Jiang Y, Prem S, Bailoor K, Kelly B, Sonsalla PK, Matteson PG, Silverman J, Crawley JN, Millonig JH, DiCicco-Bloom E (2015) Engrailed-2 (En2) deletion produces multiple neurodevelopmental defects in monoamine systems, forebrain structures and neurogenesis and behavior. Hum Mol Genet 24:5805–5827. 10.1093/hmg/ddv301 [DOI] [PMC free article] [PubMed] [Google Scholar]
- Gharani N, Benayed R, Mancuso V, Brzustowicz LM, Millonig JH (2004) Association of the homeobox transcription factor, ENGRAILED 2, 3, with autism spectrum disorder. Mol Psychiatry 9:474–484. 10.1038/sj.mp.4001498 [DOI] [PubMed] [Google Scholar]
- Gonzalez-Perez O, López-Virgen V, Ibarra-Castaneda N (2018) Permanent whisker removal reduces the density of c-Fos+ cells and the expression of calbindin protein, disrupts hippocampal neurogenesis and affects spatial-memory-related tasks. Front Cell Neurosci 12:132. 10.3389/fncel.2018.00132 [DOI] [PMC free article] [PubMed] [Google Scholar]
- Gozzi A, Schwarz AJ (2016) Large-scale functional connectivity networks in the rodent brain. Neuroimage 127:496–509. 10.1016/j.neuroimage.2015.12.017 [DOI] [PubMed] [Google Scholar]
- Grandjean J, Schroeter A, Batata I, Rudin M (2014) Optimization of anesthesia protocol for resting-state fMRI in mice based on differential effects of anesthetics on functional connectivity patterns. Neuroimage 102:838–847. 10.1016/j.neuroimage.2014.08.043 [DOI] [PubMed] [Google Scholar]
- Grandjean J, Zerbi V, Balsters JH, Wenderoth N, Rudin M (2017) Structural basis of large-scale functional connectivity in the mouse. J Neurosci 37:8092–8101. 10.1523/JNEUROSCI.0438-17.2017 [DOI] [PMC free article] [PubMed] [Google Scholar]
- Griffanti L, Salimi-Khorshidi G, Beckmann CF, Auerbach EJ, Douaud G, Sexton CE, Zsoldos E, Ebmeier KP, Filippini N, Mackay CE, Moeller S, Xu J, Yacoub E, Baselli G, Ugurbil K, Miller KL, Smith SM (2014) ICA-based artefact removal and accelerated fMRI acquisition for improved resting state network imaging. Neuroimage 95:232–247. 10.1016/j.neuroimage.2014.03.034 [DOI] [PMC free article] [PubMed] [Google Scholar]
- Haberl MG, Zerbi V, Veltien A, Ginger M, Heerschap A, Frick A (2015) Structural-functional connectivity deficits of neocortical circuits in the Fmr1 (-/y) mouse model of autism. Sci Adv 1: e1500775. 10.1126/sciadv.1500775 [DOI] [PMC free article] [PubMed] [Google Scholar]
- He CX, Cantu DA, Mantri SS, Zeiger WA, Goel A, Portera-Cailliau C (2017) Tactile defensiveness and impaired adaptation of neuronal activity in the Fmr1 knock-out mouse model of autism. J Neurosci 37:6475–6487. 10.1523/JNEUROSCI.0651-17.2017 [DOI] [PMC free article] [PubMed] [Google Scholar]
- Hnoonual A, Sripo T, Limprasert P (2016) Whole-exome sequencing identifies a novel heterozygous missense variant of the EN2 gene in two unrelated patients with autism spectrum disorder. Psychiatr Genet 26:297–301. 10.1097/YPG.0000000000000153 [DOI] [PubMed] [Google Scholar]
- Huisman TA. (2010) Diffusion-weighted and diffusion tensor imaging of the brain, made easy. Cancer Imaging 10:S163–S171. 10.1102/1470-7330.2010.9023 [DOI] [PMC free article] [PubMed] [Google Scholar]
- James SJ, Shpyleva S, Melnyk S, Pavliv O, Pogribny IP (2013) Complex epigenetic regulation of engrailed-2 (EN-2) homeobox gene in the autism cerebellum. Transl Psychiatry 3:e232. 10.1038/tp.2013.8 [DOI] [PMC free article] [PubMed] [Google Scholar]
- James SJ, Shpyleva S, Melnyk S, Pavliv O, Pogribny IP (2014) Elevated 5-hydroxymethylcytosine in the Engrailed-2 (EN-2) promoter is associated with increased gene expression and decreased MeCP2 binding in autism cerebellum. Transl Psychiatry 4:e460. 10.1038/tp.2014.87 [DOI] [PMC free article] [PubMed] [Google Scholar]
- Jenkinson M, Bannister P, Brady M, Smith S (2002) Improved optimization for the robust and accurate linear registration and motion correction of brain images. Neuroimage 17:825–841. 10.1006/nimg.2002.1132 [DOI] [PubMed] [Google Scholar]
- Joyner AL, Herrup K, Auerbach BA, Davis CA, Rossant J (1991) Subtle cerebellar phenotype in mice homozygous for a targeted deletion of the en-2 homeobox. Science 251:1239–1243. 10.1126/science.1672471 [DOI] [PubMed] [Google Scholar]
- Juczewski K, von Richthofen H, Bagni C, Celikel T, Fisone G, Krieger P (2016) Somatosensory map expansion and altered processing of tactile inputs in a mouse model of fragile X syndrome. Neurobiol Dis 96:201–215. 10.1016/j.nbd.2016.09.007 [DOI] [PubMed] [Google Scholar]
- Kuemerle B, Zanjani H, Joyner A, Herrup K (1997) Pattern deformities and cell loss in engrailed-2 mutant mice suggest two separate patterning events during cerebellar development. J Neurosci 17:7881–7889. 10.1523/JNEUROSCI.17-20-07881.1997 [DOI] [PMC free article] [PubMed] [Google Scholar]
- Kuemerle B, Gulden F, Cherosky N, Williams E, Herrup K (2007) The mouse engrailed genes: a window into autism. Behav Brain Res 176:121–132. 10.1016/j.bbr.2006.09.009 [DOI] [PMC free article] [PubMed] [Google Scholar]
- Lavenex P, Amaral DG (2000) Hippocampal-neocortical interaction: a hierarchy of associativity. Hippocampus 10:420–430. [DOI] [PubMed] [Google Scholar]
- Learoyd AE, Lifshitz J (2012) Comparison of rat sensory behavioral tasks to detect somatosensory morbidity after diffuse brain-injury. Behav Brain Res 226:197–204. 10.1016/j.bbr.2011.09.016 [DOI] [PMC free article] [PubMed] [Google Scholar]
- Liska A, Bertero A, Gomolka R, Sabbioni M, Galbusera A, Barsotti N, Panzeri S, Scattoni ML, Pasqualetti M, Gozzi A (2018) Homozygous loss of autism-risk gene CNTNAP2 results in reduced local and long-range prefrontal functional connectivity. Cereb Cortex 28:1141–1153. 10.1093/cercor/bhx022 [DOI] [PubMed] [Google Scholar]
- McNamara KC, Lisembee AM, Lifshitz J (2010) The whisker nuisance task identifies a late-onset, persistent sensory sensitivity in diffuse brain-injured rats. J Neurotrauma 27:695–706. 10.1089/neu.2009.1237 [DOI] [PMC free article] [PubMed] [Google Scholar]
- Milshtein-Parush H, Frere S, Regev L, Lahav C, Benbenishty A, Ben-Eliyahu S, Goshen I, Slutsky I (2017) Sensory deprivation triggers synaptic and intrinsic plasticity in the hippocampus. Cereb Cortex 27:3457–3470. 10.1093/cercor/bhx084 [DOI] [PubMed] [Google Scholar]
- Morgan JI, Curran T (1991) Stimulus-transcription coupling in the nervous system: involvement of the inducible proto-oncogenes fos and jun. Annu Rev Neurosci 14:421–451. 10.1146/annurev.ne.14.030191.002225 [DOI] [PubMed] [Google Scholar]
- Orefice LL, Zimmerman AL, Chirila AM, Sleboda SJ, Head JP, Ginty DD (2016) Peripheral mechanosensory neuron dysfunction underlies tactile and behavioral deficits in mouse models of ASD. Cell 166:299–313. 10.1016/j.cell.2016.05.033 [DOI] [PMC free article] [PubMed] [Google Scholar]
- Pagani M, Bertero A, Liska A, Galbusera A, Sabbioni M, Scattoni ML, Pasqualetti M, Gozzi A (2018) Deletion of autism risk gene Shank3 disrupts prefrontal connectivity. Biorxiv. Available at: https://www.biorxiv.org/content/early/2018/09/06/409284. [DOI] [PMC free article] [PubMed]
- Palmen SJ, van Engeland H, Hof PR, Schmitz C (2004) Neuropathological findings in autism. Brain 127:2572–2583. 10.1093/brain/awh287 [DOI] [PubMed] [Google Scholar]
- Patel AX, Kundu P, Rubinov M, Jones PS, Vértes PE, Ersche KD, Suckling J, Bullmore ET (2014) A wavelet method for modeling and despiking motion artifacts from resting-state fMRI time series. Neuroimage 95:287–304. 10.1016/j.neuroimage.2014.03.012 [DOI] [PMC free article] [PubMed] [Google Scholar]
- Petersen CC. (2007) The functional organization of the barrel cortex. Neuron 56:339–355. 10.1016/j.neuron.2007.09.017 [DOI] [PubMed] [Google Scholar]
- Provenzano G, Pangrazzi L, Poli A, Pernigo M, Sgadò P, Genovesi S, Zunino G, Berardi N, Casarosa S, Bozzi Y (2014) Hippocampal dysregulation of neurofibromin-dependent pathways is associated with impaired spatial learning in engrailed 2 knockout mice. J Neurosci 34:13281–13288. 10.1523/JNEUROSCI.2894-13.2014 [DOI] [PMC free article] [PubMed] [Google Scholar]
- Provenzano G, Sgadò P, Genovesi S, Zunino G, Casarosa S, Bozzi Y (2015) Hippocampal dysregulation of FMRP/mGluR5 signaling in engrailed-2 knockout mice: a model of autism spectrum disorders. Neuroreport 26:1101–1105. 10.1097/WNR.0000000000000477 [DOI] [PubMed] [Google Scholar]
- Provenzano G, Chelini G, Bozzi Y (2017) Genetic control of social behavior: lessons from mutant mice. Behav Brain Res 325:237–250. 10.1016/j.bbr.2016.11.005 [DOI] [PubMed] [Google Scholar]
- Robertson CE, Baron-Cohen S (2017) Sensory perception in autism. Nat Rev Neurosci 18:671–684. 10.1038/nrn.2017.112 [DOI] [PubMed] [Google Scholar]
- Rochefort C, Arabo A, André M, Poucet B, Save E, Rondi-Reig L (2011) Cerebellum shapes hippocampal spatial code. Science 334:385–389. 10.1126/science.1207403 [DOI] [PubMed] [Google Scholar]
- Rochefort C, Lefort JM, Rondi-Reig L (2013) The cerebellum: a new key structure in the navigation system. Front Neural Circuits 7:35. 10.3389/fncir.2013.00035 [DOI] [PMC free article] [PubMed] [Google Scholar]
- Rogers SJ, Hepburn S, Wehner E (2003) Parent reports of sensory symptoms in toddlers with autism and those with other developmental disorders. J Autism Dev Disord 33:631–642. 10.1023/B:JADD.0000006000.38991.a7 [DOI] [PubMed] [Google Scholar]
- Sforazzini F, Schwarz AJ, Galbusera A, Bifone A, Gozzi A (2014) Distributed BOLD and CBV-weighted resting-state networks in the mouse brain. Neuroimage 87:403–415. 10.1016/j.neuroimage.2013.09.050 [DOI] [PubMed] [Google Scholar]
- Sforazzini F, Bertero A, Dodero L, David G, Galbusera A, Scattoni ML, Pasqualetti M, Gozzi A (2016) Altered functional connectivity networks in acallosal and socially impaired BTBR mice. Brain Struct Funct 221:941–954. 10.1007/s00429-014-0948-9 [DOI] [PubMed] [Google Scholar]
- Sgadò P, Genovesi S, Kalinovsky A, Zunino G, Macchi F, Allegra M, Murenu E, Provenzano G, Tripathi PP, Casarosa S, Joyner AL, Bozzi Y (2013) Loss of GABAergic neurons in the hippocampus and cerebral cortex of engrailed-2 null mutant mice: implications for autism spectrum disorders. Exp Neurol 247:496–505. 10.1016/j.expneurol.2013.01.021 [DOI] [PMC free article] [PubMed] [Google Scholar]
- Shi CJ, Cassell MD (1998) Cascade projections from somatosensory cortex to the rat basolateral amygdala via the parietal insular cortex. J Comp Neurol 399:469–491. [DOI] [PubMed] [Google Scholar]
- Sillitoe RV, Vogel MW, Joyner AL (2010) Engrailed homeobox genes regulate establishment of the cerebellar afferent circuit map. J Neurosci 30:10015–10024. 10.1523/JNEUROSCI.0653-10.2010 [DOI] [PMC free article] [PubMed] [Google Scholar]
- Smith SM, Nichols TE (2009) Threshold-free cluster enhancement: addressing problems of smoothing, threshold dependence and localisation in cluster inference. Neuroimage 44:83–98. 10.1016/j.neuroimage.2008.03.061 [DOI] [PubMed] [Google Scholar]
- Soumiya H, Godai A, Araiso H, Mori S, Furukawa S, Fukumitsu H (2016) Neonatal whisker trimming impairs fear/anxiety-related emotional systems of the amygdala and social behaviors in adult mice. PLoS One 11:e0158583. 10.1371/journal.pone.0158583 [DOI] [PMC free article] [PubMed] [Google Scholar]
- Staiger JF. (2006) Immediate-early gene expression in the barrel cortex. Somatosens Mot Res 23:135–146. 10.1080/08990220601045411 [DOI] [PubMed] [Google Scholar]
- Steffey MA, Brosnan RJ, Steffey EP (2003) Assessment of halothane and sevoflurane anesthesia in spontaneously breathing rats. Am J Vet Res 64:470–474. 10.2460/ajvr.2003.64.470 [DOI] [PubMed] [Google Scholar]
- Sudarov A, Joyner AL (2007) Cerebellum morphogenesis: the foliation pattern is orchestrated by multi-cellular anchoring centers. Neural Dev 2:26. 10.1186/1749-8104-2-26 [DOI] [PMC free article] [PubMed] [Google Scholar]
- Tennant KA, Asay AL, Allred RP, Ozburn AR, Kleim JA, Jones TA (2010) The vermicelli and capellini handling tests: simple quantitative measures of dexterous forepaw function in rats and mice. J Vis Exp. Advance online publication. Retrieved July 21, 2010. doi: 10.3791/2076 [DOI] [PMC free article] [PubMed] [Google Scholar]
- Tripathi PP, Sgadò P, Scali M, Viaggi C, Casarosa S, Simon HH, Vaglini F, Corsini GU, Bozzi Y (2009) Increased susceptibility to kainic acid-induced seizures in Engrailed-2 knockout mice. Neuroscience 159:842–849. 10.1016/j.neuroscience.2009.01.007 [DOI] [PubMed] [Google Scholar]
- Unichenko P, Yang JW, Kirischuk S, Kolbaev S, Kilb W, Hammer M, Krueger-Burg D, Brose N, Luhmann HJ (2018) Autism related neuroligin-4 knockout impairs intracortical processing but not sensory inputs in mouse barrel cortex. Cereb Cortex 28:2873–2886. 10.1093/cercor/bhx165 [DOI] [PubMed] [Google Scholar]
- Voos AC, Pelphrey KA, Kaiser MD (2013) Autistic traits are associated with diminished neural response to affective touch. Soc Cogn Affect Neurosci 8:378–386. 10.1093/scan/nss009 [DOI] [PMC free article] [PubMed] [Google Scholar]
- Zalesky A, Fornito A, Bullmore ET (2010) Network-based statistic: identifying differences in brain networks. Neuroimage 53:1197–1207. 10.1016/j.neuroimage.2010.06.041 [DOI] [PubMed] [Google Scholar]
- Zerbi V, Kleinnijenhuis M, Fang X, Jansen D, Veltien A, Van Asten J, Timmer N, Dederen PJ, Kiliaan AJ, Heerschap A (2013) Gray and white matter degeneration revealed by diffusion in an Alzheimer mouse model. Neurobiology of aging 34:1440–1450. 10.1016/j.neurobiolaging.2012.11.017 [DOI] [PubMed] [Google Scholar]
- Zerbi V, Grandjean J, Rudin M, Wenderoth N (2015) Mapping the mouse brain with rs-fMRI: an optimized pipeline for functional network identification. Neuroimage 123:11–21. 10.1016/j.neuroimage.2015.07.090 [DOI] [PubMed] [Google Scholar]
- Zerbi V, Ielacqua GD, Markicevic M, Haberl MG, Ellisman MH, A-Bhaskaran A, Frick A, Rudin M, Wenderoth N (2018) Dysfunctional autism risk genes cause circuit-specific connectivity deficits with distinct developmental trajectories. Cereb Cortex 28:2495–2506. 10.1093/cercor/bhy046 [DOI] [PMC free article] [PubMed] [Google Scholar]
- Zhang D, Snyder AZ, Shimony JS, Fox MD, Raichle ME (2010) Noninvasive functional and structural connectivity mapping of the human thalamocortical system. Cereb Cortex 20:1187–1194. 10.1093/cercor/bhp182 [DOI] [PMC free article] [PubMed] [Google Scholar]
- Zhang Y, Bonnan A, Bony G, Ferezou I, Pietropaolo S, Ginger M, Sans N, Rossier J, Oostra B, LeMasson G, Frick A (2014) Dendritic channelopathies contribute to neocortical and sensory hyperexcitability in Fmr1(-/y) mice. Nat Neurosci 17:1701–1709. 10.1038/nn.3864 [DOI] [PubMed] [Google Scholar]