

Abstract
An essential human skill is our capacity to monitor and execute a sequence of tasks in the service of an overarching goal. Such a sequence can be as mundane as making a cup of coffee or as complex as flying a fighter plane. Previously, we showed that, during sequential control, the rostrolateral prefrontal cortex (RLPFC) exhibits activation that ramps steadily through the sequence and is necessary for sequential task execution using fMRI in humans (Desrochers et al., 2015). It remains unknown what computations may underlie this ramping dynamic. Across two independent fMRI experiments, we manipulated three features that were unique to the sequential control task to determine whether and how they modulated ramping activity in the RLPFC: (1) sequence position uncertainty, (2) sequential monitoring without external position cues (i.e., from memory), and (3) sequential monitoring without multilevel decision making (i.e., task execution). We replicated the ramping activation in RLPFC and found it to be remarkably robust regardless of the level of task abstraction or engagement of memory functions. Therefore, these results both replicate and extend previous findings regarding the function of the RLPFC. They suggest that sequential control processes are integral to the dynamics of RLPFC activity. Advancing knowledge of the neural bases of sequential control is crucial for our understanding of the sequential processes that are necessary for daily living.
SIGNIFICANCE STATEMENT We perform sequences of tasks every day, but little is known about how they are controlled in the brain. Previously we found that ramping activity in the rostrolateral prefrontal cortex (RLPFC) was necessary to perform a sequence of tasks. We designed two independent fMRI experiments in human participants to determine which features of the previous sequential task potentially engaged ramping in the RLPFC. We found that any demand to monitor a sequence of state transitions consistently elicited ramping in the RLPFC, regardless of the level of the decisions made at each step in the sequence or engagement of memory functions. These results provide a framework for understanding RLPFC function during sequential control, and consequently, daily life.
Keywords: executive control, fMRI, prefrontal cortex, sequence
Introduction
Whether it's making your morning cup of coffee or cooking a complex 10-course meal, sequential tasks are common in our daily lives. Such sequences require not only maintaining the end goal (make coffee), but also monitoring and performing multiple subgoals (e.g., grind beans, pour water). The rostrolateral prefrontal cortex (RLPFC), also referred to as (lateral) frontal polar cortex (Brodmann's area 10) or anterior prefrontal cortex (aPFC), has been implicated in many tasks that share processing demands with sequential control tasks. The functions implicated in these nonsequential tasks include managing abstract contexts (Badre and D'Esposito, 2007), cognitive tracking of multiple items or “branching” (Koechlin et al., 1999; Chahine et al., 2015), integration of multiple information sources (Nee et al., 2014), and temporal abstraction (Bahlmann et al., 2015b; Nee and D'Esposito, 2016). Although these tasks were not explicitly sequential, these functional observations led to the general hypothesis that RLPFC might be necessary for sequential cognitive control. Desrochers et al. (2015) tested this hypothesis directly in a sequential task. When participants were asked to repeatedly perform four-item sequences of simple tasks (e.g., color, shape, shape, color), fMRI activation in the RLPFC increased progressively (“ramped”) from the first to last item in the sequence. Further, two, separate transcranial magnetic stimulation (TMS) experiments using the same task showed that stimulating the RLPFC, and not other frontal control regions, produced an increasing number of errors as the sequence progressed, mirroring the observed ramping activation. These results showed that RLPFC is necessary for intact performance of a sequential control task, particularly near the terminal boundary of a sequence.
Because ramping in RLPFC had not been previously observed in nonsequential tasks, a key open question concerns what aspect of this sequential control task drove the ramping activity dynamic in RLPFC. Understanding the conditions needed for this dynamic can provide insight into the functioning of the RLPFC. The Desrochers et al. (2015) task included at least four unique features relative to prior nonsequential tasks. First and foremost, the task was sequential. There was a series of transitions through task “states” that had a defined beginning, end, and directed order throughout. Second, there were no task or positional cues beyond the initial instruction screen. Therefore, the current sequence position had to be monitored internally to perform the task sequence correctly. Third, also following from the absence of external cues, uncertainty regarding current sequence position could grow as one progressed through the sequence to be maximal at the end of the sequence. Finally, the task required managing at least two levels of context-dependent decisions simultaneously: both the task-level choice (i.e., color or shape task) and the stimulus-level categorization.
We hypothesized that only the sequential demands of the task were critical for the ramping dynamic observed in RLPFC. We therefore designed experiments to manipulate the other unique elements of the Desrochers et al. (2015) task and observe whether doing so modulated the ramping dynamic in RLPFC. Specifically, across two separate human fMRI experiments involving a sequential task, we manipulated uncertainty, the levels of context required, and the availability of external cues to sequence position. In the first experiment, we tested whether providing clues to the position within the sequence would manipulate positional uncertainty and so break the potential correlation between increasing uncertainty through the sequence and sequence position. In the second experiment, we removed the two-level decision and only required monitoring of the sequence. Further, we manipulated whether the sequence must be monitored from memory to engage ramping in the RLPFC.
Across these experiments, we replicated the ramping pattern in RLPFC in each sequential task. Importantly, however, we provide novel evidence that ramping in the RLPFC was robust to all of the manipulations that we tested as long as a demand was in place to monitor a sequence of state changes. These results further our understanding of the functional role of RLPFC in sequential tasks and therefore daily human behaviors.
Materials and Methods
Experimental design and statistical analysis
A total of 27 people participated in Experiment 1. One participant was excluded from analyses because of excessive movement (>3 mm multiple times within individual runs) in the scanner, resulting in 26 (19 female) right-handed adults (ages 19–30, mean 22) being included in final analyses for Experiment 1. A total of 50 right-handed adults initially participated in Experiment 2. Before analysis, 10 participants were excluded: two participants were excluded for excessive movement in the scanner (>3 mm multiple times within individual runs), two participants were excluded for sleeping (one completed zero runs of the task; the other completed only two runs with >90% error rate), and the remaining six participants were excluded due to the lack of data available to produce reliable estimates of brain activation and/or >30% error rate on the task. Error rate and available data for analysis are related because only correct blocks were analyzed. The criteria for lack of data were as follows. Runs were only included for analysis if they contained more than two complete, correctly monitored 4-item sequences for each condition (>8 trials). If this criterion resulted in the exclusion of a single run for a participant, then that participant was included (3 participants with single runs were excluded). If, however, this criterion resulted in more than one run being excluded, then the participant was excluded from analysis. The remaining 40 (25 female) right-handed adults (ages 18–29, mean 21) were included in all analyses for Experiment 2. All participants were screened for CNS affecting drugs or conditions, contraindications for MRI, and had normal or corrected-to-normal vision. All behavioral testing and scanning was conducted according to procedures approved by the Human Research Protections Office of Brown University. All participants gave informed, written consent and were compensated for their participation.
Statistical design for the behavioral analyses and fMRI analyses can be found for each experiment under the appropriate subheading below.
Experiment 1
Behavioral procedure
The core behavioral task, timing, and block structure remain the same as in Desrochers et al. (2015) and are briefly summarized here. Experiment control scripts were programed using the Psychophysics Toolbox (RRID:SCR_002881) in MATLAB (MathWorks, RRID:SCR_001622) and were displayed using an Apple computer running Mac OSX. On each trial, participants classified a simple shape according to either its color or shape by pressing one of four response buttons (MR compatible four-button response pad, Mag Design and Engineering, RRID:SCR_009600) within 4 s. The buttons corresponded to “red,” “blue,” “circle,” or “square” and their specific assignment (i.e., which finger pressed each response) was counterbalanced across participants. After the participant responded, the fixation cross was shown and the jittered intertrial interval began (0.25–8 s, mean 2 s).
Participants repeatedly performed four-item sequences of color and shape judgments for each block of 24–27 trials. The sequence was displayed (4 s) at the beginning of each block (e.g., the words “color,” “color,” “shape,” “shape”). As in Desrochers et al. (2015), participants performed two kinds of sequences: simple and complex. Simple sequences contained only one internal task switch (e.g., color, color, shape, shape), whereas complex sequences contained two internal task switches (e.g., color, shape, shape, color). Importantly, the overall number of switches and repeats were balanced between blocks of simple and complex sequences because the first position in a simple sequence was also a task switch when the sequence was repeated. Each block could terminate on any of the four positions in the sequences and participants were asked to report which position in the sequence they would next perform to encourage them to perform the judgments as a sequence. Each of the six total runs consisted of four blocks, two simple and two complex, with the order of color and shape judgments within each sequence counterbalanced.
The key difference between the Desrochers et al. (2015) task and Experiment 1 was the addition of “clue” trials that provided additional information to participants and thus potentially manipulated the uncertainty about sequence position. Clue trials disambiguated which judgment (shape or color) should be performed by presenting a stimulus where one of the judgments would require an answer that was not available. For example, if a green square was presented, then participants should indicate the shape of the stimulus because “green” was not an available response. Green and triangle were used as clues in the color and shape dimension, respectively.
Clue trials comprised ∼25% of the trials within a block. The first four trials (first sequence iteration) in a block were always excluded from analysis and therefore they never contained clues. The variable 0–3 additional trials at the end of the block also never contained clues. Therefore, of the minimum 20 trials that were used in analysis for each block, approximately six trials were clue trials. Clue trials were randomly distributed across positions 2–4 in each sequence; the first position in each sequence was never a clue trial because we assume that the first position is defined by the participant and so is not subject to uncertainty about sequence position (see Desrochers et al., 2015 for discussion).
We took a hidden Markov model approach to predict the uncertainty about the position in the sequence for a subject's particular series of clue and no clue trials. Specifically, we assumed that participants were tracking the latent variable “order,” which corresponds to sequence position and conditioned an inference about the current task. The inferred current task then itself constrained the chosen action (conditioned on the observed stimulus). We specify this graphical model here:
Let Ot in {1:4} be the latent random variable describing the trial order at t. We assume that participants track uncertainty about the current trial t order according to the following:
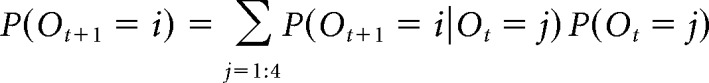 |
Where P(Ot+1 = i|Ot = j) = Trij defines a transition matrix describing the process by which participants keep track of position/order. We assume that, in the absence of a clue at trial t + 1, participants are equally likely to accidentally skip or repeat a count in their tracking of order as captured by parameter τ, but that there is also a small likelihood ε that they will transition to any of the three possible wrong orders. This is formalized by a transition matrix as follows:
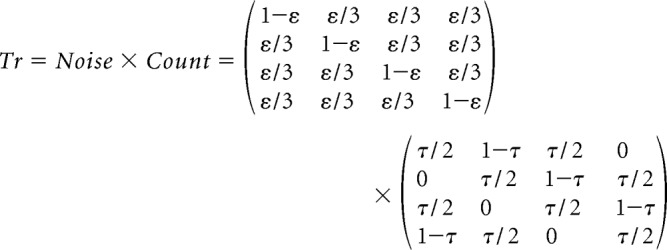 |
In the presence of a clue, we assume that the transition probability matrix Count's values are collapsed to 0 for order values Ot + 1 that do not respect the current cue and that Count is accordingly renormalized. This is mathematically equivalent to inferring through Bayes rule that some order values are impossible conditioned on observing a cue.
Next, we assume that participants' choice at time t is conditioned on their inferred order Ot and stimulus st and is η-greedy, with a bias b for within task errors, specifically:
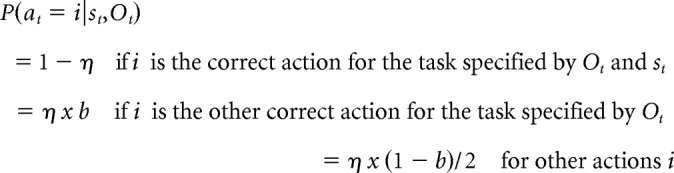 |
This graphical model captures our assumptions of how participants track position order to make choices and their uncertainty about the current position. It allows us to infer participants' uncertainty from their behavior (see “Behavioral analysis” section).
Finally, to optimize the design for fMRI, multiple clue trial distributions were generated for a block and then the correlation between position and a measure of position uncertainty was calculated for each potential clue trial distribution. Uncertainty was operationalized as the entropy over the current position's probability. Clue trial distributions in which the trial-by-trial uncertainty values were least correlated with position itself were chosen for inclusion in the scanning experiment.
Behavioral analysis
As in Desrochers et al. (2015), the following trials were excluded from analysis: the first four trials of every block (96 trials per participant), trials with reaction times (RTs) <100 ms (zero trials across all participants), and trials in which the participant had “lost” their place in the sequence (≥2 trials incorrect in a 4-trial moving window, terminated with 4 correct trials; mean 1.7% of trials per participant). RT analyses excluded error trials. Analyses were collapsed across variants within a sequence type (e.g., color, color, shape, shape; and shape, shape, color, color for simple sequences). For some error rate analyses, differences in baseline chance levels between clue (50% chance) and no clue (25% chance) were accounted for by dividing error rates by two and four, respectively. Repeated-measures ANOVA (RM-ANOVA) and paired t tests were used to assess differences where applicable.
We used computational modeling to infer from subjects' trial-by-trial choices their uncertainty about the task sequence (see Fig. 1d–g). For these analyses, we used all trials and did not exclude trials due to error, RT, or being “lost.” To fit the model to the data, we used the Viterbi algorithm (Viterbi, 1967) to identify the most likely sequence of latent orders for a given block conditioned on parameters. We used this sequence to compute the log likelihood of the observed sequence of choices. We then used standard model-fitting techniques to identify parameters that explained the participants' choices best: specifically, we used MATLAB's fmincon procedure to optimize parameters (τ, ε, η, and b) under constraints in [0, 1]4. Fit parameter values supported the behavioral results that participants performed well in the task: all noise parameters were very low, with mean τ = 0.003 (range [0 0.01]), ε = 0.001 ([0 0.02]), η = 0.01 ([0 0.06]); and the bias parameter favored order knowledge (b = 0.7, [0 1]). The model captured the data well: average likelihood per trial was 0.85 (SD = 0.09, range [0.52–0.99]). The fit parameters and path inferred by Viterbi algorithm over orders (Ot) were used to compute the sequence of P(Ot), t = 1:T for each block. At each trial, we extracted the entropy of the probability over the possible orders.
Figure 1.

Clue task used in Experiment 1. a, Example single trial. b, Example block with the task that should be executed on each trial indicated below each screen. c, Simple and complex sequence types. Color and Shape categorization tasks are generalized to A's and B's. Simple sequences contain one switch (bold) in the interior of the sequence, whereas complex sequences contain two switches (bold). Underlined task switches illustrate that the total number of switches and repeats are balanced when considering the two sequence types across repetitions. d, Example block from a single participant illustrating uncertainty (operationalized as entropy) estimates resulting from the model (see Materials and Methods). The model-inferred order captures the pattern of errors made by the participant in this block and shows that their internal order has shifted. e–g, Entropy averaged across all participants. e, Entropy increases with order number before the first clue in a block, as expected. f, Entropy increases with time within the block before the first clue in a block, as expected. g, The presence of a clue diminishes uncertainty for both sequence order and task. Task entropy reincreases directly after a clue, because knowing that the current task is A is not informative about whether the next task will be A or B.
fMRI procedure
A Siemens 3T Trio Tim MRI system with a 32-channel head coil was used for whole-brain imaging. Anatomical scans consisted of a T1-MPRAGE (repetition time, TR, 2200 ms; echo time, TE, 1.54, 3.36, 5.18, 7.01 ms; flip angle, 7°; 144 sagittal slices; 1.2 × 1.2 × 1.2 mm) and a T1 in-plane (TR, 350 ms; TE 2.5 ms; flip angle, 70°; 38 interleaved transversal slices; 1.5 × 1.5 × 3 mm). Functional images were acquired using a fat-saturated gradient-echo echoplanar sequence (TR, 2 s; TE, 28 ms; flip angle, 90°; 38 interleaved axial slices; 3 × 3 × 3 mm). A mean of 209 functional scans were acquired per run.
fMRI data analysis
As stated previously, one participant was excluded from analysis because of excessive movement (>3 mm, multiple times within individual runs) in the scanner. Analyses were performed using SPM 12 (http://www.fil.ion.ucl.ac.uk/spm, RRID:SCR_007037). Data were slice time and motion corrected, normalized to Montreal Neurological Institute (MNI) stereotaxic space, and smoothed (8 mm isotropic Gaussian kernel).
Within-subject statistical models were constructed under the assumptions of the general linear model (GLM). For all models, regressors were generated by convolving with the canonical hemodynamic response function and included the temporal derivative. The following were included as nuisance regressors for all participants in all models: first four trials in a block, error trials, “lost” trials (see “Behavioral analysis” section), the six motion parameters (translation and rotation), linear drift over the course of each run, block instructions, and sequence position questions.
Regressors were estimated using a subject-specific fixed-effects model. Whole-brain estimates of subject-specific effects were entered into second-level analyses that treated subject as a random effect. One-sample t tests (contrast value vs zero, p < 0.001) were used to assess significance. These effects were corrected for multiple comparisons when examining whole-brain group voxelwise effects using extent thresholds at the cluster level to yield familywise error correction (p < 0.05). Group contrasts were rendered on an inflated MNI canonical brain using Caret (Van Essen et al., 2001; RRID:SCR_006260).
Six GLMs were applied to the data as follows:
Onsets model.
To assess the univariate effects of clue trials, we constructed a model using instantaneous stimulus onset regressors based on the crossing of sequence type (simple/complex) × sequence position (1–4) × clue (clue/no clue).
Parametric sequence position ramp model.
This model tests for ramping activation that increased with sequence position as in Desrochers et al. (2015). Onset regressors were constructed by crossing sequence type (simple/complex) × clue (clue/no clue). A parametric regressor of sequence position (1–4) was added as a modulator of trial onsets for all positions (i.e., separate regressors were not constructed for each position as in the onsets model above). The temporal derivatives of the parametric regressors were also included in the model. Parametric regressors are implemented hierarchically in the GLM; therefore, variance explained by the parametric regressors is above and beyond what can be explained by the onsets alone. Note that clue trials did not exist at position 1, so the parametric sequence position values would only be 2, 3, or 4 for clue trials.
Parametric increasing and decreasing sequence position ramp model.
This model is to provide a contrast for the solo increasing parametric modulator. The model was constructed in the same way as the parametric sequence position ramp model with the addition of a second parametric regressor that decreased as the four positions in the sequence increased (4, 3, 2, 1). We did not orthogonalize the increasing and decreasing parametric regressors to allow them to compete for variance.
Parametric sequence position ramp model excluding position 1.
This model was used as a control. It was constructed the same as the parametric sequence position ramp model above, but with position 1 only modeled as an onset (without a parametric) for both clue and no clue trials.
Sustain versus unique ramp model.
To directly assess whether variance could be better accounted for by sustained or ramping activation, we constructed a pair of models to allow sustain and ramp regressors to compete for variance within the same model. These models contained sustain and ramp regressors (separated for each sequence type and clue presence) in addition to a single regressor for the stimulus onsets at all positions. These regressors started at the stimulus onset of each sequence position 1 and ended at the stimulus offset (response) of sequence position 4. Because the sustain and ramp functions share variance, we sought to identify what variance was uniquely explained by each function. This first of the pair of models sought to determine the variance uniquely explained by the ramp regressor. We orthogonalized (spm_orth.m) the sustain and ramp regressors within each sequence type to remove the shared variance from the ramp regressors (and assign it to the sustain regressors).
Unique:sustain versus ramp model.
This second model of the pair sought to identify any variance uniquely explained by the Sustain regressor (independently of Ramp). Specifically, we removed the shared variance from the sustain regressor (and assigned it to the ramp regressor). All other aspects of the model were the same as the sustain versus unique ramp model above.
Parametric task entropy model:.
This model tests for variance that can be explained by uncertainty, operationalized as entropy obtained from the hidden Markov model. As in the parametric sequence position ramp model, onset regressors were constructed by crossing sequence type (simple/complex) × clue (clue/no clue). Entropy values from the behavioral model fits were added parametrically as a modulator of trial onsets for all positions.
Regions of interest (ROIs) were constructed from clusters of activation in the parametric ramp > baseline contrast in Desrochers et al. (2015) and from clusters of activation in the same contrast in the present study. The ROI defined by the cluster of activation in the RLPFC for the parametric ramp > baseline contrast in Desrochers et al. (2015) will be referred to as the “D15” ROI (center of mass x, y, z = −28, 56, 4; volume 1432 mm; max/min x = −38/−8, y = 46/62, z = −10/18). The RLPFC cluster in the parametric ramp > baseline contrast, defined across conditions and regardless of the sequence type and whether the trial contained a clue, in the parametric sequence position ramp model for Experiment 1 will be referred to as the “clue” ROI (center of mass x, y, z = −29, 50, 21; volume 2160 mm; max/min x = −34/−4, y = 38/60, z = 12/30). To compare ramping activation across models and regions, the mean beta values for the parametric ramp regressor across all voxels in the ROI (taken using MarsBar SPM toolbox, RRID:SCR_009605) were compared using RM-ANOVA or paired t tests where appropriate. The time course of activity across positions was extracted using an 8-time point (16 s) finite impulse response (FIR) model (MarsBar, RRID:SCR_009605) that contained the same regressors as the onset model.
Experiment 2
Behavioral procedure
For the sequence monitoring task in Experiment 2, participants had to monitor a repeated series of four stimuli (based on Allen et al., 2014). On each trial, an image was presented for 1 s. The participant released the response button if the item was out of sequence (OutSeq); otherwise, the item was considered in sequence (InSeq) and the response button was continuously held. Stimuli were serially presented in blocks that were further divided into miniblocks.
Each miniblock was as follows. A solid color screen was presented at the beginning of the block as a “get ready” signal when the participant had to start holding the response button to progress (minimum 0.5 s). The participants continued to hold the response button during the instruction period, during which the four items to be monitored were sequentially presented (0.75 s each) in the correct order. The identity of the stimuli that followed the instruction stimuli differed according to sequence type: visible or occluded. For the visible sequence type, all of the stimuli that followed were members of the original instruction stimuli. During occluded trials, a single placeholder image that was constant throughout the entire experiment was presented in place of items from the sequence. Participants had to monitor the sequence as if the instructed stimuli were still occurring, but were “hidden” by the placeholder image.
After each stimulus presentation, a fixation cross was shown during the jittered intertrial interval (0.25–8 s, mean 2 s). Visible miniblocks terminated with an OutSeq item that was a member of the instruction set presented at the incorrect position (e.g., stimulus instructed at position 1 was shown at position 3). Occluded miniblocks ended with the presentation of an instruction set stimulus (rather than the occluder image) that was either InSeq (participant had to hold) or OutSeq (release) with a 50% probability. A large check (correct) or “X” (error) was shown (0.5 s) as feedback after the last stimulus. Each miniblock could end with equal probability on any of the four positions in the sequence. If the participant released the button incorrectly to an InSeq item prematurely, then the miniblock would proceed immediately to feedback and the rest of the stimuli in the miniblock would not be displayed.
Blocks contained one of each of three possible miniblock lengths: 8, 12, or 16 minimum trials in counterbalanced order. The first miniblock of each block had a red get ready screen to signal that the four instruction stimuli would follow and that the sequence could be different from the previous block. Subsequent miniblocks within the block (miniblocks 2 and 3) had a green get ready screen to indicate the participant should continue to monitor for the same sequence that was instructed at the beginning of the block (during the first miniblock), but start again with the first item.
Four blocks made up a single run. Each block (and its component miniblocks) was a single sequence type. Each participant performed two different sequences during the experiment. Each run contained sequence 1 visible and occluded and sequence 2 visible and occluded with the order of blocks counterbalanced across run. The nine stimuli that composed the two sequences and the occluder image were drawn randomly from a pool of 109 everyday objects for each participant. Before scanning, participants were trained on the sequence monitoring task using example letter stimuli and then were exposed to example blocks of both sequence types using the same stimuli that they would subsequently see in the scanner. Some participants received additional practice while lying in the scanner but before scanning acquisition to become accustomed to the response buttons. Participants were asked to complete six total runs.
Behavioral analysis
When participants performed the sequence monitoring task in Experiment 2, we determined that there were at least two sources of error that were not due to a failure of the participants to monitor the sequence. To avoid unnecessary data loss, we accounted for these errors in the following two ways.
Because participants were nearly continuously holding a sensitive button, occasionally, a slight shift of the participant's pressure on the button or mechanical oscillation between the “pressed” and “released” state would mistakenly trigger the detection of a release. Participants also often indicated that they did not release the button in these instances by verbal report at the next break. These mistakes also happened at times when a release was highly unlikely and the button state had just changed, that is, in the first four stimulus presentations of the miniblock after the get ready screen or instruction stimuli. The out of sequence item was never present those first four items. We therefore identified releases that occurred in the first four stimulus presentations of each miniblock and coded those miniblocks as “button errors” (mean 0.7% total trials or 5.4% miniblocks across participants). Button error miniblocks were excluded from all subsequent analyses.
A second source of error was that participants' release RTs shifted to be slightly slower in the scanner than in prescanning piloting or training. This resulted in the slower tail of the distribution of correct release RTs to be cutoff by the 1 s response deadline. We therefore “recoded” these miniblocks (mean 6.5% across participants) as correct (mean recoded RT = 1.176 s) and included them in all subsequent analyses as correct miniblocks.
After excluding button error miniblocks and including recoded trials, as described previously, runs were only included for analysis if there were greater than 2 4-item sequences (>8 trials) of each condition (visible/occluded block type crossed with sequence position, 3 participants with one run excluded). If this criterion resulted in the elimination of more than one run or a participant's overall error rate based on correct miniblock performance was >30%, then they were excluded from further analyses (6 participants were excluded).
Behavior on the miniblock level was a limited description of the behavior (but necessary because the only “response” was the release at the end of each miniblock) because there were relatively few miniblocks (72 per participant) compared with the total number of stimulus presentations (1044 possible per participant). We therefore categorized trials according to the detection of an OutSeq item. The four detection types were as follows.
Hit.
A release in response to an OutSeq item. These items are considered correct.
Correct rejection.
A hold in response to an InSeq item. All successful holds during visible miniblocks before the OutSeq item were classified as correct rejections. Conversely, in occluded miniblocks, trials in which the occluder image was displayed were not counted as correct rejections because the stimulus was not one of the items in the sequence and could be unambiguously identified as irrelevant. These items were also considered correct.
Miss.
A hold in response to an OutSeq item. These items are considered errors.
False alarm.
A release in response to an InSeq item. These items are considered errors.
Using these trial types, the sensitivity index was calculated as follows:
where Z(p), p ∈ [0,1], is the inverse of the normal cumulative distribution function (Macmillan and Creelman, 2004). To prevent an infinite d′, extreme rates of zero or one were converted to 1/(2N) and 1 − 1/(2N), respectively, where N is the number of trials on which the rate is based (Macmillan and Creelman, 2004).
fMRI procedure
Experiment 2 was scanned at the same facility as Experiment 1, but after the scanner was upgraded to a Siemens 3 T PRISMA system with a 64-channel head coil. Anatomical scans consisted of a T1-MPRAGE (TR, 1900 ms; TE, 3.02 ms; flip angle, 9°; 160 sagittal slices; 1 × 1 × 1 mm) and a T1 in-plane that was the same as in Experiment 1 (TR, 350 ms; TE 2.5 ms; flip angle, 70°; 38 interleaved transversal slices; 1.5 × 1.5 × 3 mm). Functional images were acquired using the same fat-saturated gradient-echo echoplanar sequence as in Experiment 1 (TR, 2 s; TE, 28 ms; flip angle, 90°; 38 interleaved axial slices; 3 × 3 × 3 mm). A mean of 313 functional scans were acquired per run.
fMRI data analysis
As stated previously, two participants were excluded from analysis because of excessive (>3 mm) movement in the scanner. Preprocessing and general model construction was the same for Experiment 2 as in Experiment 1. All analyses were performed in SPM 12 (RRID:SCR_007037). If any trial in the miniblock was incorrect (release to an InSeq item or failure to release to an OutSeq item), then the entire miniblock was coded as an error because it was unknown whether the participant was correctly monitoring the sequence. For the purposes of these models, all the trials within miniblocks classified as “button error” were also coded as error trials (see Experiment 2: “Behavioral analysis” section).
The same parametric sequence position ramp model was constructed as in Experiment 1 to explicitly test for ramping activation over sequence position, with separate onset regressors for visible and occluded trials that the parametric for sequence position (1–4) was added to. The companion control parametric increasing and decreasing sequence position ramp model was also formed. An onsets model was constructed that separated the four positions in the sequence and visible and occluded trials. Similarly, the same pair of models to test whether variance could be better accounted for by sustained or ramping activation, the sustain versus unique ramp model and the unique sustain versus ramp model, were constructed with separate ramp and sustain regressors for visible and occluded trial types. ROIs were constructed from clusters of activation in the parametric ramp > baseline contrast as in Experiment 1. The RLPFC cluster in the parametric ramp > baseline contrast in the parametric sequence position ramp model for Experiment 2 will be referred to as the “monitoring” ROI (center of mass x, y, z = −32, 42, 27; volume 6568 mm; max/min x = −40/−0, y = 26/62, z = 12/46). The time course of activity across positions was extracted using an 8-time point (16 s) FIR model (MarsBar, RRID:SCR_009605) that contained the same regressors as the onset model.
We completed an initial analysis of the fMRI data after acquiring 30 participants. Specifically, we originally hypothesized that there would be a difference in parametric ramping activation betas in the RLPFC between the visible and occluded sequence types. With the 30-participant sample, we found a marginal but not statistically significant effect of sequence type. To determine whether collecting further participants would yield sufficient power to observe this effect, we selected 10 participants at random (due to the lack of an independent pilot dataset on this task) and calculated that, with 80% power, 39 participants would be necessary to observe a difference between visible and occluded ramping betas in the RLPFC. We therefore collected 10 more participants for a total of 40 participants included in Experiment 2. We intended to correct for using a two-stage process by using a Bonferroni correction on the expected type I error rate, i.e., dividing 0.05 by two total “peeks” for a type I error rate of 0.025 at the second stage. However, subsequent simulations revealed that our total experienced chance of type I error across the two stages was p = 0.0548. We emphasize that, even though the experienced chance of type I error was greater than originally planned, this fact did not fundamentally change any of our inferences or conclusions about the data. We included our full methods here in the interest of scientific rigor and transparency.
Results
Experiment 1
In the first experiment, we tested whether manipulating uncertainty would modulate ramping activation in the RLPFC during sequential task performance. Previously, we hypothesized that an accumulation of uncertainty as sequences progress away from the initiation may be responsible for ramping dynamics observed in the RLPFC (Desrochers et al., 2015). However, uncertainty was not separable from sequence position in that initial set of experiments; both steadily increased through the sequence. We designed a task based on the previous sequential task to manipulate the amount of uncertainty that participants experienced at each position in the sequence by providing “clues” throughout their performance of a sequence of tasks (Fig. 1). These clues were designed to explicitly decouple increases in sequence position from increases and decreases in uncertainty.
The behavioral results replicated those found previously (Schneider and Logan, 2006; Desrochers et al., 2015), with RTs providing evidence for sequence level control and that participants performed the sequences of tasks in four item sets as instructed. On trials that did not contain clues, RT at the first position in the sequence was slowed compared with the same trial type (switch or repeat) in the interior of the sequence (position 3) regardless of whether it was a switch or a repeat: simple sequence position 1 (switch) and position 3 (switch) versus complex sequence position 1 (repeat) versus position 3 (repeat) (F(1,25) = 83.3, p = 1.96 × 10⁻⁹, main effect of position in ANOVA; Figure 2a). Because this sequence initiation cost is over and above costs expected from task switching/repeating alone, it can only be due to crossing the unsignaled sequence boundary between position 4 of the previous sequence and position 1 of the next sequence. Consistent initiation costs were not observed in error rate on nonclue trials (sequence type × position 1 and 3, F(1,25) = 0.76, p = 0.39, main effect of position in ANOVA; Fig. 2b).
Figure 2.
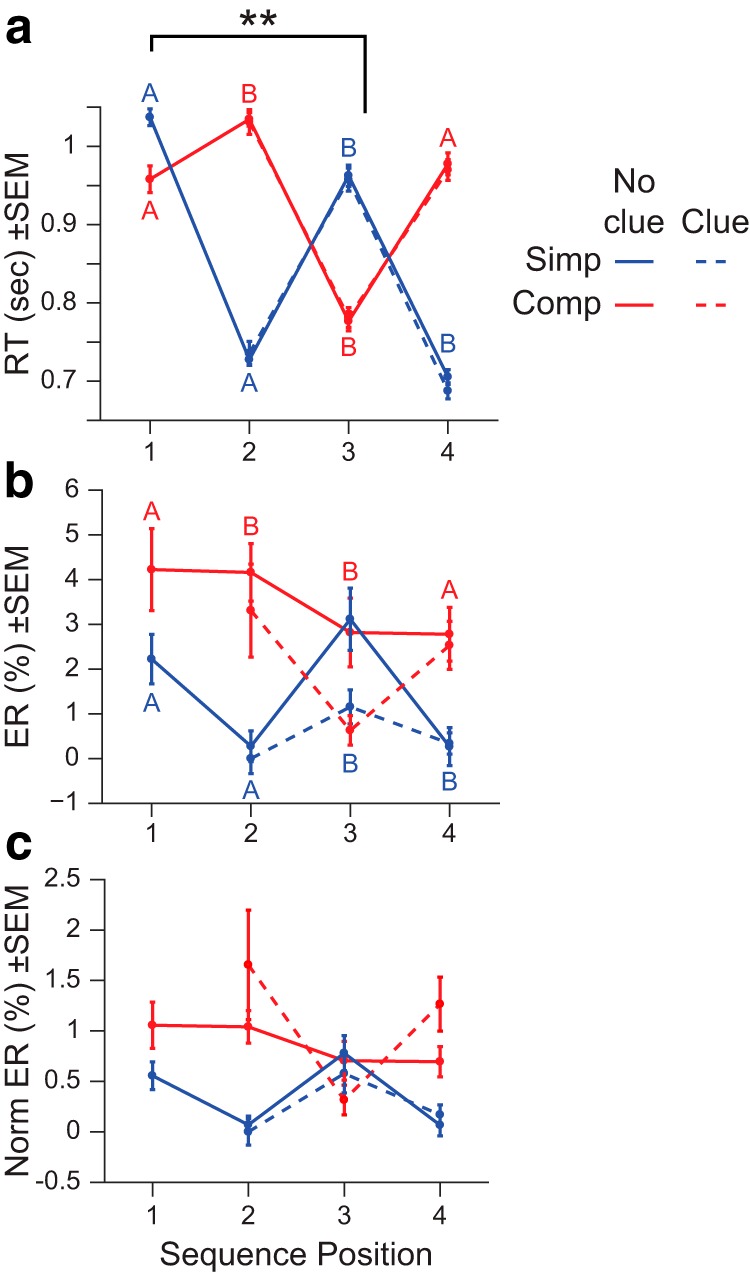
Experiment 1 behavioral results. a, Mean RT across sequence position. Note that clue and no clue RTs nearly perfectly overlap, **p < 0.001. b, Mean error rate (ER) across sequence position. The generic task designation (A or B) is indicated at each data point, color-coded according to the sequence type. c, ER normalized for baseline levels of chance across sequence position.
Clues did not have an effect on RT overall or by position (sequence type × clue × position 2–4, F(1,25) = 0.26, p = 0.61, main effect of clue in ANOVA; Fig. 2a). We did observe a decrease in error rate on clue trials, but this was expected because clues effectively eliminated the incorrect options (sequence type × clue × position 2–4, F(1,25) = 9.72, p = 0.0045, main effect of clue in ANOVA; Fig. 2b). When we normalized the error rate for baseline differences in chance in clue and no clue trials, we no longer observed a reliable difference between the trial types (sequence type × clue × position 2–4, F(1,25) = 0.47, p = 0.5, main effect of clue in ANOVA; Fig. 2c). In the normalized error rates, the effect of clue on error rate differed by sequence position (F(2,50) = 3.52, p = 0.037, ANOVA) such that the reduction in error rate was greatest at position 3. This finding is possibly consistent with a greater benefit later in the sequence due to the resolution of increased uncertainty, but inconclusive due to a lack of a similar effect at position 4.
Given the changes in task from the original sequential task used in Desrochers et al. (2015), namely the addition of clue trials and a potential reduction in response conflict due to spreading out the possible responses over four buttons (instead of two), we next examined ramping activity in the RLPFC in this task. The following analyses also collapsed across clue and no clue conditions to focus on ramping dynamics that are common to both conditions and potentially more general to the sequential task as a whole. First, we conducted a whole-brain voxelwise analysis that tested a parametric ramping function that reset at each position 1 and increased to position 4. This analysis yielded a network of regions including RLPFC, dorsal premotor cortex (PMd), supplementary motor area, and the precuneus (Figs. 3a, Table 1), with the RLPFC and PMd clusters overlapping with those observed in Desrochers et al. (2015).
Figure 3.

Experiment 1 fMRI results. a, Ramping activation in clue task shown with the voxelwise contrast of the parametric ramp regressor > baseline in the parametric sequence position ramp model (see Materials and Methods). Black outline is the location of the D15 ROI. FWE cluster corrected p = 0.05 (height p = 0.001, extent = 176 voxels). b, Voxelwise contrast of clue > no clue trials for sequence positions 2–4 (there were no clues presented at position 1) in the onsets model (see Materials and Methods). Familywise error (FWE) cluster corrected p = 0.05 (height p = 0.001, extent = 156 voxels). c, Mean parametric ramp regressor beta values in the parametric sequence position ramp model for the D15 ROI. d, Mean percentage signal change (±SEM) from the peak (6 s) of the FIR in the D15 ROI.
Table 1.
Experiment 1: clue task
| Location | Extent (voxels) | BA | x | y | z | Peak t-value |
|---|---|---|---|---|---|---|
| L RLPFC | 270 | 10/9 | −30 | 54 | 16 | 4.36 |
| 9 | −28 | 46 | 22 | 4.69 | ||
| R PMd | 484 | 8 | 24 | 14 | 44 | 5.36 |
| 8 | 26 | 8 | 58 | 5.43 | ||
| 6 | 20 | 0 | 60 | 4.03 | ||
| L PMd | 213 | 6/8 | −24 | 10 | 62 | 3.57 |
| 8 | −30 | 6 | 58 | 4.1 | ||
| 6 | −40 | 4 | 60 | 5.09 | ||
| 6 | −44 | −2 | 48 | 5.02 | ||
| L SMA | 384 | 6 | −4 | 6 | 62 | 4.49 |
| 6 | −14 | 2 | 70 | 4.71 | ||
| 6 | −4 | 2 | 70 | 4.6 | ||
| 6 | −2 | −6 | 70 | 4.23 | ||
| R precuneus | 217 | 7 | 10 | −60 | 50 | 4.72 |
| L precuneus | 7 | −4 | −64 | 46 | 4.82 |
Shown are all peaks greater than 8 mm apart in the parametric ramp > baseline contrast shown in Figure 3a (cluster-corrected p = 0.05 FWE, height p = 0.001, extent = 176 voxels). Extent is the cluster size in voxels and is only listed once for each group of peaks belonging to the same cluster. BA, Brodmann's area; SMA, supplementary motor area.
Next, to determine whether variance in RLPFC could be better accounted for by ramping or sustained activation, we constructed a pair of models that pitted ramp and sustain regressors against each other and examined the variance in MR signal from RLPFC that could uniquely be accounted for by each regressor in turn (see Materials and Methods). In the ROI defined by the parametric ramping cluster in RLPFC from Desrochers et al. (2015) (center of mass x, y, z = −28, 56, 4), hereafter the “D15” ROI, we found that variance was better accounted for by ramping over and above what could be accounted for by a sustained function (F(1,25) = 26.4, p = 0.018, ANOVA). As an additional control, we found that variance was better accounted for by an increasing, rather than a decreasing, parametric ramp function in the D15 ROI (F(1,25) = 11, p = 0.003). We therefore replicated ramping activity in the RLPFC during a sequential task despite the occasional presentation of clues in this sequential task.
Because clue trials do not exist at position 1, we also constructed a parametric ramping model that excluded the parametric at position 1 for both clue and no clue trials (position 1 was included as an onset regressor only). To determine whether RLPFC ramping was consistent across the models, we examined the same D15 ROI. Ramping activation in the D15 ROI remained reliable in this parametric model that excluded position 1 (data not shown, t(25) = 3.48, p = 1.86 × 10⁻³, t test) and did not differ between the two models (F(1,25) = 0.03, p = 0.86, ANOVA).
Despite the lack of evidence for the effect of clues on RT, we observed differences in activation across the caudal to midlateral frontoparietal network in clue compared with no clue trials (Fig. 3b). This provided evidence that clues were at least registered by the control system as distinct from the more common no-clue trials.
Theoretically, clues reduced uncertainty and therefore the need for increased RLPFC activation. To determine whether there was an effect of clues on ramping activation in the RLPFC, we compared the variance explained by parametric ramping (mean parametric betas in the GLM) in the previously defined D15 ROI in clue and no clue trials. In this D15 ROI, there was significant ramping activation in the clue task when collapsing across conditions (t(25) = 3.28, p = 0.003, t test vs zero) and when considering them separately (clue trials: t(25) = 2.7, p = 0.01; no clue trials: t(25) = 3.0, p = 0.0066; t tests vs zero). Further, there were no differences based on sequence type (F(1,25) = 0.27, p = 0.61, ANOVA) or the presence or absence of a clue (F(1,25) = 2.63, p = 0.12, ANOVA; Fig. 3c). If anything, the trend is for more, rather than less, activation on clue trials (when uncertainty is reduced). These results were also illustrated by the activity across the positions in the D15 ROI when modeling each position separately and collapsing across sequence type (Fig. 3d).
Because clue trials may appear at varied positions in the sequence and position in the sequence may influence uncertainty, the above analysis does not take into account potential history or position effects in the activity observed in response to clues in the brain. We therefore took a straightforward approach to accounting for potential positional effects in the uncertainty signal by fitting participants' choices with a model that estimated the uncertainty at each position in the sequence (see Materials and Methods). This model has the advantage of decorrelating uncertainty and sequence position because the clues would cause uncertainty decreases at the highest positions (e.g., position 4), rather than uncertainty and position being at the highest point at the same position in the sequence under the assumptions we make. However, modeling uncertainty this way (see Materials and Methods) did not yield any reliable correlations with activation in RLPFC or elsewhere in the brain. In a model that included a parametric regressor for uncertainty on individual position regressors, the parametric > baseline contrast did not yield any suprathreshold clusters (p < 0.001 uncorrected, data not shown). Further, beta values extracted from that contrast were not significantly different from zero in the D15 ROI (t(25) = −0.78, p = 0.44, t test). Therefore, we do not find evidence to support the hypothesis that trial-to-trial uncertainty, as operationalized in this task, underlies ramping activation in the RLPFC. Rather, we again observe ramping activation during sequential task control in this region.
Experiment 2
In Experiment 2, we assessed whether task (i.e., subgoal) performance at each step in the sequence was an essential task component to engage ramping in the RLPFC. We used a simplified task that eliminated the categorization decisions on each trial based on sequence position and rather asked participants to simply monitor the sequential order of presented images either as presented (visible) or internally tracked (occluded) (Fig. 4, adapted from Allen et al., 2014).
Figure 4.

Monitoring task used in Experiment 2. a, Example single trial. b, Two example miniblocks of the sequence monitoring task. Upper row illustrates the Visible sequence type where the instructed sequential stimuli are visible all through the block. Bottom row illustrates the Occluded sequence type where the place holder “occluder” image is shown after the instruction, and are monitored as if the instructed stimuli were present on each screen, but occluded by the place holder. The last image of the block is one of the instructed stimuli, and participants must hold or release according to whether it is InSeq or OutSeq. Example feedback is illustrated as a check mark (correct) or “X” (error). c, Complete example Occluded block consisting of three miniblocks followed by the first miniblock of a Visible block. The red screen and four instruction images are only shown during the first miniblock of each block. The subsequent two miniblocks within a block only show a green screen and monitoring stimuli are presented immediately following it. d, Example run. Each run consists of one of each sequence identity and type with the order counter-balanced across runs and participants.
RT was assessed on trials when the participant released the button. During a release rather than a press, we again found increased RTs at the first position in the sequence (sequence type × position 1 and 2–4, F(1,39) = 21.2, p = 4.26 × 10⁻⁵, ANOVA; Fig. 5a). There was no effect of sequence type (visible or occluded) on RT (F(1,39) = 0.84, p = 0.36, ANOVA). There was again no evidence of increased ER at sequence initiation (sequence type × position 1 and 2–4, F(1,39) = 0.16, p = 0.69, ANOVA; Fig. 5b). However, there were significantly more errors regardless of sequence position in occluded sequences (F(1,39) = 11.0, p = 0.002, ANOVA).
Figure 5.
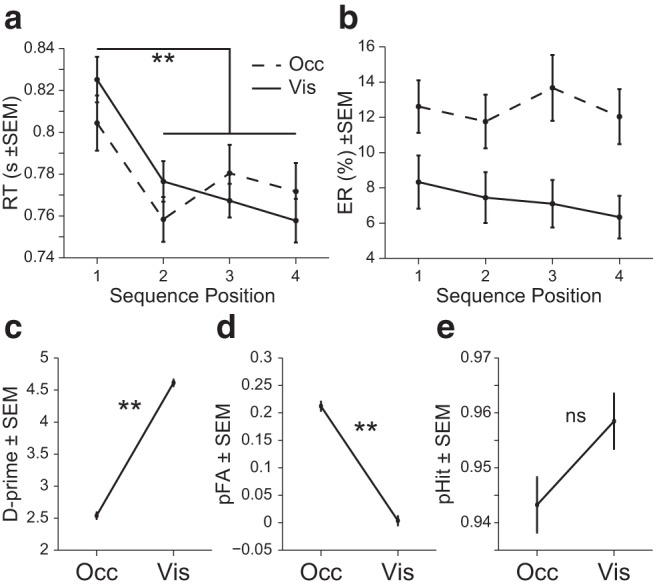
Experiment 2 behavioral results. a, Mean RT across sequence position. b, Mean ER across sequence position. c, Mean sensitivity index (d' or d-prime) across sequence types. d, Mean probability of false alarm (pFA). e, Mean probability of hit (pHit). **p < 0.001; ns, not significant.
To further examine the difference in error rate between occluded and visible sequence types, we analyzed trials according to the detection of an OutSeq item. We found that d′ was greater for visible than occluded blocks (t(39) = −20.0, p = 4.43 × 10⁻²², paired t test; Fig. 5c). This was primarily due to an increase in false alarms (release to an InSeq item) in occluded blocks (t(39) = 12.5, p = 3.37 × 10⁻¹⁵, paired t test; Fig. 5d) because the hit rate did not differ between occluded and visible blocks (t(39) = −1.51, p = 0.14, paired t test; Fig. 5e). Therefore, even though the error rate was different between the sequence types, the participants were equally able to correctly release in response to an OutSeq item.
To determine whether task execution was required to engage ramping in the RLPFC, we first performed a whole-brain voxelwise contrast of parametric ramping activity across both sequence types. Ramping activation was evident in the RLPFC and extended caudal and dorsally along the middle frontal gyrus (Fig. 6a, Table 2). As in Experiment 1, to determine whether variance in RLPFC could be better accounted for by ramping or sustained activation, we constructed a pair of models that pitted ramp and sustain regressors against each other and examined the variance that could uniquely be accounted for by each regressor in turn. In the D15 ROI from the Desrochers et al. (2015) study, we found that variance was better accounted for by ramping over and above what could be accounted for by a sustained function (F(1,39) = 39.8, p = 1.92 × 10⁻⁷, ANOVA). As an additional control, we found that variance was also better accounted for by an increasing, rather than a decreasing, parametric ramp function in the D15 ROI (F(1,39) = 7.2, p = 0.01).
Figure 6.
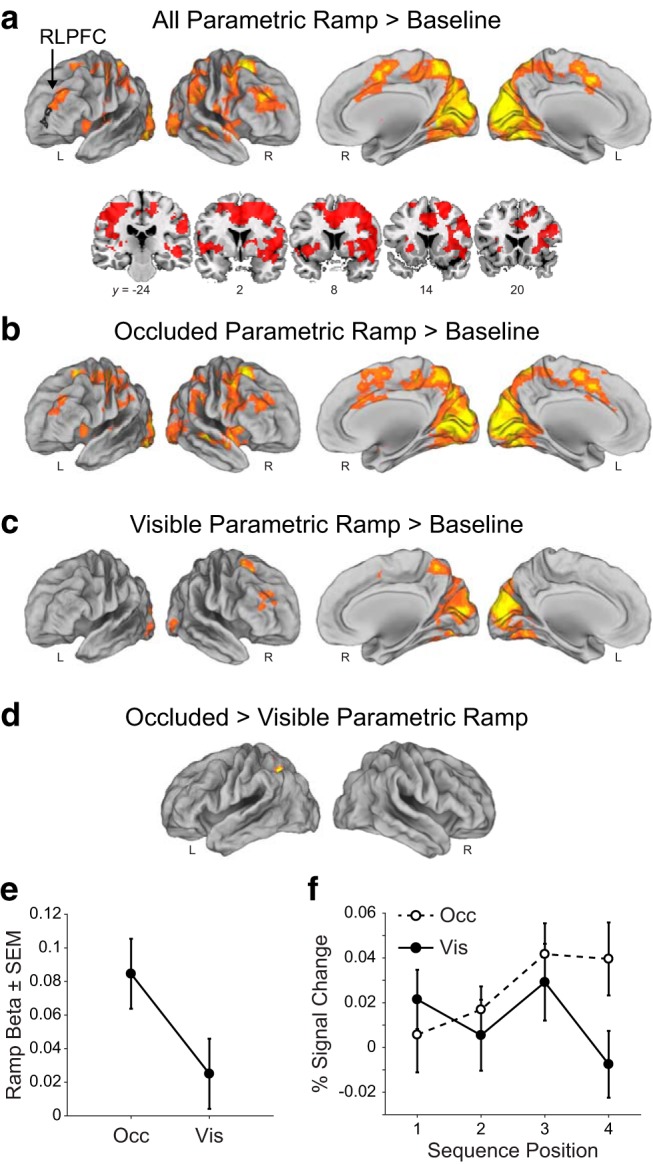
Experiment 2 fMRI results. a, Ramping activation in the monitoring task shown with the voxelwise contrast of the parametric ramp regressor > baseline in the parametric sequence position ramp model (see Materials and Methods). Black outline is the location of the D15 ROI. FWE cluster corrected p = 0.05 (height p = 0.001, extent = 181 voxels). b, Same as a, but only occluded sequence type (height p = 0.001, extent = 191 voxels). c, Same as a, but only visible sequence type (height p = 0.001, extent = 185 voxels). d, Same as a, but occluded > visible (height p = 0.001, extent = 196 voxels). e, Mean parametric ramp regressor beta values for the D15 ROI in the parametric sequence position ramp model. Note the small scale. f, Mean percentage signal change (±SEM) from the peak (6 s) of the FIR in the D15 ROI.
Table 2.
Experiment 2: monitoring task
| Location | Extent (voxels) | BA | x | y | z | Peak t-value |
|---|---|---|---|---|---|---|
| L RLPFC | 821 | 10/46/9 | −36 | 42 | 34 | 5.9 |
| R RLPFC | 50556 | 10/46/9 | 32 | 50 | 32 | 7.59 |
| R IFG, opercularis | 44 | 54 | 16 | 28 | 5.55 | |
| R IFG, triangularis | 48 | 28 | 16 | 28 | 4 | |
| R central operculum | 48 | 48 | 2 | 8 | 5.79 | |
| L central operculum | 48 | −50 | 0 | 2 | 5.74 | |
| L SMA | 6 | −10 | −4 | 58 | 6.92 | |
| R PMd | 6 | 20 | 2 | 60 | 8.68 | |
| R PMd | 6 | 38 | −12 | 38 | 4.09 | |
| L precentral gyrus (M1) | 4 | −36 | −22 | 60 | 7.07 | |
| R anterior cingulate gyrus | 32 | 8 | 36 | 20 | 3.92 | |
| R middle cingulate gyrus | 24 | 4 | 12 | 36 | 5.12 | |
| L middle cingulate gyrus | N/A | −16 | −36 | 44 | 4.29 | |
| R middle temporal pole | 38 | 54 | 8 | −16 | 5.15 | |
| R superior/middle temporal gyrus | 21 | 48 | −20 | −8 | 6.55 | |
| R middle temporal gyrus | 21 | 50 | −46 | −6 | 4.8 | |
| L supramarginal gyrus | 48 | −44 | −22 | 26 | 5.63 | |
| R supramarginal gyrus | 48 | 62 | −28 | 26 | 6.43 | |
| R supramarginal gyrus | 2 | 54 | −32 | 50 | 3.91 | |
| R paracentral lobule | 4 | 10 | −32 | 56 | 5.84 | |
| L lingual gyrus | 18 | −12 | −50 | −2 | 6.42 | |
| L angular gyrus | 39 | −48 | −50 | 28 | 4.45 | |
| L superior parietal lobule | 5 | −16 | −58 | 62 | 6.69 | |
| R superior parietal lobule | 40 | 30 | −42 | 38 | 5.96 | |
| R superior parietal lobule | 7 | 22 | −64 | 54 | 8.18 | |
| L occipital fusiform gyrus | 19 | −28 | −78 | −12 | 8.03 | |
| L calcarine cortex | 17 | −8 | −88 | 8 | 9.74 | |
| R calcarine cortex | 17 | 14 | −64 | 14 | 8.49 | |
| L superior occipital gyrus | 19 | −20 | −82 | 44 | 7.8 | |
| R superior occipital gyrus | 18 | 24 | −88 | 20 | 8.6 | |
| R inferior occipital gyrus | 19 | 44 | −72 | −10 | 5.98 | |
| L putamen | N/A | −24 | 14 | −2 | 5.65 | |
| L putamen | N/A | −30 | −20 | 4 | 4.34 | |
| R putamen | N/A | 24 | 20 | −4 | 5.05 | |
| R putamen | N/A | 18 | −2 | 10 | 4.28 | |
| R cerebellum culmen | N/A | 28 | −52 | −24 | 8.34 | |
| L cerebellum culmen | N/A | −28 | −52 | −24 | 7.25 | |
| R cerebellum exterior | N/A | 6 | −72 | −28 | 6.24 |
Shown are all peaks greater than 25 mm apart in the parametric ramp > baseline contrast (cluster-corrected p = 0.05 FWE). Extent is the cluster size in voxels and is only listed once for each group of peaks belonging to the same cluster. BA, Brodmann's area; IFG, inferior frontal gyrus; SMA, supplementary motor area.
We next contrasted parametric ramping activity separately in the visible and occluded sequence types. We found a greater number of areas, including the RLPFC, that survived statistical correction in the occluded parametric ramp > baseline contrast (Fig. 6b) than in the visible parametric ramp > baseline contrast (Fig. 6c). However, a direct contrast of parametric ramping in the occluded over the visible sequence types yielded only one suprathreshold cluster in the left superior parietal lobule (Fig. 6d).
Follow-up ROI analyses were consistent with the above results. We tested the beta values associated with the parametric ramp regressors in this monitoring task in the D15 ROI. Significant ramping betas in the monitoring task overall were evident in this ROI (t(39) = 2.54, p = 0.015, t test). Further, though the ramping betas were quantitatively larger in the D15 ROI for the occluded task, the difference between the visible and occluded conditions in this ROI did not reach statistical significance (t(39) = 1.43, p = 0.16, paired t test; Fig. 6e). We likewise observed the same trend and lack of statistical significance between visible and occluded when the ROI was defined directly on the overall parametric ramp contrast from Experiment 2 (monitoring ROI, t(39) = 1.35, p = 0.18, paired t test). Therefore, these results cannot provide conclusive evidence for or against the hypothesis that the occluded condition activated RLPFC more or showed greater ramping than when the sequence was visible and merit further experimentation.
Finally, there was limited evidence that the ramping activation in the visible task alone may preferentially be located more caudally than in the Desrochers et al. (2015) task. Even though, when considering the visible and occluded tasks together, the ramping betas in the D15 ROI were significant overall and not statistically different from each other in the two conditions, as discussed above, in the visible task only, ramping betas in the D15 ROI were not significantly different from zero (t(39) = 0.82, p = 0.42, t test; Fig. 6e “Vis”). However, in the more caudal monitoring ROI, the ramping betas for the visible task only were reliable (t(39) = 2.79, p = 0.008, t test) and there was a significant difference between the two ROIs (t(39) = 2.08, p = 0.04, paired t test). Further analyses regarding potential differences in ramping location will be presented below. The ramping in the occluded condition and the relative nonramping in the visible condition in the D15 ROI were also illustrated by the activity across the positions when modeling each position separately (Fig. 6f). In summary, we again found ramping activation in RLPFC over the course of a sequence that was robust across all conditions of the monitoring task.
Comparisons across tasks
Including the previously published study by Desrochers et al. (2015), we have now observed ramping activation in the RLPFC during sequential tasks across three independent datasets (total N = 94). However, the plot of the parametric ramp > baseline contrast from all three experiments reveals that, although the networks are similar, the proximity/overlap of the ramping activation clusters in the RLPFC shows some small differences in spatial locus (Fig. 7a). For example, there did appear to be a trend that clusters derived from sequential tasks that required task execution were both more anterior in their location (Fig. 7b) and showed greater ramping activation when sequences required task execution.
Figure 7.

Comparison across experiments. a, Overlay of the voxelwise contrast of the parametric ramp regressor > baseline in the parametric sequence position ramp model from three different experiments. Red depicts the original task sequence experiment (Desrochers et al., 2015). The Experiment 1 clue task is shown in green, and the Experiment 2 monitoring task is shown in blue. Overlap is shown by the colors indicated in the Venn diagram. b, Same as a, but only showing the left RLPFC cluster from each experiment. These are the three ROIs used throughout. c, In the task sequence experiment (Desrochers et al., 2015), mean parametric ramp regressor beta values in the parametric sequence position ramp model across the three ROIs illustrated in b. d, Same as c, but in the clue Experiment 1. e, Same as c, but in the monitoring Experiment 2.
To directly address whether these differences among the rostral frontal cortex clusters reflect small cross-study differences in peaks across variable samples versus a meaningful difference in activation patterns, we examined the ramping activation (betas associated with the parametric ramp > baseline contrast) from three cluster-based ROIs defined in RLPFC from the parametric ramp contrast from each study (D15 center of mass x, y, z = −28, 56, 4; clue center of mass x, y, z = −29, 50, 21; monitoring center of mass x, y, z = −32, 42, 27; Fig. 7b).
We did not find conclusive evidence of overall differences in ramping activation among the three ROIs in any of the three tasks. Specifically, we did not have strong statistical evidence of a difference by ROI on ramping activation betas across the three clusters in the Desrochers et al. (2015) task sequences experiment (F(2,54) = 2.50, p = 0.092, ANOVA; Fig. 7c), Experiment 1 (F(2,50) = 2.23, p = 0.118, ANOVA; Fig. 7d), or Experiment 2 (F(2,78) = 3.04, p = 0.054, ANOVA; Fig. 7e). However, the differences among the ROIs are trending in the more abstract Desrochers et al. (2015) experiment to be greater in more anterior regions and, in the less abstract Experiment 2, are trending to be greater in more posterior regions. These trends may further support a rostral-to-caudal gradient observed in the locations of the clusters of ramping activation in the RLPFC (Fig. 7b). When divided by condition, the only difference in ramping betas among the ROIs was between the D15 and monitoring ROIs in the visible condition of Experiment 2, as noted in the previous section. Although we cannot conclusively rule out differences across conditions on the basis of these results, we do show consistent ramping activation in the RLPFC across all three datasets.
Discussion
Across two separate experiments, we have replicated and extended the prior observation that ramping activation in the RLPFC accompanies sequential task performance. We provide novel evidence that three features of sequential task control need not be present to engage RLPFC: task state uncertainty, multilevel decision making, and internal maintenance of context. Experiment 1 showed that RLPFC ramping is not affected by the appearance of less-frequent clue stimuli that could reduce uncertainty. Experiment 2 showed that RLPFC exhibits ramping even during a simplified sequential monitoring task that does not require subtask sequencing and performance within the sequence. Further, in this experiment, we found that ramping in the RLPFC was engaged during sequential monitoring in the absence of external cues (i.e., from memory). This remarkable consistency indicates that the ramping dynamic in RLPFC observed in these experiments, and thus likely its functional role, is minimally tied to the sequential nature of these tasks, specifically that they involve monitoring a predictable series of state transitions toward a bound.
The necessity of RLPFC for sequential task control was established in previous combined fMRI and TMS studies (Desrochers et al., 2015). However, several features of the task used in this previous experiment distinguished it from other nonsequential studies and so could have accounted for the novel ramping activation observed in RLPFC.
First, progress through a sequence might result in increased uncertainty under the assumptions that sequence starting position can be arbitrarily defined and so is not uncertain and, after initiation, there is a nonzero probability that one can transition from one task state to another that is out of sequence (i.e., make a sequential error). Therefore, progressively increasing position uncertainty might necessitate an increasing contribution from RLPFC over the course of the sequence to overcome uncertainty (Desrochers et al., 2015; see also White and Monosov, 2016).
In Experiment 1, we provided clue trials to break this confound between sequence position and uncertainty. However, despite replicating ramping activation in the RLPFC, we did not obtain evidence that activation in RLPFC was affected by a reduction in uncertainty from these clue trials. Indeed, RLPFC became more rather than less activated when clues were presented. We do note that, although the brain clearly responded to the less-frequent clues, the reduced errors on clue trials provided only limited behavioral evidence that participants used the clue information to reduce uncertainty. Therefore, it is conceivable that we did not manipulate uncertainty sufficiently to affect the ramping pattern. Nevertheless, we did not find evidence that activation in RLPFC tracks trial-to-trial position uncertainty.
Experiment 2 tested a second unique feature of the sequential control task used by Desrochers et al. (2015): multilevel decision making. Numerous studies have implicated RLPFC in processes that are common to sequential control including representing high-level, abstract, hierarchical information and integration (Badre and D'Esposito, 2007; Nee et al., 2014; Rahnev et al., 2016), multiple courses of action (Koechlin et al., 1999; Braver and Bongiolatti, 2002; Badre et al., 2012), integration of verbal and spatial working memory (Chahine et al., 2015), and temporal control (Nee and D'Esposito, 2016). However, the TMS result from Desrochers et al. (2015) is inconsistent with the idea that RLPFC plays a role in trial-to-trial episodic or temporal control throughout the sequence. These demands are constant throughout the sequence, whereas RLPFC was more necessary near the terminal sequence bound.
Experiment 2 extended this observation by testing two specific proposals regarding RLPFC. First, prior cognitive control research has highlighted RLPFC as potentially important during tasks that require higher-order decisions, either with greater relational integration or more complex rules (i.e., higher policy abstraction) (Koechlin et al., 1999; Badre and D'Esposito, 2007; Nee and Brown, 2013; Parkin et al., 2015). Experiment 2 removed multilevel decision making or abstraction across rules/contexts and nevertheless observed ramping (collapsed across the conditions) in the RLPFC.
Second, RLPFC has been associated with episodic or temporal control (Koechlin et al., 2003; Badre and D'Esposito, 2007; Nee et al., 2014; Bahlmann et al., 2015a,b; Nee and D'Esposito, 2016), which refers to our ability to control behavior based on an internal representation of a temporal context or episode. Experiment 2 manipulated the demand on this type of control by allowing sequences to be monitored either via a presented stimulus or via a remembered representation of the sequence. Ramping in the RLPFC more broadly was engaged even in the presence of external cues (visible condition), when it was not necessary to track an internal episode representation, though this result is specific to the more caudal monitoring and clue ROIs. However, it should be noted that, across all ROIs examined in the RLPFC, ramping activation was quantitatively greater in the condition without external position cues (occluded), although this difference was not statistically significant. Therefore, we do not find evidence in support of or contrary to a difference between visible and occluded items and it is clear that occlusion is not essential to engage ramping activity in RLPFC. Further experiments will be necessary to determine whether there is an interaction between sequential control and internally guided behavior.
We have focused on RLPFC in this work primarily because this region has been the focus of considerable debate regarding its function and has been widely hypothesized to be involved in the kind of temporal control needed for sequential control. It is important to emphasize, however, that RLPFC is not acting as an independent module. Rather, the activations observed in RLPFC are part of a larger network of areas exhibiting ramping activation across these sequential tasks. Among these broader networks, only two areas of ramping activation overlapped across all three experiments: left RLPFC and right PMd (Fig. 7a,b, white areas). This finding again underscores the consistency in RLPFC ramping activation across the tasks. Other network areas show ramping activation that are unique to each of the three experiments. Although it is outside the scope of these experiments to speculate on the unique function of each (Fig. 7a,b, red, green, and blue areas), these areas of unique ramping activation may be related to task-specific demands that differ among the experiments. Therefore, whereas RLPFC functions in a network, it may be consistently involved in these sequential tasks relative to other areas. Future experiments will be necessary to elucidate the potential relationship among these ramping signals.
An important future direction will be to test the hypothesis of whether such ramping activation is dependent on the sequential information being task relevant. It is also possible that, when there is sequential information, the monitoring or tracking of it is automatic regardless of the task relevance. There are paradigms in both the auditory (Wang et al., 2015) and visual domain (Hsieh and Ranganath, 2015; Jiang et al., 2018) in which the sequential information provided is not necessary for the performance of the task. Crucially, these experiments did not test for the presence of ramping activation in the RLPFC. Therefore, this significant question remains unresolved.
In conclusion, ramping activation in RLPFC was found to be robust across multiple tasks requiring monitoring predictable, sequential state transitions. This pattern was not reliably modulated by the presence of informative stimuli, the removal of multilevel task structure, or the presence of external position cues. The critical feature in common among these experiments is that they involve monitoring a sequence of states that occur in a repeated and fixed order. It remains possible that RLPFC may be engaged when memory must be referenced to make serial control decisions or it may track progress toward a goal or sequence bound. Numerous other studies have associated activity in the RLPFC with various boundary conditions (Dobbins et al., 2002; Gilbert et al., 2005; Burgess et al., 2007; Farooqui et al., 2012) and it is possible that RLPFC may play a role in the progress of ongoing temporal events, along with preparing for what is to come next. However, it seems clear from previous work (Desrochers et al., 2015) that RLPFC function is not equally necessary or engaging throughout a sequence. Because we did not conduct TMS in this experiment, the necessity of RLPFC during simpler sequential tasks such as in Experiment 2 has not yet been established. Nevertheless, it is clear that adding sequential structure to a task is crucial to modulating activity in RLPFC. The goal of future work will be to further specify the functional role played by these sequential signals and their potential impact on human behavior.
Footnotes
This work was supported by the National Institutes of Health (National Institute of General Medical Sciences Grant P20GM103645 to T.M.D., National Institute of Neurological Disorders and Stroke Grant F32NS080593 to T.M.D., and National Institute of Mental Health Grant R01 MH111737 to D.B.), the US Office of Naval Research (Grant MURI N00014-16-1-2832), the Carney Institute for Brain Science (Innovation Award to T.M.D. and D.B.), and a Carney Institute grant supporting the use of the Center for Computation and Visualization at Brown University (Grant S10 OD016366). We thank Matthew Maestri, Adriane Spiro, Sarah Master, and Juliana Trach for their contributions to this work and members of the Badre and Desrochers laboratories for many helpful discussions during the preparation of this manuscript.
The authors declare no competing financial interests.
References
- Allen TA, Morris AM, Mattfeld AT, Stark CE, Fortin NJ (2014) A sequence of events model of episodic memory shows parallels in rats and humans. Hippocampus 24:1178–1188. 10.1002/hipo.22301 [DOI] [PMC free article] [PubMed] [Google Scholar]
- Badre D, D'Esposito M (2007) Functional magnetic resonance imaging evidence for a hierarchical organization of the prefrontal cortex. J Cogn Neurosci 19:2082–2099. 10.1162/jocn.2007.19.12.2082 [DOI] [PubMed] [Google Scholar]
- Badre D, Doll BB, Long NM, Frank MJ (2012) Rostrolateral prefrontal cortex and individual differences in uncertainty-driven exploration. Neuron 73:595–607. 10.1016/j.neuron.2011.12.025 [DOI] [PMC free article] [PubMed] [Google Scholar]
- Bahlmann J, Aarts E, D'Esposito M (2015a) Influence of motivation on control hierarchy in the human frontal cortex. J Neurosci 35:3207–3217. 10.1523/JNEUROSCI.2389-14.2015 [DOI] [PMC free article] [PubMed] [Google Scholar]
- Bahlmann J, Beckmann I, Kuhlemann I, Schweikard A, Münte TF (2015b) Transcranial magnetic stimulation reveals complex cognitive control representations in the rostral frontal cortex. Neuroscience 300:425–431. 10.1016/j.neuroscience.2015.05.058 [DOI] [PubMed] [Google Scholar]
- Braver TS, Bongiolatti SR (2002) The role of frontopolar cortex in subgoal processing during working memory. Neuroimage 15:523–536. 10.1006/nimg.2001.1019 [DOI] [PubMed] [Google Scholar]
- Burgess PW, Dumontheil I, Gilbert SJ (2007) The gateway hypothesis of rostral prefrontal cortex (area 10) function. Trends Cogn Sci 11:290–298. 10.1016/j.tics.2007.05.004 [DOI] [PubMed] [Google Scholar]
- Chahine G, Diekhof EK, Tinnermann A, Gruber O (2015) On the role of the anterior prefrontal cortex in cognitive “branching”: an fMRI study. Neuropsychologia 77:421–429. 10.1016/j.neuropsychologia.2015.08.018 [DOI] [PubMed] [Google Scholar]
- Desrochers TM, Chatham CH, Badre D (2015) The necessity of rostrolateral prefrontal cortex for higher-level sequential behavior. Neuron 87:1357–1368. 10.1016/j.neuron.2015.08.026 [DOI] [PMC free article] [PubMed] [Google Scholar]
- Dobbins IG, Foley H, Schacter DL, Wagner AD (2002) Executive control during episodic retrieval: multiple prefrontal processes subserve source memory. Neuron 35:989–996. 10.1016/S0896-6273(02)00858-9 [DOI] [PubMed] [Google Scholar]
- Farooqui AA, Mitchell D, Thompson R, Duncan J (2012) Hierarchical organization of cognition reflected in distributed frontoparietal activity. J Neurosci 32:17373–17381. 10.1523/JNEUROSCI.0598-12.2012 [DOI] [PMC free article] [PubMed] [Google Scholar]
- Gilbert SJ, Frith CD, Burgess PW (2005) Involvement of rostral prefrontal cortex in selection between stimulus-oriented and stimulus-independent thought. Eur J Neurosci 21:1423–1431. 10.1111/j.1460-9568.2005.03981.x [DOI] [PubMed] [Google Scholar]
- Hsieh LT, Ranganath C (2015) Cortical and subcortical contributions to sequence retrieval: schematic coding of temporal context in the neocortical recollection network. Neuroimage 121:78–90. 10.1016/j.neuroimage.2015.07.040 [DOI] [PMC free article] [PubMed] [Google Scholar]
- Jiang J, Wagner AD, Egner T (2018) Integrated externally and internally generated task predictions jointly guide cognitive control in prefrontal cortex. Elife 7. [DOI] [PMC free article] [PubMed] [Google Scholar]
- Koechlin E, Basso G, Pietrini P, Panzer S, Grafman J (1999) The role of the anterior prefrontal cortex in human cognition. Nature 399:148–151. 10.1038/20178 [DOI] [PubMed] [Google Scholar]
- Koechlin E, Ody C, Kouneiher F (2003) The architecture of cognitive control in the human prefrontal cortex. Science 302:1181–1185. 10.1126/science.1088545 [DOI] [PubMed] [Google Scholar]
- Macmillan NA, Creelman CD (2004) Detection theory: a user's guide, Ed 2 Mahwah, NJ: Lawrence Erlbaum Associates. [Google Scholar]
- Nee DE, Brown JW (2013) Dissociable frontal-striatal and frontal-parietal networks involved in updating hierarchical contexts in working memory. Cereb Cortex 23:2146–2158. 10.1093/cercor/bhs194 [DOI] [PMC free article] [PubMed] [Google Scholar]
- Nee DE, D'Esposito M (2016) The hierarchical organization of the lateral prefrontal cortex. Elife 5:e12112. 10.7554/eLife.12112 [DOI] [PMC free article] [PubMed] [Google Scholar]
- Nee DE, Jahn A, Brown JW (2014) Prefrontal cortex organization: dissociating effects of temporal abstraction, relational abstraction, and integration with FMRI. Cereb Cortex 24:2377–2387. 10.1093/cercor/bht091 [DOI] [PMC free article] [PubMed] [Google Scholar]
- Parkin BL, Hellyer PJ, Leech R, Hampshire A (2015) Dynamic network mechanisms of relational integration. J Neurosci 35:7660–7673. 10.1523/JNEUROSCI.4956-14.2015 [DOI] [PMC free article] [PubMed] [Google Scholar]
- Rahnev D, Nee DE, Riddle J, Larson AS, D'Esposito M (2016) Causal evidence for frontal cortex organization for perceptual decision making. Proc Natl Acad Sci U S A 113:6059–6064. 10.1073/pnas.1522551113 [DOI] [PMC free article] [PubMed] [Google Scholar]
- Schneider DW, Logan GD (2006) Hierarchical control of cognitive processes: switching tasks in sequences. J Exp Psychol Gen 135:623–640. 10.1037/0096-3445.135.4.623 [DOI] [PubMed] [Google Scholar]
- Van Essen DC, Drury HA, Dickson J, Harwell J, Hanlon D, Anderson CH (2001) An integrated software suite for surface-based analyses of cerebral cortex. J Am Med Inform Assoc 8:443–459. 10.1136/jamia.2001.0080443 [DOI] [PMC free article] [PubMed] [Google Scholar]
- Viterbi AJ. (1967) Error bounds for convolutional codes and an asymptotically optimum decoding algorithm. IEEE Trans Inf Theory 13:260–269. 10.1109/TIT.1967.1054010 [DOI] [Google Scholar]
- Wang L, Uhrig L, Jarraya B, Dehaene S (2015) Representation of numerical and sequential patterns in macaque and human brains. Curr Biol 25:1966–1974. 10.1016/j.cub.2015.06.035 [DOI] [PubMed] [Google Scholar]
- White JK, Monosov IE (2016) Neurons in the primate dorsal striatum signal the uncertainty of object-reward associations. Nat Commun 7:12735. 10.1038/ncomms12735 [DOI] [PMC free article] [PubMed] [Google Scholar]