Abstract
Serotonin (5-hydroxytryptamine, 5-HT) receptor agonists are neuroprotective in CNS injury models. However, the neuroprotective functional implications and synaptic mechanism of 8-hydroxy-2- (di-n-propylamino) tetralin (8-OH-DPAT), a serotonin receptor (5-HT1A) agonist, in an adult male Wistar rat model of chronic glaucoma model remain unknown. We found that ocular hypertension decreased 5-HT1A receptor expression in rat retinas because the number of retinal ganglion cells (RGCs) was significantly reduced in rats with induced ocular hypertension relative to that in control retinas and 8-OH-DPAT enhanced the RGC viability. The protective effects of 8-OH-DPAT were blocked by intravitreal administration of the selective 5-HT1A antagonist WAY-100635 or the selective GABAA receptor antagonist SR95531. Using patch-clamp techniques, spontaneous and miniature GABAergic IPSCs (sIPSCs and mIPSCs, respectively) of RGCs in rat retinal slices were recorded. 8-OH-DPAT significantly increased the frequency and amplitude of GABAergic sIPSCs and mIPSCs in ON- and OFF-type RGCs. Among the signaling cascades mediated by the 5-HT1A receptor, the role of cAMP-protein kinase A (PKA) signaling was investigated. The 8-OH-DPAT-induced changes at the synaptic level were enhanced by PKA inhibition by H-89 and blocked by PKA activation with bucladesine. Furthermore, the density of phosphorylated PKA (p-PKA)/PKA was significantly increased in glaucomatous retinas and 8-OH-DPAT significantly decreased p-PKA/PKA expression, which led to the inhibition of PKA phosphorylation upon relieving neurotransmitter GABA release. These results showed that the activation of 5-HT1A receptors in retinas facilitated presynaptic GABA release functions by suppressing cAMP-PKA signaling and decreasing PKA phosphorylation, which could lead to the de-excitation of RGC circuits and suppress excitotoxic processes in glaucoma.
SIGNIFICANCE STATEMENT We found that serotonin (5-HT) receptors in the retina (5-HT1A receptors) were downregulated after intraocular pressure elevation. Patch-clamp recordings demonstrated differences in the frequencies of miniature GABAergic IPSCs (mIPSCs) in ON- and OFF-type retinal ganglion cells (RGCs) and RGCs in normal and glaucomatous retinal slices. Therefore, phosphorylated protein kinase A (PKA) inhibition upon release of the neurotransmitter GABA was eliminated by 8-hydroxy-2- (di-n-propylamino) tetralin (8-OH-DPAT), which led to increased levels of GABAergic mIPSCs in ON- and OFF-type RGCs, thus enhancing RGC viability and function. These protective effects were blocked by the GABAA receptor antagonist SR95531 or the 5-HT1A antagonist WAY-100635. This study identified a novel mechanism by which activation of 5-HT1A receptors protects damaged RGCs via the cAMP-PKA signaling pathway that modulates GABAergic presynaptic activity.
Keywords: 5-HT1A receptor, GABA release, glaucoma, neuroprotection, protein kinase A
Introduction
Serotonin (5-hydroxytryptamine, 5-HT) is an endogenous monoamine neurotransmitter and neuromodulator derived from tryptophan that has been shown to function as a crucial regulator of neuronal connectivity in laboratory animals and clinical studies (Hidaka, 2009; Rojas and Fiedler, 2016). The diverse effects of 5-HT are mediated via various 5-HT receptors, including the 5-HT1 to 5-HT7 receptors (Osborne et al., 1981; Chanut et al., 2002). Although the 5-HT3 receptor is ionotropic, other 5-HT receptor subtypes are metabotropic, including seven transmembrane G-protein-coupled receptors (Hannon and Hoyer, 2008). 5-HT receptors and their associated intracellular pathways are targets of drug therapies for many neurodegenerative disorders (Nichols and Nichols, 2008). 5-HT is synthesized by numerous neurons in the CNS and retinas as an outgrowth of the forebrain and is therefore part of the CNS. 5-HT and its receptors have been found in the cornea, lens, iris, ciliary body, aqueous humor, and retina (Crider et al., 2003; Lograno and Romano, 2003; Sharif and Senchyna, 2006) and RT-PCR analysis demonstrated that the 5-HT1A, 5-HT2A, 5-HT2C, 5-HT3, and 5-HT7 receptor subtypes are normally expressed in the retinas of rats (Sharif and Senchyna, 2006), suggesting that the monoamine system has an important role in the regulation of visual function. Convincing evidence has suggested that 5-HT is present in the retinas of mammals (Crider et al., 2003; Lograno and Romano, 2003; Sharif and Senchyna, 2006) and has many functions, including altering retinal amacrine cell processing, increasing or decreasing intraocular pressure (IOP), and constricting or dilating ocular blood vessels (George et al., 2005).
Evidence suggests that agonists of 5-HT1A receptors are capable of decreasing IOP in mammals (Osborne et al., 2000; May et al., 2003), NMDA toxicity and ischemia/reperfusion insults to retinal ganglion cells (RGCs) are attenuated by the 5-HT1A receptor agonist 8-hydroxy-2- (di-n-propylamino) tetralin (8-OH-DPAT) (Osborne et al., 2000). However, whether activation of 5-HT1A receptors plays a neuroprotective role and functions as a synaptic mechanism in an in vivo model of chronic rat glaucoma produced by episcleral vein cauterization (EVC) remains unknown.
Communication between retinal neurons is dominated by the neurotransmitter-mediated chemical signaling (Yang, 2004) that occurs at the synaptic terminals in the outer and inner plexiform layers. Glutamate excitotoxicity leads to retinal degeneration in the pathogenesis of glaucoma and retinal ischemia (Ishikawa, 2013). Clinically validated anticonvulsants, including valproic acid, tiagabine, and topiramate, can also prevent NMDA and glutamate-induced excitotoxic damage to neural ganglion cells in the inner retina (Yoneda et al., 2003; Pisani et al., 2006; Biermann et al., 2010; Kimura et al., 2015). Inhibitory signaling progresses via amacrine and horizontal cells and is primarily mediated by GABA. Deficits in GABAA receptor-mediated neurotransmission have been implicated in pathophysiological and neurodegenerative disorders (Yang et al., 2015). GABA-modulatory drugs have also been used as clinical anticonvulsants, which are mediated by decreased excitatory signaling and increased inhibitory signaling (Rogawski and Löscher, 2004). Previous studies on the chronic glaucomatous model in our laboratory demonstrated that RGC survival is promoted by regulating the release of presynaptic GABA (Zhou et al., 2017a,b).
The activity of the 5-HT1A receptor exerts a modulatory effect by changing neuronal firing. Electrophysiological studies have shown that activation of 5-HT1A receptors in the serotonergic neurons of raphe nuclei (autoreceptor) induces cell hyperpolarization (Tada et al., 2004; Polter and Li, 2010). Nonetheless, in the ventral hippocampus, 5-HT1A receptor activity induces an indirect excitatory response via the inhibition of GABAergic interneuron activity induced by hyperpolarization (Schmitz et al., 1995). Whether 5-HT1A receptors in the retina mediate depolarization or hyperpolarization and if the GABAergic system is affected by 5-HT1A receptors in retinal neurons are questions that have largely been ignored in previous studies. Therefore, studying the mechanisms of 5-HT1A receptor actions on regulating the function of the GABA system could provide important insights into their physiological and pathological functions in glaucoma. Based on these findings, we conducted electrophysiological and molecular biology experiments in rats to determine whether and how 5-HT1A receptors regulate GABAergic synaptic transmission in the inner retina.
Materials and Methods
Animals.
All experimental procedures conformed to the Association for Research in Vision and Ophthalmology Statement for the Use of Animals in Ophthalmic and Vision Research and the guidelines of Fudan University on the ethical use of animals. Experiments were performed with a total of 200 adult male Wistar rats 2 months of age weighing 200–250 g (SLAC Laboratory Animal). The rats were maintained under a 12 h light/dark cycle at 23 ± 2°C and a humidity level of 60–70%. The animals were deeply anesthetized by intraperitoneal injection of ketamine (80 mg/kg) and xylazine (8 mg/kg) (volume ratio of 2:1). Proparacaine hydrochloride (0.5% Alcaine; Alcon-Couvreur) was applied as a topical anesthetic and 0.3% tobramycin (Tobres; Alcon-Couvreur) was applied to prevent postsurgical infection. All efforts were made to minimize the number of animals used and their suffering.
Rat model of ocular hypertension.
As described previously (Mittag et al., 2000; Wu et al., 2010; Chen et al., 2011), episcleral veins located near the superior and inferior rectus muscles of the right eye were precisely isolated and cauterized. The left eye underwent a sham operation isolating the veins without cauterization. IOP was measured using a calibrated tonometer (Tono-Pen XL; Mentor) before surgery and at 1, 2, 3, 4, and 6 weeks after surgery. IOP was recorded as the mean of 5 consecutive measurements with a deviation of <5% (Mittag et al., 2000).
Western blotting.
Protein preparation and Western blotting were performed according to our previously described methods (Wu et al., 2010). Briefly, retinal lysates were centrifuged at 12,000 × g for 10 min at 4°C. Ten micrograms of each sample was separated by SDS-PAGE and electrotransferred to PVDF membranes (Immobilon-P; Millipore). The membranes were blocked with nonfat milk (5%) for 2 h at room temperature and incubated with the following primary antibodies overnight at 4°C: a rabbit polyclonal antibody against the 5-HT1A receptor (ab85615, 1:1000; Abcam), a rabbit monoclonal antibody against protein kinase A (PKA) C-α (#5842, 1:1000; Cell Signaling Technology), and a rabbit monoclonal antibody against phosphorylated PKA (p-PKA) C (Thr197) (#5661, 1:1000; Cell Signaling Technology). The membranes were incubated with horseradish peroxidase-conjugated AffiniPure goat anti-rabbit IgG (H + L) (111–035-003, 1:5000; Cell Signaling Technology). The relative intensities of the protein bands were quantified by scanning densitometry using ImageJ software. GAPDH was used as an internal standard.
Immunohistochemistry.
Immunohistochemistry was performed as described previously (Wu et al., 2010). Briefly, 10- μm-thick cryosections were fixed in 4% paraformaldehyde for 20 min at room temperature and then incubated in 0.1% Triton X-100/PBS for 20 min at 37°C, followed by incubation in 3% bovine serum albumin/PBS for 1 h at room temperature. The cryosections were then incubated with the following primary antibodies for 1 d at 4°C: a rabbit polyclonal antibody against the 5-HT1A receptor (Abcam catalog #ab85615, RRID:AB_10696528, 1:200); a mouse monoclonal against synaptophysin (Abcam catalog #ab8049, RRID:AB_2198854, 1:50), which was used for labeling presynaptic terminals; and a rabbit polyclonal to GABA (Sigma-Aldrich catalog #A2052, RRID:AB_477652, 1:100) for GABAergic AII amacrine cells. The secondary antibodies were an Alexa Fluor 488-conjugated goat anti-rabbit IgG antibody (Thermo Fisher Scientific catalog #A-11070, RRID:AB_2534114, 1:500), a 555-conjugated donkey anti-rabbit IgG antibody (Thermo Fisher Scientific catalog #A-31572, RRID:AB_162543, 1:1000), and a 488-conjugated donkey anti-mouse IgG antibody (Thermo Fisher Scientific catalog #A-21202, RRID:AB_141607, 1:500). The sections were finally counterstained with the nucleic acid stain Hoechst 33258 (Thermo Fisher Scientific catalog #H3569, RRID:AB_2651133, 1:2000) in PBS and imaged using a laser scanning confocal microscope under 20× and 63× oil-immersion objection lenses (TCS SP8; Leica Microsystems).
Preparation of retinal slices and electrophysiological recording.
The eyes of rats were rapidly removed and transferred to oxygenated sucrose and an iced cutting solution containing the following (in mm): NaHCO3 26, NaH2PO4 1.25, sucrose 124, KCl 3, sodium pyruvate 3, CaCl2 0.2, MgCl2 3.8, and glucose 10, pH 7.4. Retinal slices were cut 200 μm thick using a manual slicer and were then incubated for 40 min before recording in artificial CSF (ACSF) containing the following (in mm): NaCl 125, KCl 3, NaHCO3 26, NaH2PO4 1.25, glucose 15, CaCl2 2, and MgCl2 1, pH 7.4. The retinal slices were placed in a chamber, covered with nylon mesh, and continuously perfused with oxygenated (95% O2 and 5% CO2) ACSF at a rate of 2–3 ml/min. To record IPSCs, the internal solution contained the following (in mm): CsCl 150, CaCl2 0.1, MgCl2 1, HEPES 10, EGTA 1, GTP-Na 0.4, ATP-Mg 4, and Lucifer yellow 5, pH 7.2 adjusted with CsOH, 275–290 mOsm/L; the electrode impedance was 4–8 MΩ. RGCs in retinal slices were visualized with an infrared differential interference contrast-sensitive charge-coupled device camera (Nikon) using a water-immersion objective lens at 40× magnification and an intracellular injection of Lucifer yellow (Li et al., 2017). When the cells were ruptured, whole-cell configuration was attempted in RGC membranes under a glass pipette tip and the neurons were voltage clamped at −70 mV using an Axopatch-Multiclamp 700B Amplifier (Molecular Devices) (sampling frequency at 10 kHz, filter frequency at 1 kHz) coupled to a digital analog converter Digidata 1440A system (Molecular Devices). Fast capacitance was fully canceled and cell capacitance was partially canceled by the 700B amplifier. In practice, only the series resistance compensation was applicable (70–80%) (Ji et al., 2012). Cells with clear and full cell bodies were selected for sealing and the resting potential was −50.8 ± 0.9 mv (n = 21) (Li et al., 2017). After steady current recording (control), cells were held at the resting membrane potential for at least 15 min before drugs were applied with a gravity-fed superfusion system. To observe whether receptor antagonists or signaling pathway blockers can block the effects of 8-OH-DPAT, a pregravitational perfusion antagonist was sequentially given, followed by the simultaneous administration of 8-OH-DPAT. Any antagonist was applied 15 min before and during agonist (8-OH-DPAT) application. At the end of all drug applications, fresh extracellular fluid was irrigated via the gravity administration system until the baseline current was restored to its original level. To avoid the desensitization associated with repeated drug use, we tried to use one round of agent per slice. Even when agents were used on different cells in the same slice, we rinsed thoroughly until the baseline current returned to its original level. Using Clampfit 10.2 (Molecular Devices), the effects of drugs on spontaneous and miniature IPSCs (sIPSCs and mIPSCs, respectively) were sampled. Mini Analysis (Synaptosoft) and Origin 8.0 software were used to analyze synaptic activity.
Retrograde labeling of RGCs.
RGC survival after injury was quantitatively studied by FluoroGold retrograde labeling. RGC cell bodies in the ganglion cell layer and axon bundles in the nerve fiber layer of the retina were clearly visible upon imaging in a flat-mount preparation (Shabanzadeh et al., 2015). FluoroGold was injected in the axon terminals of RGCs, which mainly reside in the lateral geniculate nucleus and superior colliculi (Perry and Cowey, 1984; Jeffries et al., 2014). The axon terminals take up the FluoroGold dye, which flows through the axon, transporting it from the peripheral axon to the parent body and dendrites (Reynolds et al., 2000; Abbott et al., 2013). Later, epifluorescence imaging was used to visualize FluoroGold-prelabeled RGCs. Twenty-one days after EVC, the head of an anesthetized rat was fixed in a stereotactic apparatus and the fluorescent tracer 3% FluoroGold (2 μl; Sigma-Aldrich) diluted in saline was administered via microinjection into the bilateral superior colliculi (6.0 mm posterior and 2.0 mm lateral to the bregma and 4–4.5 mm deep) as described previously (Ju et al., 2005). FluoroGold is taken up by the axon terminals of the RGCs and transported retrogradely to the somas in the retina (Sellés-Navarro et al., 1996). FluoroGold persists in RGCs in vivo for 3 weeks without significant fading or leakage. Twenty-eight days after EVC (7 d after FluoroGold injection), the retinas were dissected, divided into four quadrants (nasal, temporal, upper, and lower), and flat-mounted on glass slides with the ganglion cell layer (GCL) facing up. As shown in Figure 10A, in each quadrant, RGC density was measured in each eccentricity (distances of 1 and 3 mm from the optic disk) and counted in 2 sampling fields (0.64 × 0.64 mm each) in a blinded manner. A total of 16 micrographs per retina (two from the central and two from the peripheral retina for each quadrant, eight micrographs in a central and eight micrographs in a peripheral location per retina) were captured with a laser scanning confocal microscope (TCS SP8; Leica Microsystems) at 20× magnification using a wide-band ultraviolet excitation filter. The cells were counted by an investigator who was blinded to the study treatments. RGC densities (cells/mm2) were grouped by retinal eccentricity (central and peripheral) and expressed as the mean ± SEM.
Figure 10.
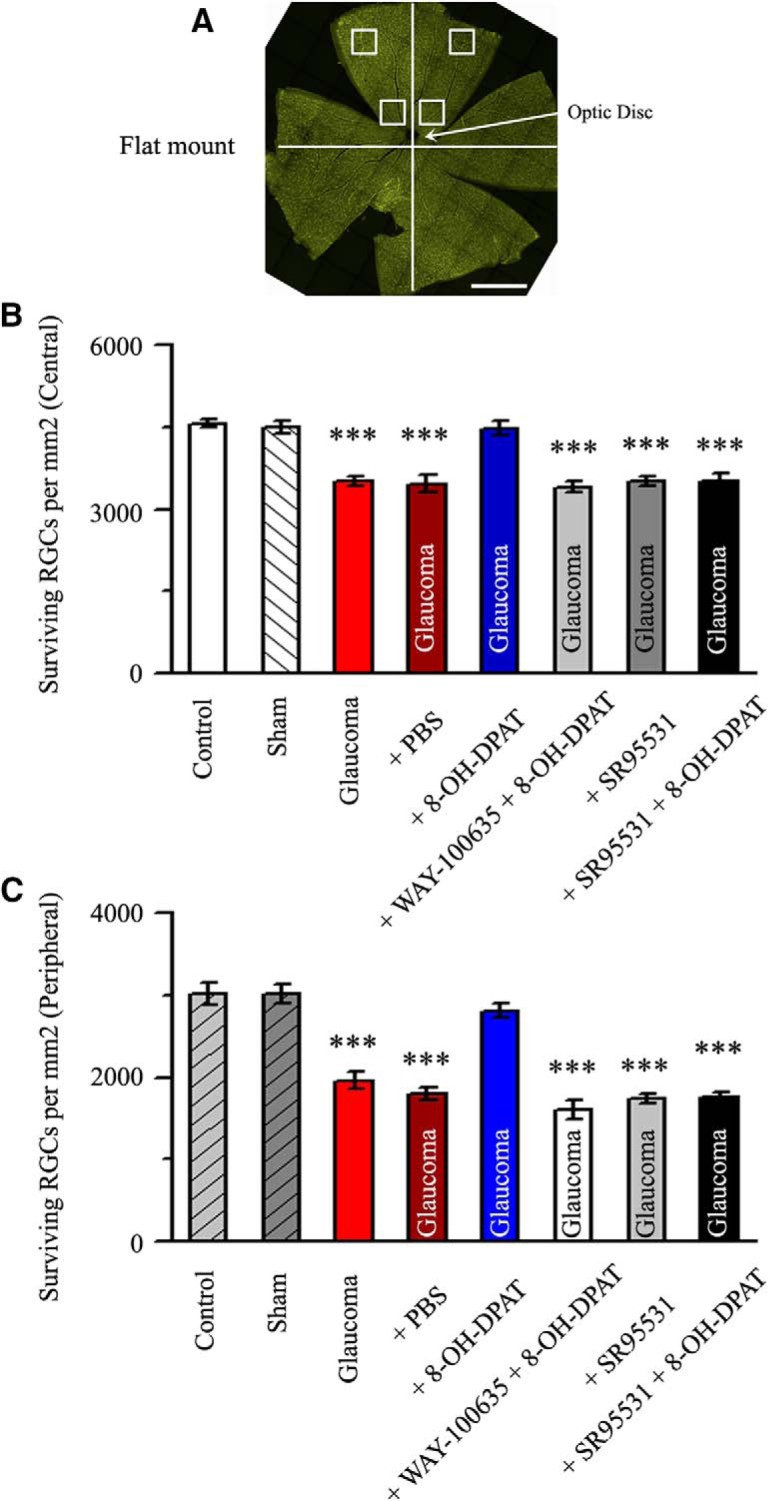
Quantitative analysis of the density of surviving RGCs. A, Flat-mount retina showing the two eccentric areas of RGC quantification (central and peripheral). Scale bar, 1 mm. B, C, Quantitative analysis of the density (cells/mm2) of surviving RGCs in control eyes, sham, glaucoma, PBS-treated ocular hypertension eyes, high IOP eyes treated with 8-OH-DPAT, and ocular hypertension eyes treated with WAY-100635 + 8-OH-DPAT, SR95531, and SR95531 + 8-OH-DPAT (n = 6) in the central (B) and peripheral (C) regions (***p < 0.001 vs control).
Drug administration.
In the in vivo vitreous cavity administration experiment, the tip of a needle was inserted into the superior hemisphere of the eye at a 45° angle through the sclera into the vitreous body. Some rats received an intravitreal injection of 5 μl of 8-OH-DPAT (10 μm), WAY-100635 (N-[2-[4-(2-methoxyphenyl)-1-piperazinyl] ethyl]-N- (2-pyridinyl), 10 μm) + 8-OH-DPAT (10 μm), SR95531 (2-[3-carboxypropyl]-3-amino-6-methoxyphenyl-pyridazinium bromide, 100 μm) or SR95531 (100 μm) + 8-OH-DPAT (10 μm), and this protocol was repeated weekly thereafter. The control eyes received intravitreal injections of 5 μl of PBS. In the ex vivo whole-cell patch-clamp electrophysiological recordings experiment, QX314 (lidocaine N-ethyl bromide; 2.0 mm) was added to the pipette solution to block rapid Na+ currents when recording mIPSCs. The following drugs were applied using a gravity-fed superfusion system of patch-clamp recording: tetrodotoxin (TTX, 1 μm, to abolish spontaneous action potentials), 6-cyano-7-nitroquinoxaline-2,3-dione (CNQX, 10 μm) and D-2-amino-5-phosphonovalerate (AP5, 50 μm) (to inhibit ionotropic glutamate receptors), and strychnine (5 μm, to block glycine receptors). In some slices, WAY-100635 (10 μm) was applied 15 min before and during 8-OH-DPAT application to block the 5-HT1A receptor, H-89 (10 μm) was applied 15 min before and during 8-OH-DPAT application to block the cAMP-PKA pathways, and bucladesine (10 μm) was applied 15 min before and during 8-OH-DPAT application to activate the cAMP-PKA pathways. All drugs were purchased from Sigma-Aldrich. For details, please see Table 1.
Table 1.
Agents used for whole-cell patch-clamp recording
| Agents | Functional description | Additive dose (μm) |
|---|---|---|
| 8-OH-DPAT | 5-HT1A receptor agonist | 10 |
| WAY-100635 | 5-HT1A receptor antagonist | 10 |
| SR269970 | 5-HT7 receptor antagonist | 10 |
| Phentolamine | Nonselective α-adrenoceptor antagonist | 10 |
| Prazosin | Selective α1-adrenoceptor antagonist | 10 |
| Yohimbine | Selective α2-adrenoceptor antagonist | 10 |
| Brimonidine | Selective α2-adrenoceptor agonist | 10 |
| SR95531 | Selective GABAA receptor antagonist | 10 |
| H-89 | PKA inhibitor | 10 |
| Bucladesine | PKA activator | 10 |
| CNQX | Non-NMDA ionotropic glutamate receptor antagonist | 10 |
| AP5 | NMDA ionotropic glutamate receptor antagonist | 50 |
| Strychnine | Glycine receptor antagonist | 5 |
| TTX | Selective sodium channel blocker | 1 |
| QX314 | Rapid Na+ current blocker | 2000 |
Experimental design and statistical analysis.
In 200 adult male Wistar rats, eight or nine retinal slices were evaluated per retina and the number of cells (n) for each comparison is given in the corresponding results. In the ex vivo whole-patch-clamp experiments, all statistical comparisons were performed for single RGCs of retinal slices in three groups: a control group and agonist-treated groups with or without the antagonist. In the molecular experiments, all statistical comparisons were performed for protein samples in each of the groups: control or sham, as well as glaucomatous groups with or without drug treatment. For each tested parameter, data distributions are represented in the histograms. Descriptive statistics are presented as the mean ± SEM. Mean frequency and amplitude between two groups were analyzed using Student's t test, ON-type and OFF-type RGC groups were compared using independent-samples t tests, and means among multiple groups were compared using SPSS one-way ANOVA with Bonferroni's post hoc test. P represents the significance of SPSS one-way ANOVA. In all tests, p < 0.05 was considered statistically significant.
Results
Ocular hypertension reduces retinal 5-HT1A receptor expression
The model of chronic rat glaucoma was successfully prepared by increasing the IOP by EVC (Wu et al., 2010) (Fig. 1A). The effect of glaucoma surgery was therefore highly significant (F(6,42) = 8.085, p = 0.0003, ANOVA). The IOP was significantly elevated at 1 week after cauterization (15.82 ± 0.77 mmHg, n = 7, p = 0.002 vs control; p = 0.00016 vs sham), 2 weeks after cauterization (18.3 ± 1.65 mmHg, n = 7, p = 0.001 vs control; p = 0.001 vs sham), 3 weeks after cauterization (18.07 ± 1.69 mmHg, n = 7, p = 0.002 vs control; p = 0.001 vs sham), 4 weeks after cauterization (17.67 ± 1.42 mmHg, n = 7, p = 0.003 vs control; p = 0.003 vs sham), and 6 weeks after cauterization (16.82 ± 1.31 mmHg, n = 7, p = 0.014 vs control; p = 0.012 vs sham) relative to that in control eyes (10.6 ± 0.33 mmHg, n = 7) and sham eyes (10.5 ± 0.31 mmHg, n = 7).
Figure 1.
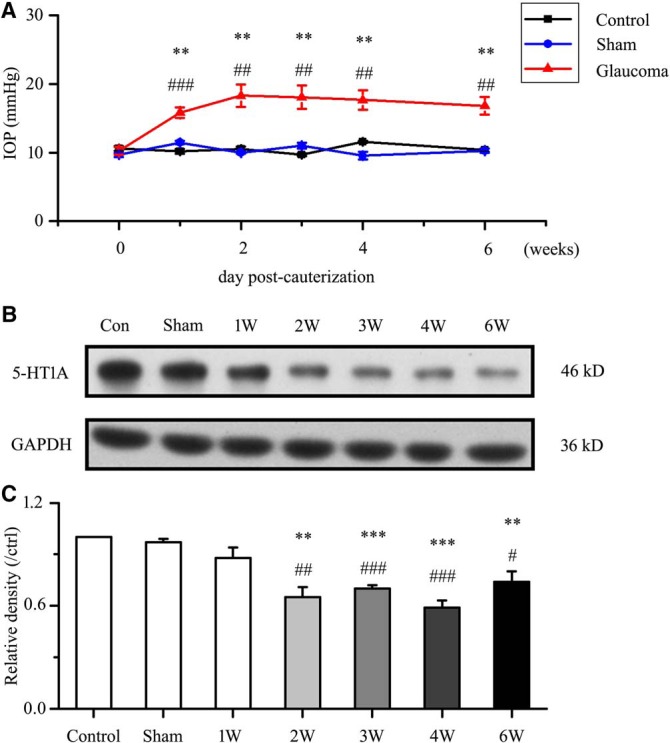
Chronic ocular hypertension reduces retinal 5-HT1A receptor expression. A, Changes in IOP after cauterization. The IOP is significantly greater in glaucomatous eyes than in control and sham eyes (*p < 0.05, **p < 0.01 vs control retina, #p < 0.05, ## p < 0.01, ### p < 0.001 vs sham retina). B, Representative Western blot of 5-HT1A receptor expression in control, sham and glaucomatous retinas at 1, 2, 3, 4, and 6 weeks. The expression of the 46 kDa protein decreases at 2 weeks after high IOP and is sustained for up to 6 weeks. 5-HT1A receptor expression was normalized to the GAPDH level and is shown relative to its expression in control retinas. C, Densitometric analysis of 5-HT1A receptor expression from 1–6 weeks (n = 6) after high IOP. Expression was normalized to the expression in the control retina (**p < 0.01, ***p < 0.001 vs control retina, #p < 0.05, ##p < 0.01, ###p < 0.001 vs sham retina).
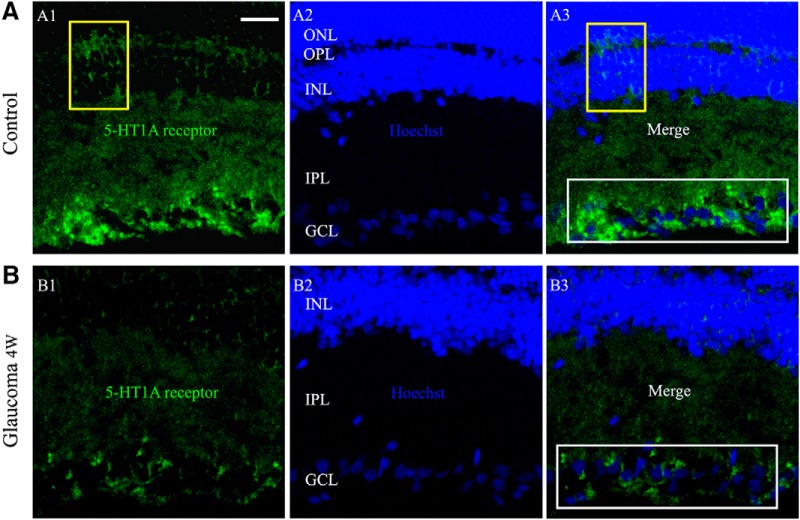
We next assessed whether 5-HT1A receptor protein levels were altered in glaucomatous rat retinas relative to those in control and sham retinas. Western blot analysis showed marked decreases in 5-HT1A receptor protein levels in glaucomatous retinas relative to those in control and sham retinas from 2–6 weeks after the IOP was increased (Fig. 1B,C). The results after glaucoma surgery were highly significant (F(6,35) = 14.755, p = 0.0001, ANOVA). The mean 5-HT1A receptor protein level decreased to 65 ± 6% of the control level at 2 weeks (n = 6, p = 0.0004), to 70 ± 2% of the control level at 3 weeks (n = 6, p = 0.0001), to 59 ± 4% of the control level at 4 weeks (n = 6, p = 0.0001), and to 74 ± 6% of the control level at 6 weeks (n = 6, p = 0.002). As shown in Figure 2, 5-HT1A receptor expression was mostly localized to the GCL, whereas a small amount of expression was observed in the inner nuclear layer (INL) and outer plexiform layer of the control retina section (Fig. 2A). The fluorescence intensity of 5-HT1A receptor expression was very low in the glaucomatous retinal section layers (Fig. 2B). Immunofluorescence analysis revealed weak 5-HT1A receptor staining in the glaucomatous retinas, consistent with the Western blot results. Collectively, these results provide evidence that chronic ocular hypertension downregulates retinal 5-HT1A receptor protein expression in adult rats.
Figure 2.
Micrographs of 10-μm-thick transverse cryostat sections of control and glaucomatous retinas. A, B, Immunolabeling for the 5-HT1A receptor. 5-HT1A receptor puncta are most numerous in the inner IPL and GCL (A3, B3, white rectangular frame). In the INL and OPL, sparsely distributed puncta are visible (A1, A3, yellow frame). In contrast to the control retina (A), the immunofluorescence puncta of the 5-HT1A receptor are significantly reduced in the glaucomatous retina (B). Scale bar, 15 μm. OPL, Outer plexiform layer; ONL, outer nuclear layer.
8-OH-DPAT induced increases in sIPSCs in RGCs
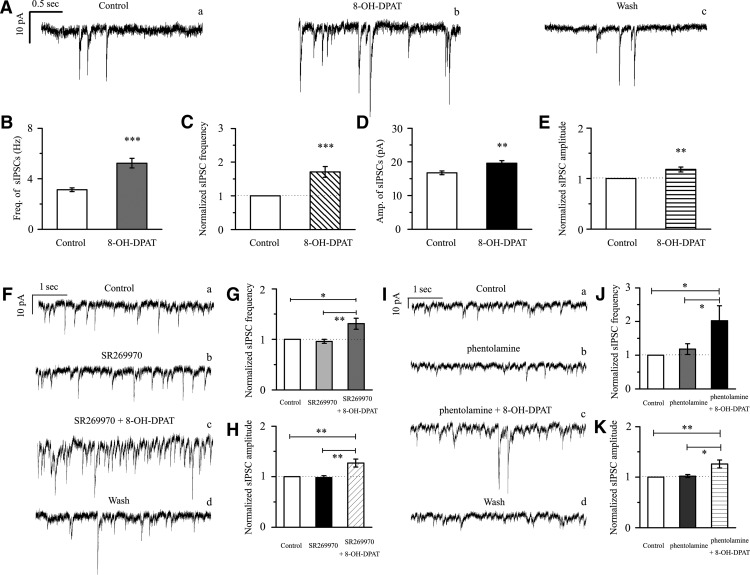
Based on the local GABAergic amacrine neurons projecting onto RGCs, we next assessed the role of 5-HT1A receptors in local GABAergic inputs to RGCs. There are various RGC subtypes in the retina, so we tested the effects of 8-OH-DPAT on local GABAergic inputs to both ON-type (n = 21) and OFF-type RGCs (n = 58). The ON (accounting for 27%) and OFF (accounting for 73%) subtypes of RGCs were identified according to well established morphological and physiological criteria (Famiglietti and Kolb, 1976; Margolis and Detwiler, 2007). Morphologically, ON- and OFF-type RGCs were characterized by their dendrites terminating in the proximal and distal parts of the inner plexiform layer (IPL), respectively (see Fig. 6A,B). There was no significant difference in the GABAergic inhibitory synaptic afferent response to 8-OH-DPAT between the two types of RGCs (p = 0.35). Therefore, data were pooled from both types in our study. At 10 μm, 8-OH-DPAT significantly increased both the frequency and amplitude of sIPSCs in RGCs (Fig. 3A–E). The frequency was increased from 3.13 ± 0.14 Hz to 5.23 ± 0.38 Hz (n = 12, t(11) = −5.34, p = 0.00024, paired t test; Fig. 3B), corresponding to 171 ± 16% of the control level (n = 12, t(11) = −4.58, p = 0.00079, paired t test; Fig. 3C). The amplitude was increased from 16.75 ± 0.57 pA to 19.6 ± 0.79 pA (n = 12, t(11) = −3.20, p = 0.00849, paired t test; Fig. 3D), corresponding to 118 ± 5% of the control level (n = 12, t(11) = −3.43, p = 0.00564, paired t test; Fig. 3E). The 8-OH-DPAT-induced responses started within 5 min and were reversible. At the end of the experiments, the application of SR95531 (10 μm) abolished all of IPSCs.
Figure 6.
RGCs intracellularly injected with Lucifer yellow. A, B, Micrograph in A was taken with an infrared interferometric phase microscope and the retinal layers can be seen. Shown are representative Lucifer yellow-filled OFF-type (A, right) and ON-type (B, right) RGCs that possess dendrite arborizations in the proximal (a) and distal (b) parts of the IPL, respectively. Scale bar, 10 μm. C, D, Bar charts showing that 8-OH-DPAT remarkably enhanced the frequency (C) and the amplitude (D) of GABAergic mIPSCs. Note the significant differences in the frequency but not the amplitude of GABAergic mIPSCs between ON- and OFF-type RGCs. White columns: ON-type RGCs; Gray columns: OFF-type RGCs. ***p < 0.001 for the results of paired t tests between ON- and OFF-type RGCs before and after drug administration. ###p < 0.001 for an independent-samples t test with ON-type RGCs and OFF-type RGCs.
Figure 3.
8-OH-DPAT significantly increases the frequency and amplitude of spontaneous IPSCs in RGCs. A, Representative traces showing the effect of 10 μm 8-OH-DPAT on spontaneous IPSCs. Vertical bar, 10 pA; horizontal bar, 0.5 s. B, D, Summarized data from 12 RGCs showing that 10 μm 8-OH-DPAT significantly increased the average frequency (B, n = 12) and amplitude (D, n = 12) of spontaneous IPSCs. C, E, Normalized sIPSC frequency (C, n = 12) and amplitude (E, n = 12). F, Insets represent typical traces of sIPSCs with an expanded time scale showing that SR269970 could not block the increases in GABAergic sIPSC frequency and amplitude induced by 8-OH-DPAT (a, control; b, SR269970; c, SR269970 + 8-OH-DPAT; d, wash). Vertical bar, 10 pA; horizontal bar, 1 s. G, H, Normalized sIPSC frequency (G, n = 11) and amplitude (H, n = 11). I, Single example recording of sIPSCs in an RGC on an expanded scale during control treatment, phentolamine treatment, phentolamine + 8-OH-DPAT treatment, and drug washout; vertical bar, 10 pA; horizontal bar, 1 s. J, K, Pooled data obtained from 14 cells. In the two graphs, sIPSC frequency and amplitude are expressed as percentages of the control frequency and amplitude. Data are shown as the mean ± SEM. (*p < 0.05, **p < 0.01, ***p < 0.001 vs control conditions or the antagonist group).
8-OH-DPAT was originally thought to be a very selective 5-HT1A receptor agonist (Middlemiss and Fozard, 1983), but subsequently has been shown to have some affinity for the 5-HT7 receptor (Hoyer et al., 1994; Osborne et al., 2000). We next tested whether selective pharmacological blockade of the 5-HT7 receptor would attenuate the effects elicited by 8-OH-DPAT. Administration of SR269970, a selective 5-HT7 receptor antagonist, followed by 8-OH-DPAT still caused a significant increase in frequency and amplitude (Fig. 3F). The effect on sIPSC frequency after drug application was significant (F(2,30) = 8.841, p = 0.001, ANOVA). The effect on sIPSC amplitude after drug application was significant (F(2,30) = 10.042, p = 0.0001, ANOVA). The frequency (3.47 ± 0.27 Hz before vs 4.39 ± 0.31 Hz after 8-OH-DPAT application; n = 11, p = 0.00564) of the sIPSCs corresponded to 131 ± 11% of the control level (n = 11, p = 0.006; Fig. 3G) and the amplitude (16.99 ± 1.14 pA before vs 21.6 ± 2.39 pA after 8-OH-DPAT application; n = 11, p = 0.02317) of the sIPSCs corresponded to 127 ± 8% of the control level (n = 11, p = 0.002; Fig. 3H).
According to many studies, 8-OH-DPAT still exerts its action on the α1- or α2-adrenoceptor. Therefore, we chose a nonselective antagonist of α1- and α2-adrenoceptor, phentolamine, for coadministration with 8-OH-DPAT; however, this antagonist was unable to abolish the effects of 8-OH-DPAT on the frequency and amplitude of sIPSCs (Fig. 3I). The effect on sIPSC frequency and amplitude after drug application was significant (frequency: F(2,39) = 3.873, p = 0.029, ANOVA; amplitude: F(2,39) = 7.853, p = 0.001, ANOVA) The frequency of sIPSCs corresponded to 202 ± 45% of the control level (n = 14, p = 0.038; Fig. 3J) and the amplitude of the sIPSCs corresponded to 126 ± 8% of the control level (n = 14, p = 0.003; Fig. 3K).
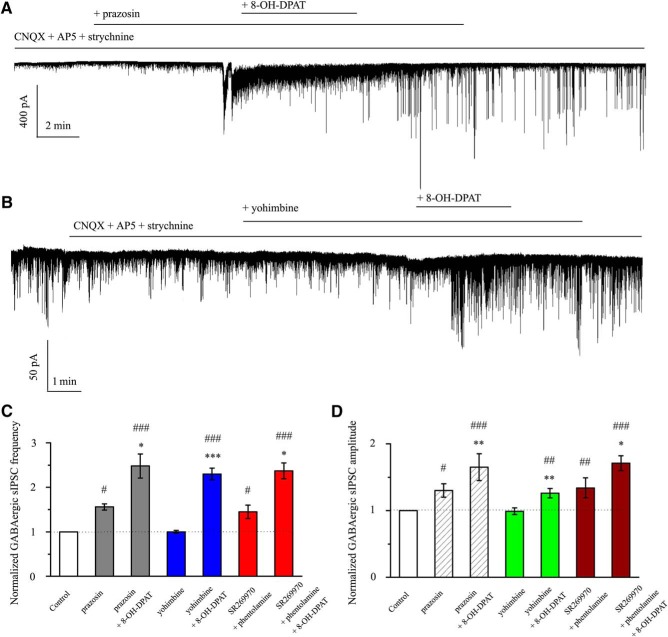
Next, pretreatment with the selective α1-adrenoceptor antagonist prazosin (10 μm) did not inhibit the effects of 8-OH-DPAT on GABAergic sIPSC frequency (F(2,30) = 14.064, p = 0.0001, ANOVA; prazosin: 156 ± 7% of the control level, n = 11, p = 0.021; prazosin + 8-OH-DPAT: 248 ± 27% of the control level, n = 11, p = 0.00018; Fig. 4A,C) or the change in amplitude (F(2,30) = 17.826, p = 0.0002, ANOVA; prazosin: 130 ± 10% of the control level, n = 11, p = 0.038; prazosin + 8-OH-DPAT: 165 ± 20% of the control level, n = 11, p = 0.00035; Fig. 4A,D). Pretreatment with the selective α2-adrenoceptor antagonist yohimbine (10 μm) did not inhibit the effects of 8-OH-DPAT on GABAergic sIPSCs (F(2,31) = 8.476, p = 0.0001, ANOVA; yohimbine + 8-OH-DPAT: 230 ± 13% of the control level, n = 12, p = 0.001; Fig. 4B,C) or the change in amplitude (F(2,31) = 8.471, p = 0.001, ANOVA; yohimbine + 8-OH-DPAT: 126 ± 7% of the control level, n = 12, p = 0.004; Fig. 4B,D). The same result was seen when SR269970 and phentolamine were used together (F(2,27) = 15.050, p = 0.001, ANOVA; frequency: SR269970 + phentolamine: 145 ± 15% of the control level, n = 10, p = 0.037; SR269970 + phentolamine + 8-OH-DPAT: 237 ± 18% of the control level, n = 10, p = 0.00025; Fig. 4D,F(2,27) = 19.537, p = 0.001, ANOVA; amplitude: SR269970 + phentolamine: 134 ± 15% of the control level, n = 10, p = 0.005; SR269970 + phentolamine + 8-OH-DPAT: 171 ± 11% of the control level, n = 10, p = 0.0001; Fig. 4D).
Figure 4.
Effects of 8-OH-DPAT-induced increases in the frequency and amplitude of spontaneous IPSCs in RGCs are not blocked by 5-HT7 receptor or α-adrenoceptors antagonists. A, Typical trace of sIPSCs before and during the application of 8-OH-DPAT (10 μm) in the presence of prazosin (10 μm). Vertical bar, 40 pA; horizontal bar, 2 min. B, Continuous chart recording of sIPSCs before and during 8-OH-DPAT (10 μm) application in the presence of yohimbine (10 μm). Vertical bar, 50 pA; horizontal bar, 1 min. C, D, Summary of sIPSC frequency (C) and amplitude (D) under prazosin, prazosin + 8-OH-DPAT, yohimbine, yohimbine + 8-OH-DPAT, SR269970 + phentolamine, and SR269970 + phentolamine + 8-OH-DPAT action relative to control (*p < 0.05, **p < 0.01 and ***p < 0.001 vs each antagonist group. #p < 0.05, ##p < 0.01 and ###p < 0.001 vs control).
8-OH-DPAT-induced changes in the frequency and amplitude of sIPSCs in RGCs were blocked by WAY-100635
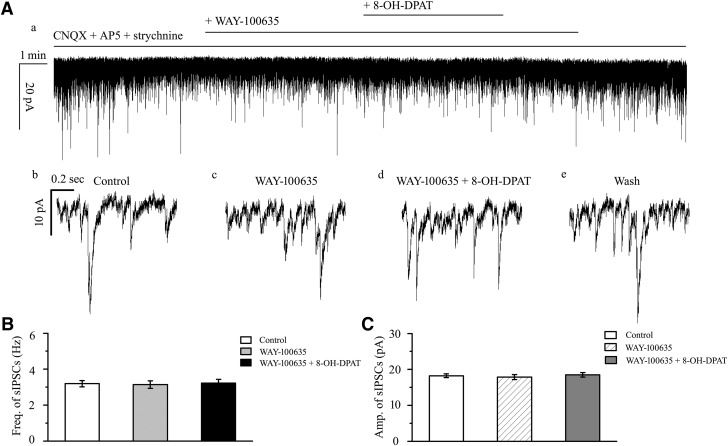
WAY-100635 alone did not significantly alter the baseline frequency or amplitude of sIPSCs. After preincubation with WAY-100635 (10 μm), the addition of 10 μm 8-OH-DPAT did not significantly alter sIPSCs (Fig. 5A); the frequency (F(2,30) = 0.041, p = 0.960, ANOVA; 3.19 ± 0.18 Hz before vs 3.22 ± 0.21 Hz after 8-OH-DPAT application; n = 11, p = 1.000; Fig. 5B) of the sIPSCs corresponded to 101 ± 4% of the control level (F(2,30) = 0.124, p = 0.883, ANOVA; n = 11, p = 1.000) and the amplitude (F(2,30) = 0.261, p = 0.772, ANOVA; 18.23 ± 0.53 pA before vs 18.48 ± 0.61 pA after 8-OH-DPAT application; n = 11, p = 1.000; Fig. 5C) of the sIPSCs corresponded to 101 ± 2% of the control level (F(2,30) = 0.960, p = 0.394, ANOVA; n = 11, p = 1.000). At the end of the experiments, 10 μm SR95531 abolished all sIPSCs.
Figure 5.
Effects of 8-OH-DPAT-induced increases in the frequency and amplitude of spontaneous IPSCs in RGCs are blocked by WAY-100635. A, Recordings in a representative experiment. The top trace (a) is a recording of an RGC after preincubation with CNQX + AP5 showing that WAY-100635 prevented alterations of the frequency and amplitude of the spontaneous IPSCs induced by 8-OH-DPAT. Vertical bar, 20 pA; horizontal bar, 1 min. The bottom traces (b–e) show the recording of the RGC on an expanded time scale. b, Control condition; c, during WAY-100635 treatment application; d, during WAY-100635 + 8-OH-DPAT treatment application; and e, recovery. Vertical bar, 10 pA; horizontal bar, 0.2 s. B, C, Summarized data on the frequency (B) and amplitude (C) of spontaneous IPSCs (n = 11).
Chronic glaucoma decreases the GABAergic mIPSC frequency and these effects are improved by 8-OH-DPAT
The above results showed that 8-OH-DPAT increased the local GABAergic inhibitory inputs to RGCs. However, whether this effect depended on the action potential remained unknown. The release of neurotransmitters at the synapse terminal can be directly regulated, allowing mIPSCs to be tracked. Interestingly, we first compared the frequency and amplitude of mIPSCs in ON- and OFF-type RGCs and found significant differences in the frequency but not the amplitude [(Fig. 6A–D, frequency: 0.9 ± 0.16 Hz for ON-type RGCs (n = 76) and 2.9 ± 0.69 Hz for OFF-type RGCs (n = 130), t(204) = −5.20, p = 0.0001, independent t test; amplitude: 16.21 ± 1.24 pA for ON-type RGCs (n = 76) and 16.13 ± 1.01 pA for OFF-type RGCs (n = 130), t(204) = 0.22927, p = 0.81889, independent t test]. However, regardless of the type, RGCs reacted significantly to 8-OH-DPAT. The average values of the GABAergic mIPSC frequency after the application of 8-OH-DPAT were 1.66 ± 0.16 Hz (n = 76, t(75) = −10.55, p = 0.0001, paired t test) in ON-type RGCs and 4.59 ± 0.79 Hz (n = 130, t(129) = −6.93, p = 0.0001, paired t test) in OFF-type RGCs. Additionally, the average values of the GABAergic mIPSC amplitude after the application of 8-OH-DPAT were 20.06 ± 1.59 pA (n = 76, t(75) = −8.52, p = 0.0001, paired t test) in ON-type RGCs and 17.74 ± 1.14 pA (n = 130, t(129) = −6.75, p = 0.0001, paired t test) in OFF-type RGCs. There was no significant difference in the responses of these two types of RGCs to 8-OH-DPAT (p = 0.82592). Therefore, this study collected data for both types.
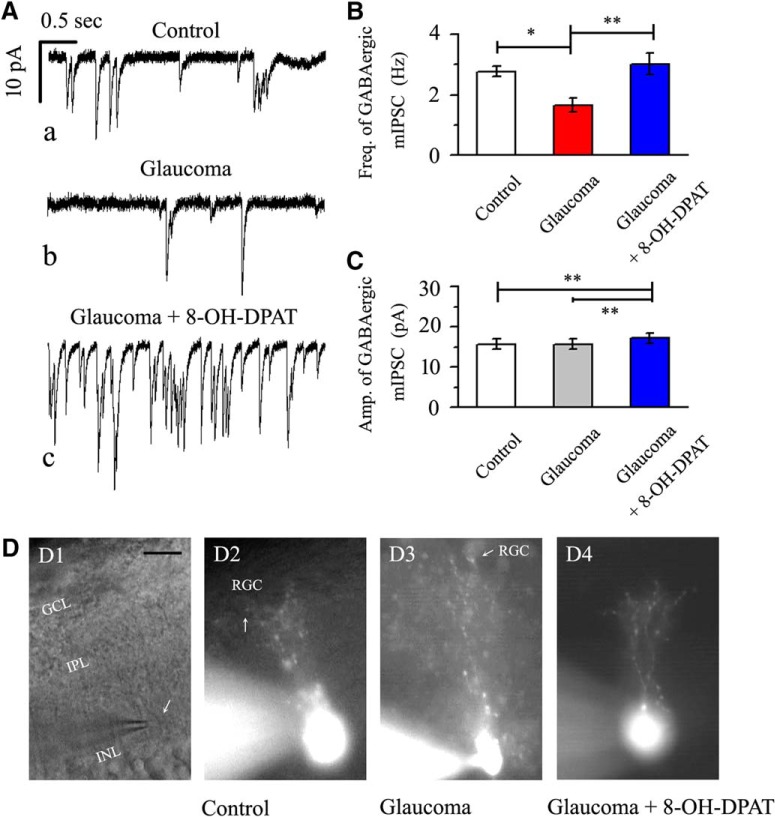
The traces of GABAergic mIPSCs from RGCs in control, glaucomatous, and 8-OH-DPAT-treated retinal slices are shown in Figure 7A. Consistent with our previous results (Zhou et al., 2017b), patch-clamp recordings revealed differences in the baseline frequencies of the GABAergic mIPSCs in RGCs between the control and glaucomatous retinal slices. The effect of the three groups on mIPSC frequency was significant (F(2,30) = 7.601, p = 0.002, ANOVA). The mIPSC frequency was 2.77 ± 0.17 Hz in control RGCs and 1.66 ± 0.23 Hz in glaucomatous RGCs (n = 11, p = 0.016) and 8-OH-DPAT significantly increased the frequency of mIPSCs (3.02 ± 0.35 Hz) relative to that in glaucomatous RGCs (n = 11, p = 0.003; Fig. 7B). The mean mIPSC amplitudes of the control and glaucomatous RGCs were not significantly different (15.67 ± 1.22 pA in control RGCs vs 15.68 ± 1.24 pA in glaucomatous RGCs; n = 11, p = 0.35768; Fig. 7C). However, 8-OH-DPAT continued to increase the amplitude of glaucomatous RGCs (15.68 ± 1.24 pA in glaucomatous RGCs vs 17.12 ± 1.28 pA in 8-OH-DPAT-treated RGCs; n = 6, p = 0.0028; Fig. 7C).
Figure 7.
Effects of chronic glaucoma and 8-OH-DPAT on the frequency/amplitude of mIPSCs and the synaptic connections between RGCs and amacrine cells. A, Representative traces of whole-cell voltage-clamp recordings of GABAergic mIPSCs in the presence of TTX (1 μm) in control, glaucoma, and glaucoma + 8-OH-DPAT retinas. Vertical bar, 10 pA; horizontal bar, 0.5 s. The baseline mIPSC frequency is significantly reduced in the glaucomatous retina relative to that in the control and 8-OH-DPAT can reverse the decrease in mIPSCs in the pathological state. B, C, Histograms showing the mean frequency and amplitude of mIPSCs in control, glaucoma, and glaucoma + 8-OH-DPAT retinas. The mIPSC frequency differed significantly between the control and glaucomatous retinas and glaucoma-induced changes were promoted by 8-OH-DPAT. The mIPSC amplitude was significantly changed before and after preincubation of the glaucomatous slice with 8-OH-DPAT (*p < 0.05 and **p < 0.01, one-way ANOVA). D, Micrograph in D1 was taken with an infrared interferometric phase microscope and the retinal layers can be seen. D2–D4, Using a fluorescence microscope, the cell morphology becomes apparent: dendritic arborizations are found in the IPL. The amacrine cell body is pear shaped (arrow) and mainly distributed in the INL/IPL border. Morphologically, the synaptic connections between RGCs and amacrine cells were not dissociated due to glaucoma (D2, D3) and pretreatment with 8-OH-DPAT did not increase the number of synapses (D4). Scale bar, 10 μm.
Intracellular injection and immunofluorescent staining of amacrine cells
Next, we determined why the kinetics of mIPSCs in RGCs were altered in glaucomatous retinas. We first speculated that the synapse between RGCs and amacrine cells loses part of its connection. Previous studies have illustrated reciprocal connections between inhibitory transmission and the dendritic morphology of RGCs (Trong and Rieke, 2008). To study the dendritic morphology of amacrine cells in the rat retina, intracellular injection of individual cells with Lucifer yellow was performed in vertical slices. Figure 7D shows amacrine cells injected in control (n = 23, 10 slices), glaucoma (n = 19, 9 slices), and 8-OH-DPAT-pretreatment glaucoma (n = 17, 9 slices) retinal slices. The combined phase contrast and fluorescence micrograph in Figure 7D shows the position of the pear-shaped cell body at the INL/IPL border and the stout primary dendrite. In the inner two-thirds of the IPL, the primary dendrite branches repeatedly form a conical arborization. However, under our conditions, we did not observe a physiological synaptic link between RGCs and amacrine cells that was overridden by glaucoma. Similarly, morphologically, pretreatment with 8-OH-DPAT did not increase the number of synapses.
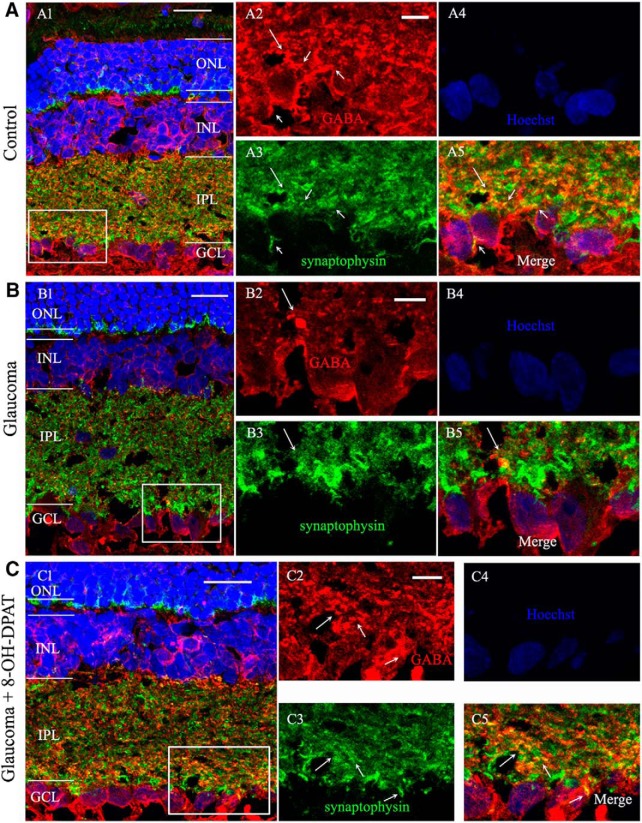
Next, we considered whether the electrophysiological characteristics of the cells were associated with changes in the GABAergic system. Using immunofluorescence, strong labeling was found in the INL, IPL, and GCL when vertical sections of rat retina were stained for GABA immunoreactivity (Fig. 8A,C). Consistent with the observed changes in our previous experimental study (Zhou et al., 2017b), GABA immunoreactivity was also significantly reduced in glaucomatous retinas (Fig. 8B). The immunofluorescence results showed that administration of 8-OH-DPAT increased GABA expression levels in the retina (Fig. 8C). GABA-positive signals (red) were colocalized with those for synaptophysin (green) at the synaptic terminals between RGCs and amacrine cells (yellow) (Fig. 8A5,B5,C5, arrows). The fluorescence intensity of synaptophysin did not change significantly among the three groups.
Figure 8.
8-OH-DPAT prevents reductions in GABA immunoreactivity caused by chronic ocular hypertension. A–C, Micrographs of 10-μm-thick transverse sections of retinas from control, glaucomatous, and 8-OH-DPAT-treated glaucomatous retinas. Shown is a confocal microphotograph of a vertical section of the rat control retina, triple stained with antibodies against GABA (red), synaptophysin (green) and Hoechst (blue) revealing that GABA is mainly expressed at the INL, IPL, and GCL. Scale bar, 20 μm. A2–A5, Enlarged images taken from the square in A1. Scale bar, 5 μm. A2, GABA-labeled image; A3, synaptophysin-labeled image; A4, Hoechst image; and A5, merged image of A2–A4. Note that the GABA-positive signal is colocalized with the signal for synaptophysin (arrows). B, Triple immunofluorescence-labeled microphotograph showing that GABA but not synaptophysin immunohistochemistry is decreased in the glaucomatous retina (arrows). B2–B5, Enlarged images taken from the square in B1. Scale bar, 5 μm. C, 8-OH-DPAT prevents the effects of ocular hypertension on GABA expression. C2–C5, Enlarged images taken from the square in C1. Scale bar, 5 μm. Note that the fluorescence intensity of synaptophysin did not change significantly among three groups. ONL, Outer nuclear layer.
Activation of the 5-HT1A receptor promotes RGC survival
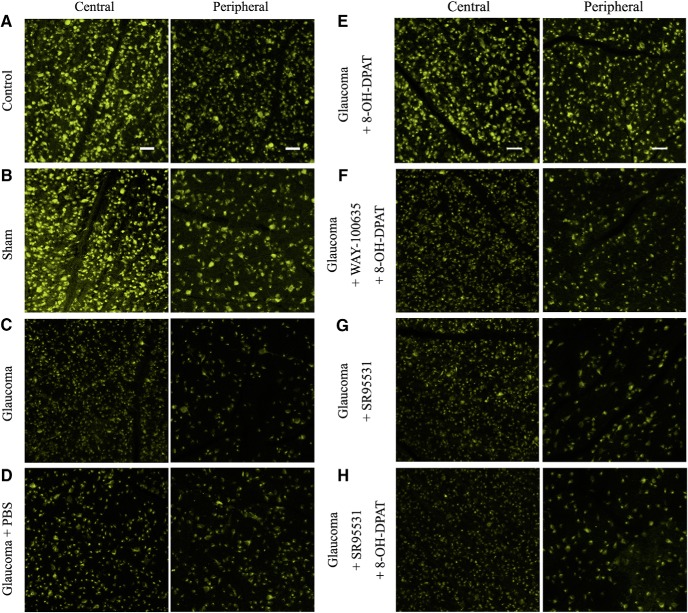
To determine whether upregulated 5-HT1A receptor activity promotes RGC survival, we counted the number of FluoroGold-labeled RGCs in flat-mounted retinas. PBS, 8-OH-DPAT, WAY100635 + 8-OH-DPAT, SR95531, or SR95531 + 8-OH-DPAT was injected intravitreally at 0, 1, 2, and 3 weeks after ocular hypertension and RGC survival was evaluated 1 week after the fourth dose. Representative 20× magnified images obtained 4 weeks after the induction of ocular hypertension are shown in Figure 9, A–H. The RGC densities were assessed in two regions: a central region 1 mm from the optic disk and a peripheral region 3 mm from the optic disk (Fig. 10A). As shown in Figure 10, B and C, the effects of the eight groups on the mean densities of surviving RGCs in the central and peripheral regions were significant [central F(7,40) = 22.788, p = 0.0001, ANOVA; peripheral F(7,40) = 40.317, p = 0.0001, ANOVA; mean densities of RGCs in the central and peripheral regions were 4568 ± 70 cells/mm2 and 3018 ± 137 cells/mm2 in control eyes vs 3511 ± 81 cells/mm2 (n = 6, p = 0.00029) and 1962 ± 107 cells/mm2 (n = 6, p = 0.00034) in ocular hypertension eyes, respectively]. The density of FluoroGold-positive RGCs was significantly greater in glaucomatous eyes treated with 8-OH-DPAT than in those treated with or without PBS. In glaucomatous eyes, 8-OH-DPAT markedly increased RGC survival because the RGC densities in the central and peripheral regions were 4484 ± 131 cells/mm2 and 2816 ± 83 cells/mm2 in glaucoma + 8-OH-DPAT eyes compared with 3463 ± 155 cells/mm2 (n = 6, p = 0.00029; Fig. 10B) and 1804 ± 76 cells/mm2 (n = 6, p = 0.00034; Fig. 10C) in glaucoma + PBS eyes, respectively. These data indicate that the activation of 8-OH-DPAT significantly enhanced the survival of RGCs in glaucomatous eyes.
Figure 9.
FluoroGold labeling of RGCs in normal, glaucomatous, and drug-treated retinas. A–D, FluoroGold labeling images of surviving RGCs in flat-mounted retinas 4 weeks after high IOP are shown in the central and peripheral panels, which were photographed at low magnification (20×). Fluorescence micrographs of flat-mounted retinas depicting FluoroGold-labeled RGCs in normal (A), sham (B), glaucoma (C), and glaucomatous + PBS (D) eyes. E–H, FluoroGold-labeled images of surviving RGCs in flat-mounted retinas 4 weeks after high IOP are shown in the central and peripheral panels. E, 8-OH-DPAT increased RGC viability and preserved cellular integrity. F, G, Administration of WAY-100635 (F) or SR95531 (G) blocked the effects of 8-OH-DPAT on RGC viability. G, SR95531 alone did not affect the survival of RGCs. Scale bar, 50 μm.
8-OH-DPAT is a potent agonist of 5-HT1A and a partial agonist of 5-HT7 receptors (Osborne et al., 2000). Next, we tested which of the specific receptor subtypes function; glaucomatous eyes were injected intravitreally with a special 5-HT1A receptor antagonist, WAY100635, followed by 8-OH-DPAT. As illustrated in Figures 9, E and F, and 10B and C, the density of RGCs in the WAY100635 + 8-OH-DPAT-treated glaucomatous eyes was similar to that in PBS-treated glaucomatous eyes in the central (3414 ± 131 vs 3463 ± 155 cells/mm2, n = 6, p = 1.000) and peripheral (1600 ± 116 vs 1804 ± 76 cells/mm2, n = 6, p = 1.000) regions, suggesting that 8-OH-DPAT functions specifically with the 5-HT1A receptor.
To further confirm that 8-OH-DPAT exerts its effects via the GABA system, glaucomatous eyes were intravitreally injected sequentially with a GABAA receptor blocker, SR95531, followed by 8-OH-DPAT. Pretreatment with SR95531 prevented the effects of 8-OH-DPAT on RGC survival, resulting in densities of 3529 ± 127 cells/mm2 in the central region (n = 6, p = 0.0001 vs control; Fig. 10B) and 1763 ± 59 cells/mm2 in the peripheral region (n = 6, p = 0.0001 vs control; Fig. 10C). WAY100635 and SR95531 do not exacerbate the effects of ocular hypertension.
8-OH-DPAT increases the frequency and amplitude of GABAergic mIPSCs in RGCs
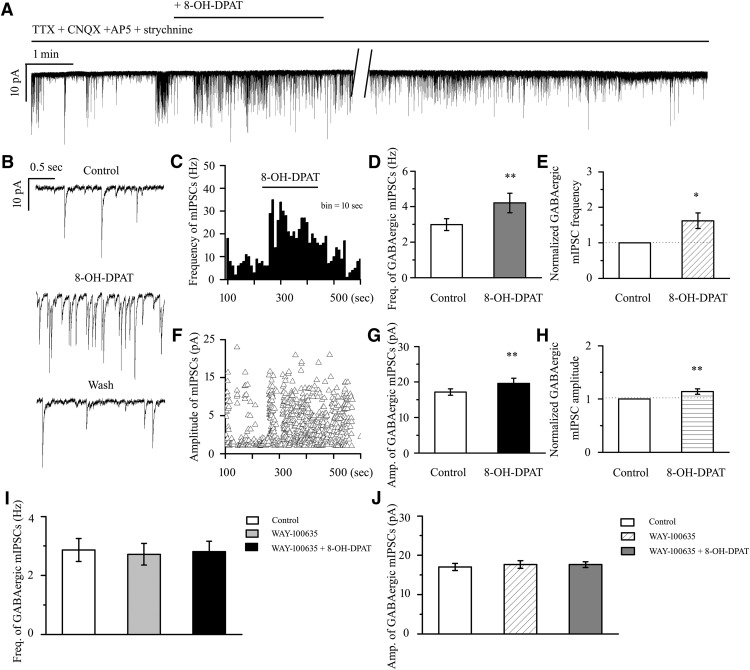
We further investigated the synaptic mechanism underlying the neuroprotective effects of 8-OH-DPAT. 8-OH-DPAT (10 μm) significantly increased the frequency and amplitude of the GABAergic mIPSCs in RGCs after preincubation with 1 μm TTX, 10 μm CNQX, 50 μm AP5, and 5 μm strychnine (Fig. 11A,B). The frequency histogram (Fig. 11C) and running amplitude (Fig. 11F) of GABAergic mIPSCs in a representative RGC are shown in Figure 11, demonstrating the time courses of the frequency and amplitude responses to 8-OH-DPAT application. The frequency of the GABAergic mIPSCs increased from 2.99 ± 0.33 to 4.21 ± 0.55 Hz (n = 14, t(13) = −3.04, p = 0.0094, paired t test; Fig. 11D), equivalent to 162 ± 22% of the control level (n = 14, t(13) = −2.82, p = 0.01455, paired t test; Fig. 11E). The amplitude of the GABAergic mIPSCs increased from 17.15 ± 0.89 to 19.62 ± 1.44 pA (n = 14, t(13) = −3.02, p = 0.00990, paired t test; Fig. 11G), equivalent to 114 ± 5% of the control level (n = 14, t(13) = −3.02, p = 0.00978, paired t test; Fig. 11H). The 8-OH-DPAT-induced responses began within 4–5 min after drug application and were reversible by washout of 8-OH-DPAT. The effects of 8-OH-DPAT on the frequency and amplitude of GABAergic mIPSCs were blocked by a highly selective 5-HT1A receptor antagonist, WAY-100635 (Fig. 11I,J). WAY-100635 alone did not markedly affect the baseline frequency or amplitude of the GABAergic mIPSCs (Fig. 11I,J). At the end of the experiments, application of the selective GABAA receptor antagonist SR95531 (10 μm) abolished all mIPSCs.
Figure 11.
8-OH-DPAT increases the frequency and amplitude of GABAergic mIPSCs in control rat RGCs. A, Whole-cell voltage-clamp recording (at −70 mV) of a representative RGC shows that 8-OH-DPAT increases the frequency and amplitude of GABAergic mIPSCs in RGCs. Vertical bar, 10 pA; horizontal bar, 1 min. B, Recordings of the RGC on an expanded scale during control treatment, 8-OH-DPAT treatment and drug washout. Vertical bar, 10 pA; horizontal bar, 0.5 s. C, F, Frequency (bin = 10 s) (C) and amplitude (F) histograms of the GABAergic mIPSCs of the trace in shown in A revealing the effects of 8-OH-DPAT. D, G, Quantification of the frequency (D) and amplitude (G) of mIPSCs (n = 14). E, H, Quantification of the frequency (E) and amplitude (H) of mIPSCs normalized to the control before and during 8-OH-DPAT application. I, J, Preincubation with WAY-100635, a selective 5-HT1A receptor antagonist, inhibits the effects of 8-OH-DPAT on the frequency (I) and amplitude (J) of GABAergic mIPSCs (n = 12). Administration of WAY-100635 alone does not affect the baseline frequency (I) or amplitude (J) of GABAergic mIPSCs (*p < 0.05, **p < 0.01, Student's paired t test).
8-OH-DPAT-induced changes were not blocked by 5-HT7 receptor and α-adrenoceptor antagonists
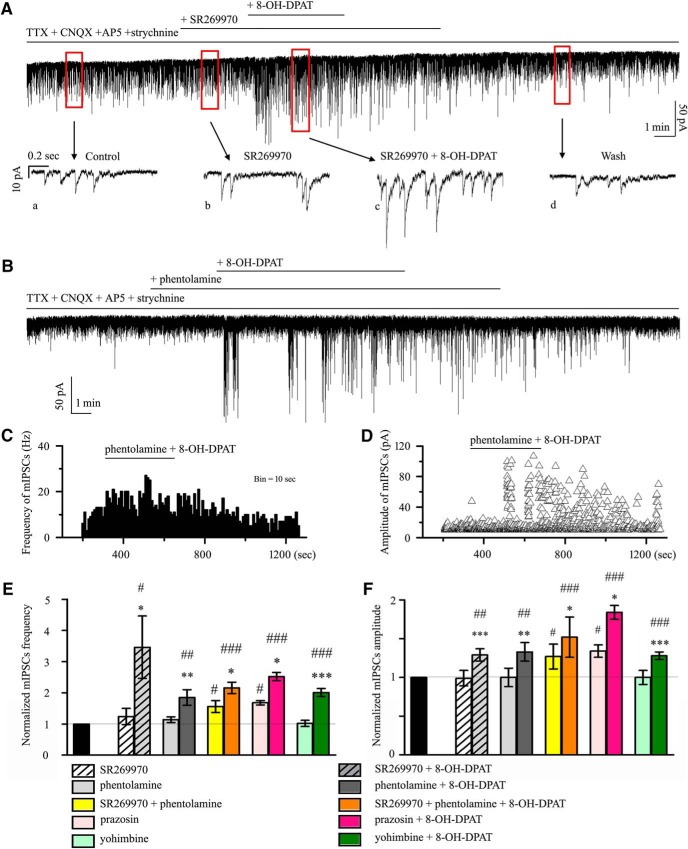
As shown in Figure 12A, application of the 5-HT7 receptor antagonist SR269970 (10 μm) could not block the increase in 8-OH-DPAT-mediataed GABAergic neurotransmission to RGCs. The normalized frequencies before and after applying 8-OH-DPAT were 124 ± 26% and 346 ± 10% of the control level, respectively (n = 12, F(2,33) = 5.128, p = 0.011, ANOVA) and the normalized amplitudes before and after applying 8-OH-DPAT were 99 ± 2% and 129 ± 8% of the control level, respectively (n = 12, F(2,33) = 13.587, p = 0.0001, ANOVA) (Fig. 12E,F). SR269970 had no significant effect on the baseline frequency and amplitude (Fig. 11A,E,F). These results suggest that 8-OH-DPAT does not act by facilitating 5-HT7 receptor-mediated inhibitory neurotransmission to RGCs.
Figure 12.
5-HT7 receptor or α-adrenoceptor antagonists did not block the effects of 8-OH-DPAT at the synaptic level. A, SR269970 failed to block the incremental effects of 8-OH-DPAT on mIPSC frequency and amplitude. Vertical bar, 50 pA; horizontal bar, 1 min. Sample traces show the effects of 10 μm SR269970 applied alone (b) or along with 10 μm 8-OH-DPAT (c) and drug washout (d) on GABAAR-mediated mIPSCs. SR269970 itself did not affect baseline mIPSC amplitude or frequency. Vertical bar, 10 pA; horizontal bar, 0.2 s. B, mIPSCs before and during the application of 8-OH-DPAT (10 μm) in the presence of phentolamine (10 μm). Note that adding 8-OH-DPAT in the presence of phentolamine dramatically increased mIPSC frequency and amplitude. Vertical bar, 50 pA; horizontal bar, 1 min. C, Time–frequency histograms from an RGC tested with 8-OH-DPAT (10 μm) in the presence of phentolamine. D, Time–amplitude histograms from an RGC tested with 8-OH-DPAT (10 μm) in the presence of phentolamine. E, F, Mean percentage control of mIPSC frequency (E) and amplitude (F) obtained during SR269970 (n = 12), phentolamine (n = 10), SR269970 + phentolamine (n = 14), prazosin (n = 12), and yohimbine (n = 12) application with (right side of each group) or without (left side of each group) 8-OH-DPAT. Note that the application of SR95531 + phentolamine and prazosin alone increased the normalized frequency and amplitude of mIPSCs (*p < 0.05, **p < 0.01 and ***p < 0.001 vs each antagonist group. #p < 0.05, ##p < 0.01 and ###p < 0.001 vs control).
Similar to the effects of SR269970, phentolamine (10 μm), a nonselective α-adrenoceptor antagonist, also did not modify the effects of 8-OH-DPAT (Fig. 12B). The frequency histogram (Fig. 12C) and running amplitude (Fig. 12D) of GABAergic mIPSCs in a representative RGC are shown in Figure 12, demonstrating the time courses of the frequency and amplitude responses to phentolamine + 8-OH-DPAT application. Addition of phentolamine + 8-OH-DPAT to the ACSF resulted in an increase in the mean frequency of mIPSCs to 114 ± 9% of the control treatment (F(2,27) = 8.729, p = 0.001, ANOVA, n = 10, p = 0.002 vs control; Fig. 12E) and an increase in the mean amplitude of mIPSCs to 133 ± 12% of the control treatment (F(2,27) = 7.848, p = 0.002, ANOVA, n = 10, p = 0.006 vs control; Fig. 12F); phentolamine had no effect on the baseline currents.
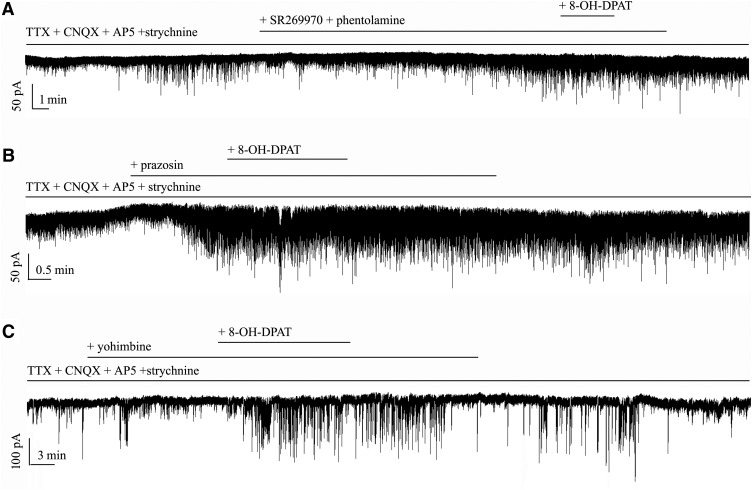
Next, the 5-HT7 receptor antagonist SR269970 and the α-adrenergic receptor antagonist phentolamine were together included in the perfusate and then 8-OH-DPAT was added; this treatment also evoked significant increases in the frequency (F(2,39) = 23.285, p = 0.0001, ANOVA, 216 ± 18% of control; p = 0.0001 vs control, n = 14) and amplitude (F(2,39) = 22.422, p = 0.0001, ANOVA, 152 ± 26% of control; p = 0.0001 vs control, n = 14) of GABAergic inhibitory neurotransmission to RGCs and SR269970 + phentolamine significantly altered either the GABAergic mIPSC baseline frequency (156 ± 19% of control; p = 0.032 vs control, n = 14) or baseline amplitude (127 ± 16% of control; p = 0.006 vs control, n = 14) (Figs. 12E,F, 13A).
Figure 13.
Effects of 8-OH-DPAT-induced increases on the frequency and amplitude of mIPSCs in RGCs are not blocked by SR269970 + phentolamine, prazosin or yohimbine. A, Typical trace of mIPSCs before and during the application of 8-OH-DPAT (10 μm) in the presence of SR269970 + phentolamine. Vertical bar, 50 pA; horizontal bar, 1 min. B, Typical trace of mIPSCs before and during the application of 8-OH-DPAT (10 μm) in the presence of prazosin (10 μm). Vertical bar, 50 pA; horizontal bar, 0.5 min. C, Continuous chart recording of mIPSCs before and during 8-OH-DPAT (10 μm) application in the presence of yohimbine (10 μm). Vertical bar, 100 pA; horizontal bar, 3 min.
We next examined the possibility of a direct effect of a specific α1-adrenoceptor antagonist, prazosin, on GABAergic synaptic transmission. As shown in Figures 12, E and F, and 13B, the F-value of frequency (F(2,33) = 19.135, p = 0.0001, ANOVA) and of amplitude (F(2,33) = 16.560, p = 0.0001, ANOVA) showed that prazosin induced a robust increase in mIPSC frequency (168 ± 7%; p = 0.012 vs control, n = 12) and amplitude (134 ± 8%; p = 0.039 vs control, n = 12). In the presence of prazosin, the mIPSC frequency was 252 ± 13% (p = 0.00012 vs control, n = 12) and the amplitude was 184 ± 9% (p = 0.0004 vs control, n = 12) with 8-OH-DPAT.
Finally, we examined the effect of the selective α2-adrenoceptor antagonist yohimbine. In 12 cells, 10 μm yohimbine + 10 μm 8-OH-DPAT increased mIPSC occurrence and, on average, enhanced the mIPSC frequency to 201 ± 13% of the control treatment (F(2,33) = 56.990, p = 0.00001, ANOVA) and amplitude to 128 ± 5% of the control treatment (F(2,33) = 23.105, p = 0.0001, ANOVA; Figs. 12E,F, 13C). These results suggest that, in addition to 5-HT1A receptors, the other receptor-like effects of 8-OH-DPAT do not block its regulation of GABAergic mIPSCs.
8-OH-DPAT-induced changes at the synaptic level were dependent on the inhibition of PKA signaling
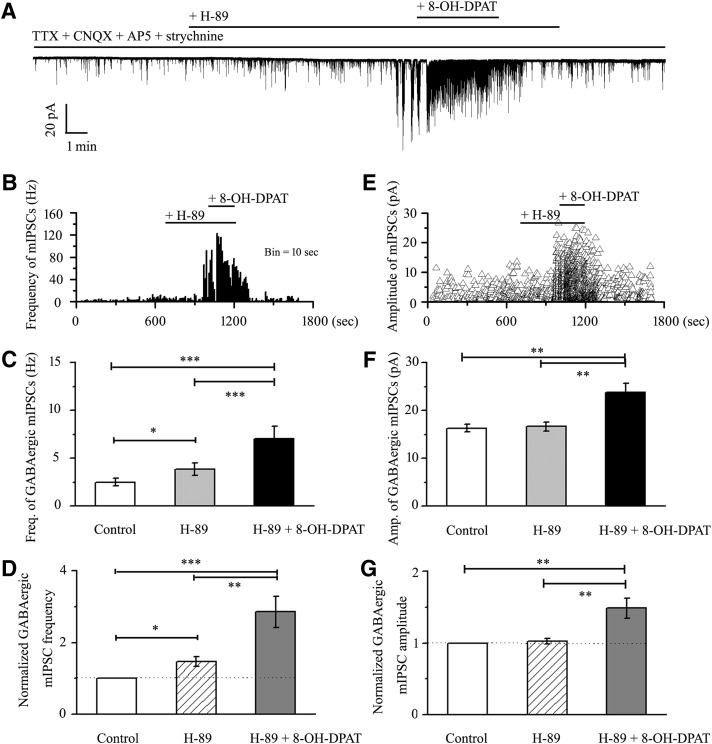
5-HT1A receptors have pertussis toxin-sensitive Gαi/o proteins, which are negatively coupled with the adenylyl cyclase signaling pathway and thereby decrease cAMP formation (Wang et al., 2002). Whether cAMP-PKA pathways contribute to the effect of 8-OH-DPAT on the GABAergic mIPSCs in RGCs was explored using the selective cAMP-PKA pathway inhibitor H-89 and the activator bucladesine. A similar increased frequency of GABAergic mIPSCs was observed in the retinal slices pretreated with the cAMP-PKA inhibitor H-89, whereas 8-OH-DPAT still significantly further increased the frequency and amplitude of GABAergic mIPSCs (Fig. 14A). A frequency histogram (Fig. 14B) and the running amplitude (Fig. 14E) of GABAergic mIPSCs in a representative RGC are shown in Figure 14, demonstrating the time courses of the frequency and amplitude responses to H-89 and 8-OH-DPAT applications. The frequency of GABAergic mIPSCs was 2.51 ± 0.4 Hz before H-89 application and increased to 3.84 ± 0.66 Hz in the presence of H-89 (F(2,27) = 35.414, p = 0.0001, ANOVA; n = 10, p = 0.014 vs control; Fig. 14C), representing 147 ± 14% of the control level (F(2,27) = 21.114, p = 0.0001, ANOVA; n = 10, p = 0.014 vs control; Fig. 14D). In cells preincubated with H-89, the addition of 8-OH-DPAT further elicited significant changes in the frequency of GABAergic mIPSCs (H-89 vs H-89 + 8-OH-DPAT: 3.84 ± 0.66 Hz vs 7.04 ± 1.29 Hz; n = 10, p = 0.0001; Fig. 14C), representing an increase to 286 ± 43% of the control level (n = 10, p = 0.006 vs control; Fig. 14D). The amplitude of the GABAergic mIPSCs did not change, with a value of 16.32 ± 0.81 pA before H-89 application and 16.68 ± 0.93 pA during H-89 application (F(2,27) = 10.672, p = 0.0001, ANOVA; n = 10, p = 1.000 vs control; Fig. 14F). In cells preincubated with H-89, the addition of 8-OH-DPAT further elicited significant changes in the amplitude of GABAergic mIPSCs (H-89 vs H-89 + 8-OH-DPAT: 16.68 ± 0.93 pA vs 23.86 ± 1.89 pA; n = 10, p = 0.002; Fig. 14F), representing an increase to 149 ± 14% of the control level (F(2,27) = 11.260, p = 0.0001, ANOVA; n = 10, p = 0.001 vs control; Fig. 14G). These responses occurred within 4–5 min and were reversible by the washout of H-89 + 8-OH-DPAT. At the end of the experiments, 10 μm SR95531 abolished all GABAergic mIPSCs in the RGCs. These results indicate that the 8-OH-DPAT-induced GABA release may be enhanced by the cAMP-PKA inhibitor.
Figure 14.
Effects of 8-OH-DPAT on the frequency and amplitude of GABAergic mIPSCs in RGCs are enhanced by H-89. A, Continuous trace of a representative experiment showing mIPSCs during TTX + CNQX + AP5 + strychnine application, during H-89 application, during H-89 + 8-OH-DPAT application, and during recovery. Vertical bar, 20 pA; horizontal bar, 1 min. B, E, Frequency (10 s bin) and amplitude histograms of the mIPSCs of the trace shown in A demonstrating the effects of H-89 and H-89 + 8-OH-DPAT. C, F, Quantification of the frequency (C, n = 10) and amplitude (F, n = 10) of GABAergic mIPSCs. D, G, Normalized GABAergic mIPSC frequency (D, n = 10) and amplitude (G, n = 10). Pretreatment with H-89 increased the baseline frequency but did not affect the baseline amplitude of mIPSCs (*p < 0.05, **p < 0.01 and ***p < 0.001, one-way ANOVA).
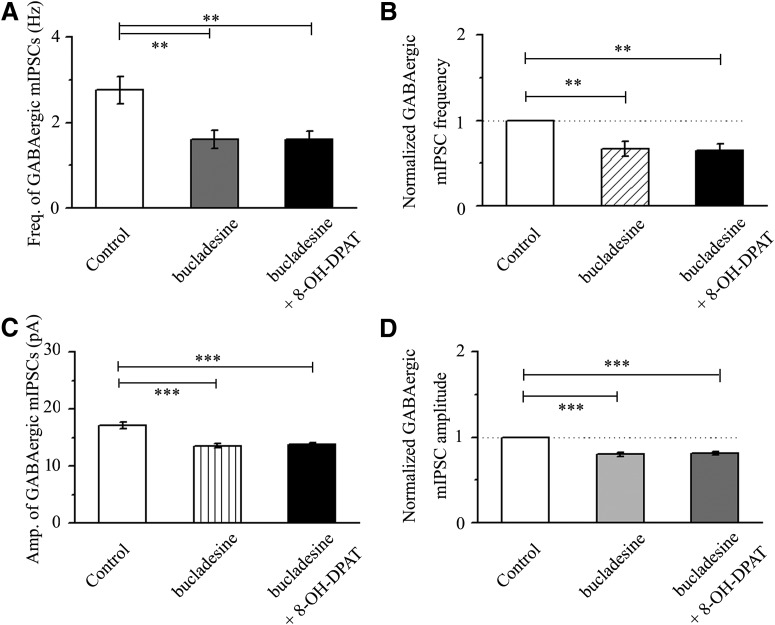
Next, the effects of 8-OH-DPAT on the frequency and amplitude of GABAergic mIPSCs were blocked by a highly selective cAMP-PKA activator, bucladesine (Fig. 15A–D). The effect of the three groups on the absolute value of mIPSC frequency was significant (F(2,30) = 7.123, p = 0.003, ANOVA) and the effect of the three groups on the relative values of mIPSC frequency was significant (F(2,30) = 8.118, p = 0.002, ANOVA). However, bucladesine alone significantly decreased the baseline frequency and amplitude of GABAergic mIPSCs (Fig. 15A–D). The mean frequencies of GABAergic mIPSCs in the control and bucladesine-treated slices were 2.76 ± 0.32 Hz and 1.61 ± 0.22 Hz (n = 11, p = 0.008; Fig. 15A), respectively, and decreased to 67 ± 9% of the control level (n = 11, p = 0.006; Fig. 15B). The effect of the three groups on the absolute value of mIPSC amplitude was significant (F(2,30) = 18.844, p = 0.0001, ANOVA). The effect of the three groups on the relative value of mIPSC amplitude was significant (F(2,30) = 37.051, p = 0.0002, ANOVA). The mean amplitudes of GABAergic mIPSCs in the control and bucladesine-treated slices were 17.14 ± 0.63 pA and 13.58 ± 0.35 pA (n = 11, p = 0.0001; Fig. 15C), respectively, and decreased to 80 ± 2% of the control level (n = 11, p = 0.0001; Fig. 15D). After preincubation with bucladesine (10 μm), the addition of 10 μm 8-OH-DPAT did not significantly alter the absolute or relative values of the frequency and amplitude of mIPSCs (n = 11, p = 1.000).
Figure 15.
Effects of 8-OH-DPAT on the frequency and amplitude of GABAergic mIPSCs in RGCs are blocked by bucladesine. A, C, Quantification of the frequency (A, n = 11) and amplitude (C, n = 11) of GABAergic mIPSCs. B, D, Normalized GABAergic mIPSC frequency (B, n = 11) and amplitude (D, n = 11). Pretreatment with bucladesine markedly decreased the baseline frequency and amplitude of mIPSCs. 8-OH-DPAT-induced effects were prevented by bucladesine (**p < 0.01 and ***p < 0.001, one-way ANOVA).
8-OH-DPAT-induced changes were dependent on the reduction in PKA phosphorylation modification
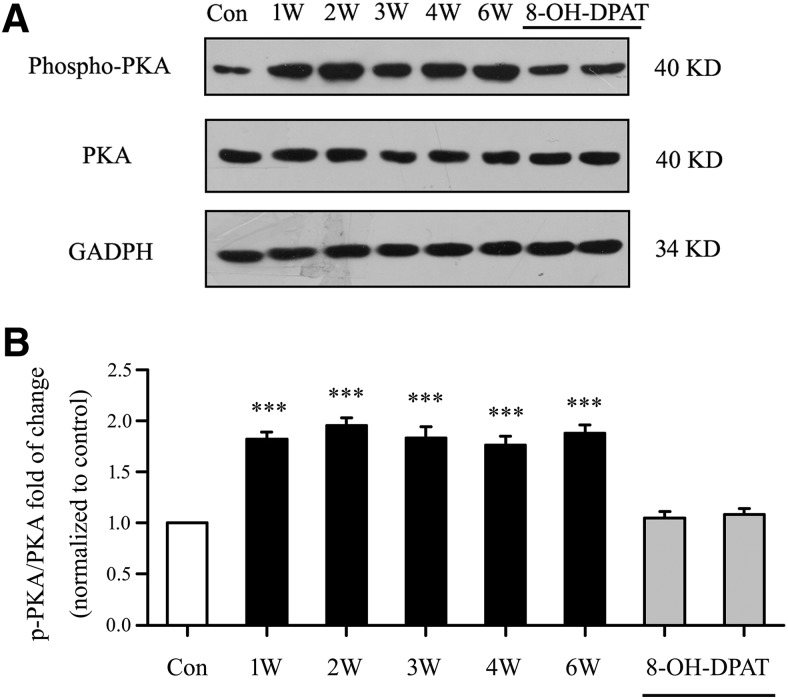
We first assessed whether the phosphorylation of PKA protein levels were altered in glaucomatous rat retinas relative to those in control retinas. Western blot analysis showed marked increases in p-PKA/PKA levels in glaucomatous retinas relative to those in control retinas from 1–6 weeks after IOP was increased (Fig. 16A). Antibodies against p-PKA and PKA recognized single bands at ∼40 kDa. As shown in Figure 16B, the effect of the eight groups on p-PKA/PKA levels was significant (F(7,40) = 33.099, p = 0.0002, ANOVA). The mean p-PKA/PKA fold change increased to 182 ± 7% of the control level at 1 week (n = 6, p = 0.0001), to 195 ± 8% of the control level at 2 weeks (n = 6, p = 0.0001), to 183 ± 11% of the control level at 3 weeks (n = 6, p = 0.0001), to 176 ± 9% of the control level at 4 weeks (n = 6, p = 0.0001), and to 188 ± 8% of the control level at 6 weeks (n = 6, p = 0.0001). Intravitreal injection of 8-OH-DPAT significantly decreased the phosphorylation of PKA in the retina. These findings indicate that stimulation of 5-HT1A receptors in the retina reduces the increase in PKA phosphorylation induced by glaucoma.
Figure 16.
Role of cAMP-PKA signaling in glaucoma and 8-OH-DPAT-treated glaucoma rats. A, For the measurement of PKA phosphorylation levels, representative Western blot images of p-PKA (Thr197) and PKA total protein are shown. B, Quantitative analyses of p-PKA (Thr197) relative to PKA total protein are shown in the bar graph (***p < 0.001, one-way ANOVA).
Discussion
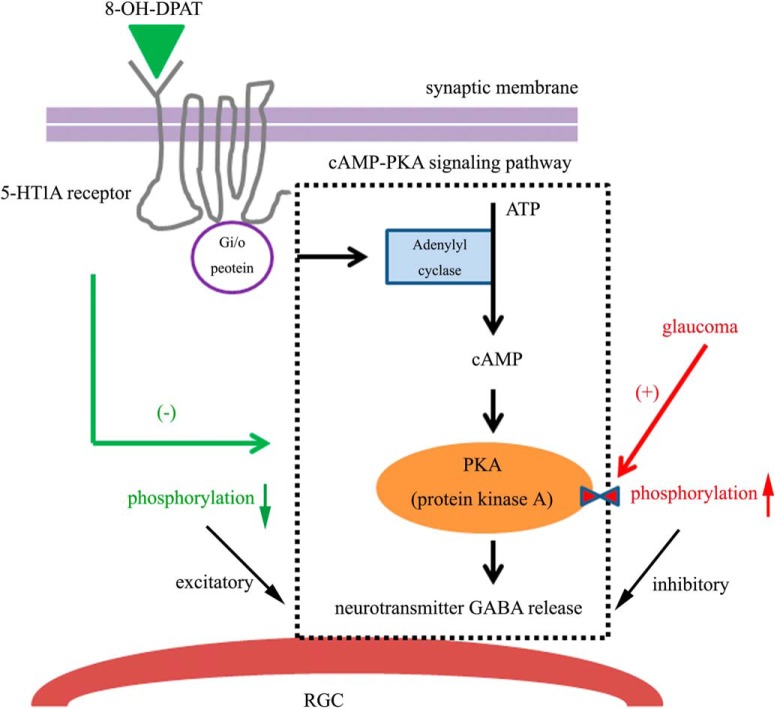
In the present study, we first show that intraocular hypertension rapidly resulted in the downregulation of 5-HT1A receptor protein in RGCs. Second, the 5-HT1A receptor protected the somas of RGCs and ameliorated impaired RGC function and its protective effects could be blocked by the selective 5-HT1A receptor antagonist WAY-100635 or the selective GABAA receptor antagonist SR95531. Third, whole-cell patch-clamp recording found that 8-OH-DPAT significantly increased the frequency and amplitude of the GABAergic sIPSCs and mIPSCs of ON- and OFF-type RGCs. Fourth, the excitatory role of the 5-HT1A receptors on presynaptic GABA release could be mediated by their inhibition of the cAMP-PKA pathway. Fifth, glaucoma promotes the phosphorylation of PKA, which was reversed by 8-OH-DPAT. Collectively, this study identified a novel mechanism by which activation of the 5-HT1A receptor modulates the neuronal GABAergic system function of RGC protection resulting from increased inhibitory synaptic input to the RGCs. A representative diagram of possible mechanisms is presented in Figure 17.
Figure 17.
Hypothetical mechanisms of the intracellular pathways underlying the results found in this study. Schematic model showing possible intracellular mechanisms for the neuroprotective effects of 5-HT1A receptor activation. In our study, the mechanism underlying the cAMP-PKA signaling pathway in the glaucoma condition is as follows: adenylate cyclase is activated, which increases cAMP formation and consequently increases PKA-mediated protein phosphorylation, thus reducing fast neurotransmitter GABA release. Activation of the presynaptic 5-HT1A receptor by 8-OH-DPAT inhibits this cascade reaction via the Gi/o protein, increasing GABA release from presynaptic GABAergic amacrine cells. Therefore, the release of GABA can neutralize the activity of excitotoxicity in glaucoma.
Retrograde tracing is a feasible and effective method to study RGCs through animal experiments (Mead and Tomarev, 2016). Because healthy axonal flow is essential for the retrograde labeling of RGCs (Abbott et al., 2013), any axonal transport facility dysfunction will directly influence the number of labeled RGCs in the soma (Vidal-Sanz et al., 2015; Mead and Tomarev, 2016). Conversely, retrograde tracing may be more sensitive to RGC dysfunction or loss. When the RGCs are damaged or lost for pathology, the RGCs somas and axons are subsequently damaged or lost and then the retrograde marker cannot mark missing RGCs. Glaucoma is itself a multifactor disease. The excitement of RGC toxicity is caused by glaucoma, whereas glaucoma may also affect the axon transport capacity and neurotrophic factor transport (Downs et al., 2008) perhaps because axonal transport barriers lead to reduced numbers of RGCs. Axonal degeneration of RGCs is a marker of glaucoma and local defects in the retinal nerve fibers of glaucoma patients suggest that, in this case, axonal degeneration may precede RGC soma death (Munemasa and Kitaoka, 2015). Therefore, in addition to neutralizing the excitotoxicity of RGCs by enhancing the release of the inhibitive neurotransmitter GABA, 8-OH-DPAT may label viable RGCs by improving axon transport facility and providing more nutritional support. These damaged RGCs may eventually die, but the process may be slowed by the regulation of axon transport capacity by 8-OH-DPAT. Whether 8-OH-DPAT can improve axon transport capacity remains to be further verified in subsequent experiments.
We compared the frequency and amplitude of sIPSCs and mIPSCs in ON- and OFF-type RGCs and found significant differences in the frequency but not the amplitude of mIPSCs between these subtypes. The mIPSC frequencies were greater in OFF-type RGCs than ON-type RGCs. Previous studies have reported that OFF-type RGCs show significantly higher spike rates than ON-type cells and require less depolarization to reach their action potential thresholds and fire more spikes in response to current injection relative to ON-type cells (Myhr et al., 2001). What are the causes of these differences in the mIPSCs of ON- and OFF-type RGCs? The excitement of OFF-type cells and the change in electrical conductance are larger than those in ON-type cells. The larger sIPSCs in OFF-type cells may simply reflect larger GABA-mediated synaptic inputs.
Many previous studies have presented evidence that 5-HT is an important neurotransmitter in the retina (Hidaka, 2009), which is further supported by the fact that 5-HT receptors are detectable in the retinal pigment epithelium of rats. 5-HT2A and 5-HT2C receptor agonists had also previously been shown to induce a concentration-dependent increase in the frequency of sIPSCs in GABAergic interneurons recorded from dorsal raphe nucleus (DRN) slices and this effect was blocked by the inhibitor of voltage-gated sodium channels tetrodotoxin, suggesting that 5-HT2A and 5-HT2C receptors have no effect on mIPSCs (Liu et al., 2000). However, in our study, 5-HT1A receptor-mediated GABA release was not inhibited after pretreatment with TTX, which indicates that these processes are not dependent on sodium channels. GABAergic inputs activated by 5-HT1A receptors could serve within a local, negative-feedback loop to regulate the impulse flow of RGCs. Conversely, our data also suggest that 5-HT1A receptors are located on the terminals of the GABAergic amacrine neurons preceding the RGCs. The 5-HT1A receptor-induced increases in the amplitudes of GABAergic mIPSCs in RGCs suggest that the increased amplitudes of mIPSCs are likely postsynaptic effects. Whether the postsynaptic effects of 5-HT1A receptors are affected in RGCs needs to be further confirmed by examining GABA-induced currents and GABA receptors in future experiments.
In the prefrontal cortex–amygdala system, a previous study highlighted a role for 5-HT and GABAergic neurotransmission in response to stress and suggested a method to develop therapeutic approaches for the treatment of depression by exploiting combinatory actions on different neurotransmitter systems (Andolina et al., 2014). In the hippocampal CA1 area, reports showed that the activation of 5-HT7 receptors located on inhibitory interneurons enhanced GABAergic transmission (Tokarski et al., 2011), thus hyperpolarizing cells and decreasing the firing frequency. In DRN serotonergic projection neurons, tonically active 5-HT7 receptors increased the frequency of sIPSCs, whereas a 5-HT7 receptor blocker, SB269970, decreased this frequency, modulating the firing and GABA release from inhibitory interneurons (Kusek et al., 2015). The 5-HT7 receptor also binds to the Gs-protein, resulting in the activation of adenylyl cyclase and increasing the cAMP concentration (Guseva et al., 2014). In vivo studies later reported that the injection of a 5-HT7 receptor antagonist into hamsters blocked the progression of 8-OH-DPAT-induced rotor-running activity (Shelton et al., 2014). For comparison, we found that 8-OH-DPAT specifically increased the frequency and amplitude of GABAergic sIPSCs and mIPSCS in RGCs, but the effects were not blocked by the 5-HT7 receptor blocker SB269970, suggesting that 5-HT7 receptors are not involved in the regulation of presynaptic neurotransmitter GABA release on retinal neurons.
Early research found that 8-OH-DPAT, which has an affinity for 5HT1A and 5-HT7 receptors and, to a lesser extent, for α1-adrenoceptors, produced dose-dependent hypotensive effects in pithed rats (Kozhevnikova et al., 2011). 8-OH-DPAT is also an agonist for α2-adrenoceptors (Assié and Koek, 2000). Activation of α1-adrenoceptors increases GABAA-IPSC frequency (Dumont and Williams, 2004). Noradrenaline inhibits the GABAB receptor due to α1-adrenoceptors (Croce et al., 2003). In vivo studies have demonstrated that the α2-adrenoceptor agonist brimonidine exerts retinal neuroprotection with functional benefits and reduces intraocular pressure in glaucoma patients (Nizari et al., 2016). Alpha2-adrenoceptors are also coupled to a G-protein (Gi/o) that inhibits adenylate cyclase and the subsequent decrease in cAMP reduces the activity of PKA, playing an important role in the regulation of transmitter release (Bukharaeva et al., 2002). Most studies have found that α2A adrenoceptor mediates the presynaptic inhibition of GABAergic transmission in rat tuberomammillary nucleus histaminergic neurons (Nakamura et al., 2013). The most likely scenario is that α2-adrenoceptors act presynaptically to inhibit GABA release onto the multipolar ventrolateral preoptic nucleus neurons (Matsuo et al., 2003). Under our experimental conditions, the results were reversed: we found that the α2-adrenoceptors agonist brimonidine significantly increased the frequency and amplitude of the GABAergic sIPSCs/mIPSCs. Therefore, it is not clear whether the excitatory effect of 8-OH-DPAT on the release of GABA neurotransmitters acts on 5-HT1A or the α1-/α2-adrenoceptors. To address this, we further verified whether the specific α1-adrenoceptor antagonist prazosin and the specific α2-adrenoceptor antagonist yohimbine could antagonize the regulation of GABA inhibition by 8-OH-DPAT. We obtained negative results: α1- and α2-adrenoceptors were not involved in the enhanced effect of 8-OH-DPAT on the release of GABA neurotransmitter.
Moreover, the activated postsynaptic 5-HT1A receptor also coupled with G-protein (Gi/o). The 5-HT1A receptor regulates the expression of the second messenger cAMP by activating adenylate cyclase, which in turn affects the activity of PKA (Qiu et al., 2018). 8-OH-DPAT inhibits the activity of adenylate cyclase by coupling with Giα, resulting in the reduction of cAMP formation and the consequential inhibition of PKA-mediated protein phosphorylation. PKA is also known to modulate GABAA receptors because early studies have indicated that GABAA receptor activity can be reduced by the acute activation of PKA (Porter et al., 1990) and its expression can be modulated by the chronic treatment of intracellular cAMP in granule cells (Thompson and Wall, 1996). In airway epithelial cells, PKA regulates the release of GABA both in vivo and in vitro (Danielsson et al., 2016). cAMP signaling suppresses the frequency of inhibitory GABAergic IPSCs in a PKA-dependent manner in Drosophila primary neuronal cultures (Ganguly and Lee, 2013). We found that application of the selective cAMP-PKA pathway inhibitor H-89 alone significantly increased the baseline frequency and amplitude of GABAergic mIPSCs. We mimicked H-89 downregulation of the cAMP-PKA pathway using 8-OH-DPAT.
In addition, WAY-100635 alone did not significantly alter the baseline frequency and amplitude of sIPSCs and mIPSCs. There are a number of possible implications of these data, including that endogenous regulation of the 5HT1A receptor does not substantially modulate native inhibitory signal transmission in the inner retina. Furthermore, WAY-100635-induced hypotension in anesthetized rats is due to α1-adrenoceptor inhibition (Villalobos-Molina et al., 2002) and our data also found that the α1-adrenoceptor antagonist prazosin induced robust increases in sIPSC/mIPSC frequency and amplitude, whereas the 5-HT1A receptor antagonist WAY-100635 is a potent dopamine D4 receptor agonist (Chemel et al., 2006) and suppresses GABAergic IPSCs (Wang et al., 2002). The mechanism underlying the D4-mediated regulation of GABAA receptor currents was blocked by PKA activation and occluded by PKA inhibition in a manner very similar to that of the 5HT1A receptor agonist 8-OH-DPAT (Wang et al., 2002). The 5-HT1A receptor antagonist WAY-100635 may produce undesirable “off-target” effects via nonspecific interactions or pathway cross talk for the dopamine receptor or α-adrenoceptors (Newman-Tancredi et al., 1998) that drive native and induced physiological outcomes differentially or in combination.
Conclusions
The results presented herein confirm that downregulation of 5-HT1A receptors affects the balance between the retinal excitation/inhibition statuses and that the important and novel synaptic mechanism underlying 5-HT1A-receptor-induced neuroprotection involving the stimulation of presynaptic GABAergic activity and 5-HT1A receptors could restore neural equilibrium. Herein, using a chronic glaucoma rat model, we confirmed a mechanism underlying glaucomatous neuropathy as follows: increased retinal p-PKA levels along with decreased GABAergic mIPSC frequency in the glaucomatous retinas suggest upregulation of the cAMP-PKA pathway function and a conspicuous reduction in GABA release. Taking all of our findings together, we propose that selective stimulation of the retinal 5-HT1A receptor and its Gi/o protein-coupled cAMP-PKA signaling pathway and the consequential activation of GABA release is an effective neuroprotective strategy for the treatment of glaucoma, thus contributing to our understanding of the synaptic role and mechanism of RGC injury.
Footnotes
This work was supported by the National Natural Science Foundation of China (Grants 81400396, 81770925 and 81790641), and the International Science and Technology Cooperation Program of China (Grant 2015DFA31340), the National Key Basic Research Program of China (Grant 2013CB967503), and the Shanghai Natural Science Foundation (Grant14ZR1405500).
The authors declare no competing financial interests.
References
- Abbott CJ, Choe TE, Lusardi TA, Burgoyne CF, Wang L, Fortune B (2013) Imaging axonal transport in the rat visual pathway. Biomed Opt Express 4:364–386. 10.1364/BOE.4.000364 [DOI] [PMC free article] [PubMed] [Google Scholar]
- Andolina D, Maran D, Viscomi MT, Puglisi-Allegra S (2014) Strain-dependent variations in stress coping behavior are mediated by a 5-HT/GABA interaction within the prefrontal corticolimbic system. Int J Neuropsychopharmacol. 18:pyu074. 10.1093/ijnp/pyu074 [DOI] [PMC free article] [PubMed] [Google Scholar]
- Assié MB, Koek W (2000) [(3)H]-8-OH-DPAT binding in the rat brain raphe area: involvement of 5-HT(1A) and non-5-HT(1A) receptors. Br J Pharmacol 130:1348–1352. 10.1038/sj.bjp.0703426 [DOI] [PMC free article] [PubMed] [Google Scholar]
- Biermann J, Grieshaber P, Goebel U, Martin G, Thanos S, Di Giovanni S, Lagrèze WA (2010) Valproic acid-mediated neuroprotection and regeneration in injured retinal ganglion cells. Invest Ophthalmol Vis Sci 51:526–534. 10.1167/iovs.09-3903 [DOI] [PubMed] [Google Scholar]
- Bukharaeva EA, Samigullin D, Nikolsky E, Vyskocil F (2002) Protein kinase A cascade regulates quantal release dispersion at frog muscle endplate. J Physiol 538:837–848. 10.1113/jphysiol.2001.012752 [DOI] [PMC free article] [PubMed] [Google Scholar]
- Chanut E, Nguyen-Legros J, Labarthe B, Trouvin JH, Versaux-Botteri C (2002) Serotonin synthesis and its light-dark variation in the rat retina. J Neurochem 83:863–869. 10.1046/j.1471-4159.2002.01194.x [DOI] [PubMed] [Google Scholar]
- Chemel BR, Roth BL, Armbruster B, Watts VJ, Nichols DE (2006) WAY-100635 is a potent dopamine D4 receptor agonist. Psychopharmacology 188:244–251. 10.1007/s00213-006-0490-4 [DOI] [PubMed] [Google Scholar]
- Chen J, Miao Y, Wang XH, Wang Z (2011) Elevation of p-NR2A(S1232) by Cdk5/p35 contributes to retinal ganglion cell apoptosis in a rat experimental glaucoma model. Neurobiol Dis 43:455–464. 10.1016/j.nbd.2011.04.019 [DOI] [PubMed] [Google Scholar]
- Crider JY, Williams GW, Drace CD, Katoli P, Senchyna M, Sharif NA (2003) Pharmacological characterization of a serotonin receptor (5-HT7) stimulating cAMP production in human corneal epithelial cells. Invest Ophthalmol Vis Sci 44:4837–4844. 10.1167/iovs.02-1292 [DOI] [PubMed] [Google Scholar]
- Croce A, Astier H, Recasens M, Vignes M (2003) Opposite effects of alpha 1- and beta-adrenoceptor stimulation on both glutamate- and gamma-aminobutyric acid-mediated spontaneous transmission in cultured rat hippocampal neurons. J Neurosci Res 71:516–525. 10.1002/jnr.10516 [DOI] [PubMed] [Google Scholar]
- Danielsson J, Zaidi S, Kim B, Funayama H, Yim PD, Xu D, Worgall TS, Gallos G, Emala CW (2016) Airway epithelial cell release of GABA is regulated by protein kinase A. Lung 194:401–408. 10.1007/s00408-016-9867-2 [DOI] [PMC free article] [PubMed] [Google Scholar]
- Downs JC, Roberts MD, Burgoyne CF (2008) Mechanical environment of the optic nerve head in glaucoma. Optometry and Vision Science 85:425–435. [DOI] [PMC free article] [PubMed] [Google Scholar]
- Dumont EC, Williams JT (2004) Noradrenaline triggers GABAA inhibition of bed nucleus of the stria terminalis neurons projecting to the ventral tegmental area. J Neurosci 24:8198–8204. 10.1523/JNEUROSCI.0425-04.2004 [DOI] [PMC free article] [PubMed] [Google Scholar]
- Famiglietti EV Jr, Kolb H (1976) Structural basis for ON-and OFF-center responses in retinal ganglion cells. Science 194:193–195. 10.1126/science.959847 [DOI] [PubMed] [Google Scholar]
- Ganguly A, Lee D (2013) Suppression of inhibitory GABAergic transmission by cAMP signaling pathway: alterations in learning and memory mutants. The European journal of neuroscience 37:1383–1393. 10.1111/ejn.12144 [DOI] [PMC free article] [PubMed] [Google Scholar]
- George A, Schmid KL, Pow DV (2005) Retinal serotonin, eye growth and myopia development in chick. Experimental eye research 81:616–625. 10.1016/j.exer.2005.03.021 [DOI] [PubMed] [Google Scholar]
- Guseva D, Wirth A, Ponimaskin E (2014) Cellular mechanisms of the 5-HT7 receptor-mediated signaling. Front Behav Neurosci 8:306. 10.3389/fnbeh.2014.00306 [DOI] [PMC free article] [PubMed] [Google Scholar]
- Hannon J, Hoyer D (2008) Molecular biology of 5-HT receptors. Behav Brain Res 195:198–213. 10.1016/j.bbr.2008.03.020 [DOI] [PubMed] [Google Scholar]
- Hidaka S. (2009) Serotonergic synapses modulate generation of spikes from retinal ganglion cells of teleosts. J Integr Neurosci 8:299–322. 10.1142/S0219635209002198 [DOI] [PubMed] [Google Scholar]
- Hoyer D, Clarke DE, Fozard JR, Hartig PR, Martin GR, Mylecharane EJ, Saxena PR, Humphrey PP (1994) International union of pharmacology classification of receptors for 5-hydroxytryptamine (serotonin). Pharmacol Rev 46:157–203. [PubMed] [Google Scholar]
- Ishikawa M. (2013) Abnormalities in glutamate metabolism and excitotoxicity in the retinal diseases. Scientifica 2013:528940. 10.1155/2013/528940 [DOI] [PMC free article] [PubMed] [Google Scholar]
- Jeffries AM, Killian NJ, Pezaris JS (2014) Mapping the primate lateral geniculate nucleus: a review of experiments and methods. J Physiol (Paris) 108:3–10. 10.1016/j.jphysparis.2013.10.001 [DOI] [PMC free article] [PubMed] [Google Scholar]
- Ji M, Miao Y, Dong LD, Chen J, Mo XF, Jiang SX, Sun XH, Yang XL, Wang Z (2012) Group I mGluR-mediated inhibition of kir channels contributes to retinal muller cell gliosis in a rat chronic ocular hypertension model. J Neurosci 32:12744–12755. 10.1523/JNEUROSCI.1291-12.2012 [DOI] [PMC free article] [PubMed] [Google Scholar]
- Ju WK, Misaka T, Kushnareva Y, Nakagomi S, Agarwal N, Kubo Y, Lipton SA, Bossy-Wetzel E (2005) OPA1 expression in the normal rat retina and optic nerve. J Comp Neurol 488:1–10. 10.1002/cne.20586 [DOI] [PMC free article] [PubMed] [Google Scholar]
- Kimura A, Namekata K, Guo X, Noro T, Harada C, Harada T (2015) Valproic acid prevents NMDA-induced retinal ganglion cell death via stimulation of neuronal TrkB receptor signaling. Am J Pathol 185:756–764. 10.1016/j.ajpath.2014.11.005 [DOI] [PubMed] [Google Scholar]
- Kozhevnikova LM, Sukhanova IF, Avdonin PV (2011) Activation of “silent” vasoconstrictive 5-HT1A receptors as a possible mechanism of synergism in angiotensin II and serotonin effect on vascular tone [Article in Russian]. Izv Akad Nauk Ser Biol 38:68–76. 10.1134/S1062359011010079 [DOI] [PubMed] [Google Scholar]
- Kusek M, Sowa J, Kamińska K, Gołembiowska K, Tokarski K, Hess G (2015) 5-HT7 receptor modulates GABAergic transmission in the rat dorsal raphe nucleus and controls cortical release of serotonin. Front Cell Neurosci 9:324. 10.3389/fncel.2015.00324 [DOI] [PMC free article] [PubMed] [Google Scholar]
- Li Q, Cui P, Miao Y, Gao F, Li XY, Qian WJ, Jiang SX, Wu N, Sun XH, Wang Z (2017) Activation of group I metabotropic glutamate receptors regulates the excitability of rat retinal ganglion cells by suppressing kir and I h. Brain Struct Funct 222:813–830. 10.1007/s00429-016-1248-3 [DOI] [PubMed] [Google Scholar]
- Liu R, Jolas T, Aghajanian G (2000) Serotonin 5-HT(2) receptors activate local GABA inhibitory inputs to serotonergic neurons of the dorsal raphe nucleus. Brain Res 873:34–45. 10.1016/S0006-8993(00)02468-9 [DOI] [PubMed] [Google Scholar]
- Lograno MD, Romano MR (2003) Pharmacological characterization of the 5-HT1A, 5-HT2 and 5-HT3 receptors in the bovine ciliary muscle. Eur J Pharmacol 464:69–74. 10.1016/S0014-2999(03)01320-7 [DOI] [PubMed] [Google Scholar]
- Margolis DJ, Detwiler PB (2007) Different mechanisms generate maintained activity in ON and OFF retinal ganglion cells. J Neurosci 27:5994–6005. 10.1523/JNEUROSCI.0130-07.2007 [DOI] [PMC free article] [PubMed] [Google Scholar]
- Matsuo S, Jang IS, Nabekura J, Akaike N (2003) alpha 2-adrenoceptor-mediated presynaptic modulation of GABAergic transmission in mechanically dissociated rat ventrolateral preoptic neurons. J Neurophysiol 89:1640–1648. 10.1152/jn.00491.2002 [DOI] [PubMed] [Google Scholar]
- May JA, McLaughlin MA, Sharif NA, Hellberg MR, Dean TR (2003) Evaluation of the ocular hypotensive response of serotonin 5-HT1A and 5-HT2 receptor ligands in conscious ocular hypertensive cynomolgus monkeys. J pharmacol Exp Ther 306:301–309. 10.1124/jpet.103.049528 [DOI] [PubMed] [Google Scholar]
- Mead B, Tomarev S (2016) Evaluating retinal ganglion cell loss and dysfunction. Exp Eye Res 151:96–106. 10.1016/j.exer.2016.08.006 [DOI] [PMC free article] [PubMed] [Google Scholar]
- Middlemiss DN, Fozard JR (1983) 8-hydroxy-2-(di-n-propylamino)-tetralin discriminates between subtypes of the 5-HT1 recognition site. Eur J Pharmacol 90:151–153. 10.1016/0014-2999(83)90230-3 [DOI] [PubMed] [Google Scholar]
- Mittag TW, Danias J, Pohorenec G, Yuan HM, Burakgazi E, Chalmers-Redman R, Podos SM, Tatton WG (2000) Retinal damage after 3 to 4 months of elevated intraocular pressure in a rat glaucoma model. Invest Ophthalmol Vis Sci 41:3451–3459. [PubMed] [Google Scholar]
- Munemasa Y, Kitaoka Y (2015) Autophagy in axonal degeneration in glaucomatous optic neuropathy. Prog Retinal Eye Res 47:1–18. 10.1016/j.preteyeres.2015.03.002 [DOI] [PubMed] [Google Scholar]
- Myhr KL, Lukasiewicz PD, Wong RO (2001) Mechanisms underlying developmental changes in the firing patterns of ON and OFF retinal ganglion cells during refinement of their central projections. J Neurosci 21:8664–8671. 10.1523/JNEUROSCI.21-21-08664.2001 [DOI] [PMC free article] [PubMed] [Google Scholar]
- Nakamura M, Suk K, Lee MG, Jang IS (2013) alpha(2A) adrenoceptor-mediated presynaptic inhibition of GABAergic transmission in rat tuberomammillary nucleus neurons. J Neurochem 125:832–842. 10.1111/jnc.12259 [DOI] [PubMed] [Google Scholar]
- Newman-Tancredi A, Nicolas JP, Audinot V, Gavaudan S, Verrièle L, Touzard M, Chaput C, Richard N, Millan MJ (1998) Actions of alpha2 adrenoceptor ligands at alpha2A and 5-HT1A receptors: the antagonist, atipamezole, and the agonist, dexmedetomidine, are highly selective for alpha2A adrenoceptors. Naunyn Schmiedebergs Arch Pharmacol 358:197–206. [DOI] [PubMed] [Google Scholar]
- Nichols DE, Nichols CD (2008) Serotonin receptors. Chem Rev 108:1614–1641. 10.1021/cr078224o [DOI] [PubMed] [Google Scholar]
- Nizari S, Guo L, Davis BM, Normando EM, Galvao J, Turner LA, Bizrah M, Dehabadi M, Tian K, Cordeiro MF (2016) Non-amyloidogenic effects of alpha2 adrenergic agonists: implications for brimonidine-mediated neuroprotection. Cell Death Dis 7:e2514. 10.1038/cddis.2016.397 [DOI] [PMC free article] [PubMed] [Google Scholar]
- Osborne NN, Nesselhut T, Nicholas DA, Cuello AC (1981) Serotonin: a transmitter candidate in the vertebrate retina. Neurochem Int 3:171–176. [DOI] [PubMed] [Google Scholar]
- Osborne NN, Wood JP, Melena J, Chao HM, Nash MS, Bron AJ, Chidlow G (2000) 5-Hydroxytryptamine1A agonists: potential use in glaucoma: evidence from animal studies. Eye (Lond) 14:454–463. 10.1038/eye.2000.131 [DOI] [PubMed] [Google Scholar]
- Perry VH, Cowey A (1984) Retinal ganglion cells that project to the superior colliculus and pretectum in the macaque monkey. Neuroscience 12:1125–1137. [DOI] [PubMed] [Google Scholar]
- Pisani F, Costa C, Caccamo D, Mazzon E, Gorgone G, Oteri G, Calabresi P, Ientile R (2006) Tiagabine and vigabatrin reduce the severity of NMDA-induced excitotoxicity in chick retina. Exp Brain Res 171:511–515. 10.1007/s00221-005-0298-1 [DOI] [PubMed] [Google Scholar]
- Polter AM, Li X (2010) 5-HT1A receptor-regulated signal transduction pathways in brain. Cell Signal 22:1406–1412. 10.1016/j.cellsig.2010.03.019 [DOI] [PMC free article] [PubMed] [Google Scholar]
- Porter NM, Twyman RE, Uhler MD, Macdonald RL (1990) Cyclic AMP-dependent protein kinase decreases GABAA receptor current in mouse spinal neurons. Neuron 5:789–796. [DOI] [PubMed] [Google Scholar]
- Qiu Y, Wang Y, Wang X, Wang C, Xia ZY (2018) Role of the hippocampal 5-HT1A receptor-mediated cAMP/PKA signalling pathway in sevoflurane-induced cognitivedysfunction in aged rats. J Int Med Res 46:1073–1085. 10.1177/0300060517744037 [DOI] [PMC free article] [PubMed] [Google Scholar]
- Reynolds AJ, Bartlett SE, Hendry IA (2000) Molecular mechanisms regulating the retrograde axonal transport of neurotrophins. Brain Res Brain Res Rev 33:169–178. [DOI] [PubMed] [Google Scholar]
- Rogawski MA, Löscher W (2004) The neurobiology of antiepileptic drugs. Nat Rev Neurosci 5:553–564. 10.1038/nrn1430 [DOI] [PubMed] [Google Scholar]
- Rojas PS, Fiedler JL (2016) What do we really know about 5-HT1A receptor signaling in neuronal cells? Front Cell Neurosci 10:272. 10.3389/fncel.2016.00272 [DOI] [PMC free article] [PubMed] [Google Scholar]
- Schmitz D, Empson RM, Heinemann U (1995) Serotonin reduces inhibition via 5-HT1A receptors in area CA1 of rat hippocampal slices in vitro. J Neurosci 15:7217–7225. [DOI] [PMC free article] [PubMed] [Google Scholar]
- Sellés-Navarro I, Villegas-Pérez MP, Salvador-Silva M, Ruiz-Gómez JM, Vidal-Sanz M (1996) Retinal ganglion cell death after different transient periods of pressure-induced ischemia and survival intervals: a quantitative in vivo study. Invest Ophthalmol Vis Sci 37:2002–2014. [PubMed] [Google Scholar]
- Shabanzadeh AP, D'Onofrio PM, Monnier PP, Koeberle PD (2015) Targeting caspase-6 and caspase-8 to promote neuronal survival following ischemic stroke. Cell Death Dis 6:e1967. 10.1038/cddis.2015.272 [DOI] [PMC free article] [PubMed] [Google Scholar]
- Sharif NA, Senchyna M (2006) Serotonin receptor subtype mRNA expression in human ocular tissues, determined by RT-PCR. Mol Vis 12:1040–1047. [PubMed] [Google Scholar]
- Shelton J, Yun S, Losee Olson S, Turek F, Bonaventure P, Dvorak C, Lovenberg T, Dugovic C (2014) Selective pharmacological blockade of the 5-HT7 receptor attenuates light and 8-OH-DPAT induced phase shifts of mouse circadian wheel running activity. Front Behav Neurosci 8:453. 10.3389/fnbeh.2014.00453 [DOI] [PMC free article] [PubMed] [Google Scholar]
- Tada K, Kasamo K, Suzuki T, Matsuzaki Y, Kojima T (2004) Endogenous 5-HT inhibits firing activity of hippocampal CA1 pyramidal neurons during conditioned fear stress-induced freezing behavior through stimulating 5-HT1A receptors. Hippocampus 14:143–147. 10.1002/hipo.10178 [DOI] [PubMed] [Google Scholar]
- Thompson SW, Wall PD (1996) The effect of GABA and 5-HT receptor antagonists on rat dorsal root potentials. Neurosci Lett 217:153–156. [PubMed] [Google Scholar]
- Tokarski K, Kusek M, Hess G (2011) 5-HT7 receptors modulate GABAergic transmission in rat hippocampal CA1 area. J Physiol Pharmacol 62:535–540. [PubMed] [Google Scholar]
- Trong PK, Rieke F (2008) Origin of correlated activity between parasol retinal ganglion cells. Nat Neurosci 11:1343–1351. 10.1038/nn.2199 [DOI] [PMC free article] [PubMed] [Google Scholar]
- Vidal-Sanz M, Valiente-Soriano FJ, Ortín-Martínez A, Nadal-Nicolás FM, Jiménez-López M, Salinas-Navarro M, Alarcón-Martínez L, García-Ayuso D, Avilés-Trigueros M, Agudo-Barriuso M, Villegas-Pérez MP (2015) Retinal neurodegeneration in experimental glaucoma. Prog Brain Res 220:1–35. [DOI] [PubMed] [Google Scholar]
- Villalobos-Molina R, López-Guerrero JJ, Gallardo-Ortíz IA, Ibarra M (2002) Evidence that the hypotensive effect of WAY 100635, a 5-HT1A receptor antagonist, is related to vascular alpha 1-adrenoceptor blockade in the adult rat. Auton Autacoid Pharmacol 22:171–176. [DOI] [PubMed] [Google Scholar]
- Wang X, Zhong P, Yan Z (2002) Dopamine D4 receptors modulate GABAergic signaling in pyramidal neurons of prefrontal cortex. J Neurosci 22:9185–9193. [DOI] [PMC free article] [PubMed] [Google Scholar]
- Wu J, Zhang S, Sun X (2010) Neuroprotective effect of upregulated sonic hedgehog in retinal ganglion cells following chronic ocular hypertension. Invest Ophthalmol Vis Sci 51:2986–2992. 10.1167/iovs.09-4151 [DOI] [PubMed] [Google Scholar]
- Yang G, Dong WH, Hu CL, Mei YA (2015) PGE2 modulates GABAA receptors via an EP1 receptor-mediated signaling pathway. Cell Physiol Biochem 36:1699–1711. 10.1159/000430143 [DOI] [PubMed] [Google Scholar]
- Yang XL. (2004) Characterization of receptors for glutamate and GABA in retinal neurons. Prog Neurobiol 73:127–150. 10.1016/j.pneurobio.2004.04.002 [DOI] [PubMed] [Google Scholar]
- Yoneda S, Tanaka E, Goto W, Ota T, Hara H (2003) Topiramate reduces excitotoxic and ischemic injury in the rat retina. Brain Res 967:257–266. [DOI] [PubMed] [Google Scholar]
- Zhou X, Zong Y, Zhang R, Zhang X, Zhang S, Wu J, Sun X (2017a) Differential modulation of GABAA and NMDA receptors by an alpha7-nicotinic acetylcholine receptor agonist in chronic glaucoma. Front Mol Neurosci 10:422. 10.3389/fnmol.2017.00422 [DOI] [PMC free article] [PubMed] [Google Scholar]
- Zhou X, Cheng Y, Zhang R, Li G, Yang B, Zhang S, Wu J (2017b) Alpha7 nicotinic acetylcholine receptor agonist promotes retinal ganglion cell function via modulating GABAergic presynaptic activity in a chronic glaucomatous model. Sci Rep 7:1734. 10.1038/s41598-017-02092-6 [DOI] [PMC free article] [PubMed] [Google Scholar]


