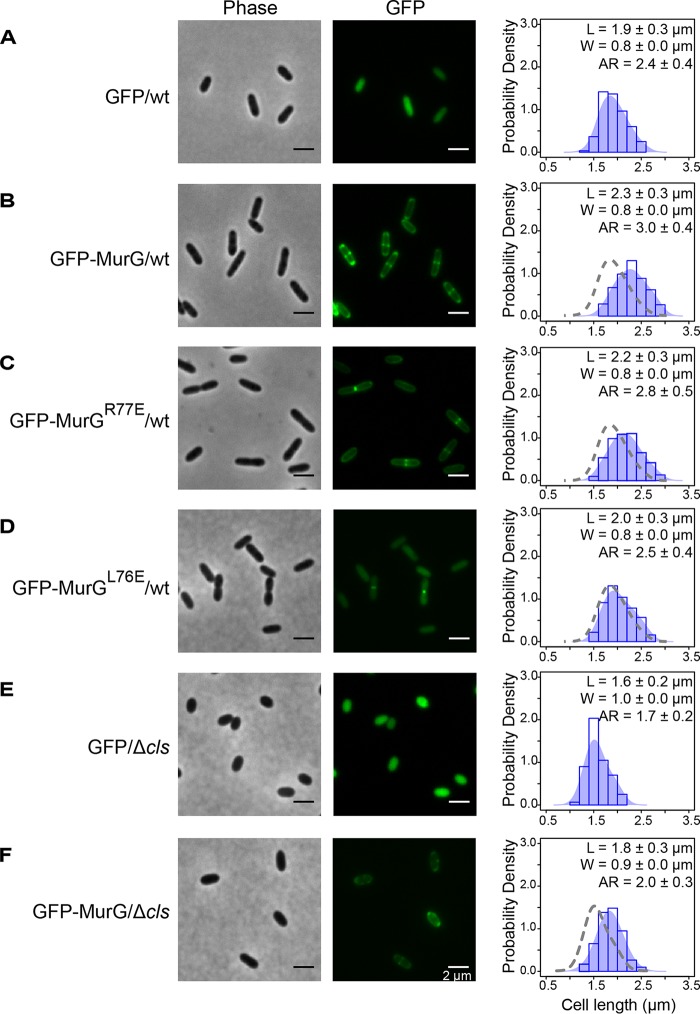
FIG 5.
MurG activity correlates with the length of R. sphaeroides cells. The micrographs are representative of R. sphaeroides wt cells expressing GFP (A), wt cells expressing GFP-MurG (B), wt cells expressing GFP-MurGR77E (C), wt cells expressing GFP-MurGL76E (D), Δcls cells expressing GFP (E), and Δcls cells expressing GFP-MurG (F) from the pIND vector without IPTG induction. Cells were grown to log phase (absorbance of 0.6, λ = 600 nm) and imaged using phase-contrast bright-field and fluorescence microscopy. A probability density histogram of the cell length distribution of each strain is shown on the right panel. Each data point represents a mean value ± standard deviation of the cell length (L), width (W), and aspect ratio (AR) for 300 cells determined by ImageJ. The shaded blue area overlaying the histogram represents the Kernel density estimation (KDE) of the cell length distribution. We overlaid a gray dashed line outlining the KDE of the cell length distribution of R. sphaeroides wt cells expressing GFP with the histograms of wt cells expressing GFP-MurG, wt cells expressing GFP-MurGR77E, and wt cells expressing GFP-MurGL76E for comparison. We also overlaid a gray dashed line outlining the KDE of the cell length distribution of R. sphaeroides Δcls cells expressing GFP with the histogram of Δcls cells expressing GFP-MurG for comparison.

