

Abstract
Mutations in myocyte enhancer factor 2C (MEF2C), an important transcription factor in neurodevelopment, are associated with a Rett-like syndrome. Structural variants (SVs) upstream of MEF2C, which do not disrupt the gene itself, have also been found in patients with a similar phenotype, suggesting that disruption of MEF2C regulatory elements can also cause a Rett-like phenotype. To characterize those elements that regulate MEF2C during neural development and that are affected by these SVs, we used genomic tools coupled with both in vitro and in vivo functional assays. Through circularized chromosome conformation capture sequencing (4C-seq) and the assay for transposase-accessible chromatin using sequencing (ATAC-seq), we revealed a complex interaction network in which the MEF2C promoter physically contacts several distal enhancers that are deleted or translocated by disease-associated SVs. A total of 16 selected candidate regulatory sequences were tested for enhancer activity in vitro, with 14 found to be functional enhancers. Further analyses of their in vivo activity in zebrafish showed that each of these enhancers has a distinct activity pattern during development, with eight enhancers displaying neuronal activity. In summary, our results disentangle a complex regulatory network governing neuronal MEF2C expression that involves multiple distal enhancers. In addition, the characterized neuronal enhancers pose as novel candidates to screen for mutations in neurodevelopmental disorders, such as Rett-like syndrome.
Introduction
Myocyte enhancer factor 2C (MEF2C) is a member of the MADS (MCM1, Agamous, Deficiens, and SRF (serum response factor)) family of transcription factors. The group of MEF2 transcription factors (MEF2A, B, C and D) plays a pivotal role in regulating myriad pathways during cell differentiation and organogenesis (1). These four MEF2 genes show, in both developing and adult tissues, partially overlapping spatiotemporal expression patterns. The highest expression levels are found in striated muscles and brain (especially in cerebellum, cerebral cortex and hippocampus) (2). MEF2C is the first MEF factor to be expressed during development and plays a crucial role in muscle, heart, craniofacial and neuronal development (1). Homozygous knockout mice show embryonic lethality due to cardiovascular defects even before brain development takes off (3). However, a conditional homozygous Mef2c deletion in radial glial cells during late embryogenesis indicates an essential role in hippocampus-dependent learning and memory by suppressing the number of excitatory synapses and thereby regulating basal and evoked synaptic transmission (4).
In the context of human disease, MEF2C has primarily been associated with a severe intellectual disability syndrome that shows phenotypic overlap with Rett syndrome (severe developmental delay, absence of speech, seizures, hypotonia and stereotypic movements). The phenotypical similarities are likely caused by the involvement of MEF2C in common pathways with MECP2 and CDKL5, genes known to be involved in Rett syndrome (5,6). Both structural variants (SVs) and point mutations affecting MEF2C have been found in patients with Rett-like features (5,7–12). To date, 49 cases with a 5q14.3 microdeletion have been reported, of which the majority encompass the entire MEF2C gene. Partial gene deletions, as well as smaller intragenic deletions, duplications and point mutations, have also been described, often being associated with a slightly milder phenotype (7,9,13).
Interestingly, in addition to these aberrations directly affecting the MEF2C protein-coding sequence, several deletions and translocations in the region upstream of MEF2C have been reported in patients with Rett-like manifestations (8,13–18). Moreover, this region was recently shown to be enriched for breakpoints of balanced chromosomal abnormalities (BCAs) in a large cohort of patients with developmental anomalies (13). In total, at least nine BCA breakpoints have been reported in the region upstream of MEF2C, with some of these patients also displaying a decreased MEF2C expression (13,14,17,18). Altogether, this suggests that, in these cases in which MEF2C itself remains unaffected, the Rett-like phenotype could be attributed to the disruption of long-range interactions and local chromatin reorganization, crucial to MEF2C transcriptional regulation.
As MEF2C is an essential transcription factor, expressed in a specific spatiotemporal manner, its transcriptional regulation is complex and involves multiple tissue-specific regulatory elements (19–22). First, MEF2C contains three transcription start sites (TSSs) with variable 5′ untranslated regions within a broad promoter region. There are 11 coding exons spanning ~100 kb of genomic DNA which, due to alternative splicing, can be transcribed into 6 human transcript variants. These alternatively spliced MEF2C transcripts differ significantly in expression pattern and transactivation functions, and some of them were shown to be brain specific (5,23,24). In addition, two enhancers that direct specific expression in neuronal crest cells have been described previously (21). Despite the identification of a few regulatory elements, the examination of structural variants in the 5q14.3 region in individuals with a Rett-like syndrome suggests that additional, yet undetected, distal neuronal enhancers in the MEF2C locus could be crucial to MEF2C regulation (Fig. 1, Table 1). Therefore, a comprehensive analysis of active neuronal enhancers is required to fully elucidate the gene regulatory landscape of the MEF2C locus.
Figure 1.
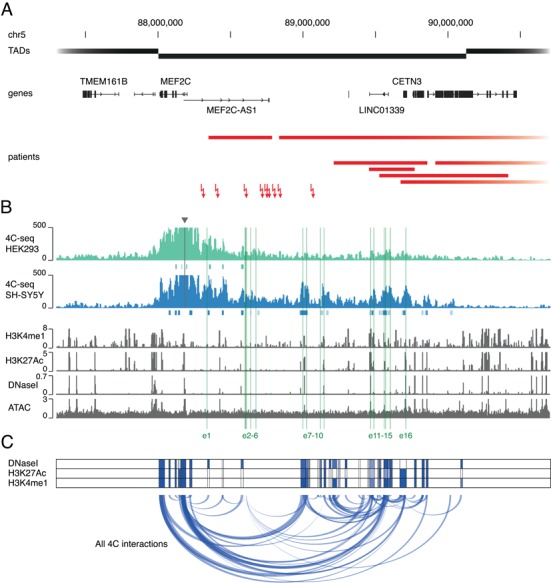
MEF2C interacts with multiple enhancer elements in its regulatory region. (A) The MEF2C locus is disrupted in patients with a Rett-like phenotype. Black boxes represent the local TAD structure, as found in the 3D Genome Browser (GM12878, 1 kb resolution) and delineate the MEF2C regulatory domain (51,52). Chromosomal abnormalities, including 11 deletions (red bars) and 9 translocations (red arrows) in patients with a Rett-like phenotype, disrupt the MEF2C regulatory region without affecting the MEF2C protein-coding sequence. (B) Chromatin interactions at the MEF2C locus determined by 4C-seq. The 4C-seq profile (RPM normalized and smoothed) from SH-SY5Y (blue) shows MEF2C promoter interactions with multiple regions in the MEF2C TAD (triangle means viewpoint location). These interactions are notably absent from the 4C interaction profile in HEK293 cells (green). 4C peaks called by the peak C algorithm are indicated below the profiles (dark blue/green is based on two biological replicates; light blue/green, based on one of two biological replicates). Shown below are publicly available ChIP-seq data for histone marks H3K27Ac and H3K4me1 in SH-SY5Y (tag count, normalized to 107 reads) (31), publicly available DNaseI-seq data for SK-N-SH (parental cell line of SH-SY5Y, read-depth normalized signal) (30) and ATAC-seq data for SH-SY5Y (RPKM normalized signal). Putative enhancer loci selected for further analyses (e1–e16) are highlighted in green. (C) MEF2C interaction network. All called 4C interactions (in SH-SY5Y) for the MEF2C promoter and all reciprocal viewpoints are plotted as transparent blue arches. Three heatmaps reflect the distance between every region in the interaction network and the nearest DNaseI, H3K27Ac and H3K4me1 mark found in multiple human neuronal cell types and brain tissues as determined through zipper plot analysis (32).
Table 1.
Structural variants in the MEF2C regulatory region.
| Location | Type | Phenotype | Reference |
|---|---|---|---|
| chr5:88412388-91996699 | Deletion | Severe ID, seizures and hypotonia | Engels et al. (2009) (8) |
| chr5:88605645-94850706 | Deletion | Developmental delay, seizures, hypotonia, macrocephaly and heterotopia | Cardoso et al. (2009) (15) |
| chr5:88833718-94826030 | Deletion | Moderate ID, severe ADHD, iris coloboma, hearing loss, dental anomaly and dysmorphic facial features | Sobreira et al. (2009) (16) |
| chr5:89909319-105901597 | Deletion | Developmental delay, cranial and facial dysmorphia, seizures, hypotonia and heterotopia | Cardoso et al. (2009) (15) |
| chr5:88232587-93437723 | Deletion | Developmental delay, seizures and hypotonia | Kaminsky et al. (2011) (25) |
| chr5:88348147-88783092 | Deletion | Developmental delay and/or other significant developmental or morphological phenotypes | Kaminsky et al. (2011) (25) |
| chr5:88377169-104022949 | Deletion | Developmental delay, seizures, heterotopia and coloboma | Kaminsky et al. (2011) (25) |
| chr5:89523963-90412409 | Deletion | Developmental delay and/or other significant developmental or morphological phenotypes | Kaminsky et al. (2011) (25) |
| chr5:89670423-127412115 | Deletion | Abnormality of cranial structures, overlapping fingers and toe and Tetralogy of Fallot | Kaminsky et al. (2011) (25) |
| chr5:89208994-89855436 | Deletion | ID and myopathy | Kaminsky et al. (2011) (25) |
| chr5:89453519-89767052 | Deletion | Abnormality of the cerebral white matter and autism | Kaminsky et al. (2011) (25) |
| chr5:88300578-88300579 | Translocation | Severe ID and seizures | Saitsu et al. (2011) (17) |
| chr5:88400843-88400848 | Inversion | Developmental delay, seizures, hypotonia and autism | Redin et al. (2017) (13) |
| chr5:88595584-88597509 | Translocation | ID | Vergult et al. (2014) (18) |
| chr5:88706882-88706887 | Translocation | ID, seizures, hypotonia and sensorineural deafness | Redin et al. (2017) (13) |
| chr5:88756256-88756239 | Translocation | Prenatal case; partial agenesis of corpus callosum and ventriculomegaly | Redin et al. (2017) (13) |
| chr5:88793025-88793026 | Translocation | Developmental delay | Redin et al. (2017) (13) |
| chr5:88742810-88742811 | Translocation | Developmental delay and autism | Floris et al. (2008) (14) |
| chr5:88829562-88829564 | Translocation | Developmental delay, seizures, hypotonia and dysmorphic facial features | Redin et al. (2017) (13) |
| chr5:89055499-89055498 | Translocation | Developmental delay, microcephaly and dysmorphic features | Redin et al. (2017) (13) |
Structural variants found in patients with Rett-like characteristics, situated in or overlapping the MEF2C TAD, without disrupting the MEF2C protein-coding sequence ID = Intellectual Disability.
To shed light on the regulatory mechanisms governing MEF2C expression and aid the interpretation of chromosomal aberrations in the MEF2C regulatory region, we (1) examined all previously reported SVs that were associated with Rett-like characteristics in the region, (2) performed circularized chromosome conformation capture sequencing (4C-seq) and the assay for transposase-accessible chromatin using sequencing (ATAC-seq) to identify interacting regulatory regions and integrated this with epigenetic enhancer marks and evolutionary conservation to delineate putative regulatory elements, (3) evaluated the enhancer activity of these elements in vitro using luciferase assays and (4) determined their in vivo activity pattern using zebrafish enhancer assays.
Results
Chromosomal aberrations compromise the MEF2C regulatory region in individuals with Rett-like syndrome
To get an overview of SVs with a putative regulatory impact in the MEF2C region, we mined the literature and variant databases in search of previously reported cases with chromosomal aberrations at 5q14.3, in which the MEF2C-coding sequence was not disrupted. We found 11 microdeletions, 8 translocations and 1 inversion in individuals exhibiting Rett-like features (global developmental delay, seizures, hypotonia, intellectual disability or other neurological abnormalities) (Fig. 1A, Table 1) (8,13–18,25). These SVs were located between 52 kb and 1.7 Mb upstream of the MEF2C TSS and deletion sizes ranged from 314 kb to 37.7 Mb. While none of them encompasses MEF2C itself, they are all situated within or overlap with the same topologically associated domain (TAD), which spans >2 Mb and contains seven genes in total. As MEF2C is situated near the left TAD boundary, its regulatory region is probably located upstream and delimited by the distal TAD boundary (Fig. 1A). Therefore, disruption of this region by the selected variants is possibly detrimental to MEF2C transcriptional regulation and could be causative for the observed Rett-like phenotype.
The MEF2C promoter region physically interacts with distal putative enhancer elements
To identify distal enhancer candidates that interact with MEF2C, we performed 4C-seq with the MEF2C promoter as bait. We captured MEF2C interactions in two cell lines with high MEF2C expression: SH-SY5Y, a human cell line often used as a neuronal model (26,27); and HEK293, a human embryonic kidney cell line, as a non-neuronal control (Supplementary Material, Fig. S1). In SH-SY5Y, the 4C profiles showed several distinct interacting regions across the entire TAD (Fig. 1B, and Supplementary Material, Fig. S2). Using the peak C algorithm, we called 14 interaction loci (28). Remarkably, these interactions were completely absent in HEK293 cells, despite a similar MEF2C expression level (Supplementary Material, Fig. S2). To find additional evidence for the presence of active regulatory elements within the interacting loci, we mapped regions of active chromatin in SH-SY5Y cells using the assay for ATAC-seq (29). We found a high degree of overlap between the 4C peaks and the ATAC signal, as well as with publicly available DNaseI-seq (30) and ChIP-seq data for enhancer-associated marks (H3K27Ac and H3K4me1) (31) (Fig. 1B and Supplementary Material, Fig. S4).
To verify the most prominent interactions identified in SH-SY5Y, we performed reverse 4C experiments using seven selected interacting regions, i.e. reciprocal viewpoints, as bait (Supplementary Material, Figs S2 and S3). The resulting 4C profiles confirmed the interaction of these reciprocal viewpoints with the MEF2C promoter region. Next, we assessed whether these interacting regions could harbor regulatory elements. Using zipper plot analysis, we determined the distance of all peaks called on SH-SY5Y 4C data sets to three epigenetic enhancer features (DNaseI hypersensitivity, H3K27Ac and H3K4me1) in human brain tissues (Supplementary Material, Fig. S5C) (32). We found that ~60–80% of called 4C peaks reside within 5 kb of these enhancer features. Moreover, when comparing the shape of 4C peak zipper plots with those of equal sets of randomly generated coordinates (within the MEF2C TAD) and in vivo validated brain enhancers (33), the 4C zippers tend much more toward the known brain enhancer zippers, suggesting that our 4C data indeed identified regions containing brain enhancer elements (Supplementary Material, Fig. S5C).
Integrating all called interactions (MEF2C promoter and all tested reciprocal viewpoints) found in SH-SY5Y, we identified 69 interaction peaks within the MEF2C TAD. Interestingly, several interacting regions seemed to be present in multiple 4C data sets. This indicates that, besides contacting the MEF2C promoter, these putative regulatory regions interact with each other as well, forming a regulatory network that contains multiple interaction nodes (Fig. 1C). The peak regions present in this network are more conserved than randomly selected intervals within the MEF2C region and are all within close proximity to enhancer marks (H3K4me1, H3K27Ac and DNaseI hypersensitivity) in the human brain (Fig. 1C, Supplementary Material, Fig. S5A and B). To conclude, the MEF2C promoter is involved in a complex interaction network, containing multiple regions, which indicates that the coordinated action of multiple enhancer elements is required for the precise spatiotemporal regulation of MEF2C.
MEF2C interacting regions harbor regulatory elements with in vitro enhancer capacity
To characterize the activity of putative enhancer elements that interact with the MEF2C promoter, we delineated 16 enhancer candidates (e1–e16), within the 7 interacting regions we validated using reverse 4C. The 16 putative enhancers were selected based on the presence of conserved sequence stretches and human brain enhancers as inferred by the ROADMAP and FANTOM consortia (Supplementary Material, Fig. S6). We tested their capacity to enhance target gene expression in vitro, in both HEK293 and SH-SY5Y cells, using luciferase assays.
In the context of HEK293 cells, 10 out of 16 tested enhancer candidates were able to significantly increase luciferase activity over a negative control vector (Fig. 2A; Supplementary Material, Fig. S7 and Tables S6–S9). However, several enhancers only marginally increased luciferase expression and one region (e12) even resulted in a significantly diminished activity. Since we selected these candidate enhancer regions based on interactions in SH-SY5Y, we hypothesized that the absence or presence of specific transcription factors could have influenced the activity of the selected elements in HEK293. Therefore, we performed the same luciferase assays in SH-SY5Y cells (Fig. 2A; Supplementary Material, Fig. S7 and Tables S6–S9).The overall activity of the candidate enhancers was higher in SH-SY5Y than in HEK293 (Fig. 2B). In total, 14 candidate enhancers significantly increased luciferase expression, with the enhancer-like CETN3 promoter region (e16) even resulting in a 57-fold increase over the control vector. Remarkably, some candidates (e.g. e4, e5, e12 and e14) even showed a radically different activity pattern in both cell lines, underscoring that a specific transcription factor repertoire could be required for the function of these enhancers. In conclusion, the majority of the selected candidates displayed enhancer capacity in in vitro enhancer assays, with in many cases a higher activity being observed in SH-SY5Y than in HEK293.
Figure 2.
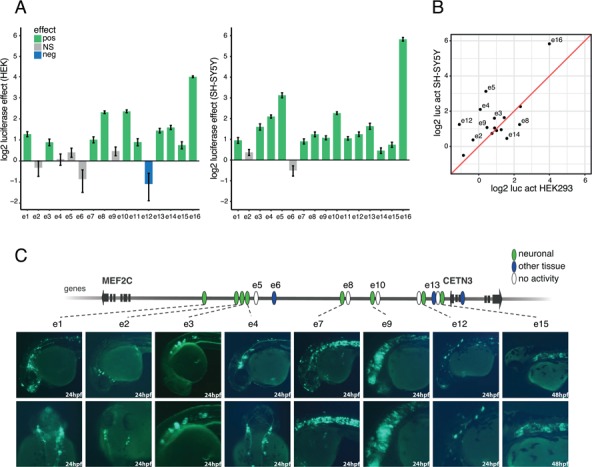
MEF2C enhancers display distinct activity patterns. (A)In vitro enhancer activity of candidate elements. Log2 luciferase activity relative to a negative control (NC) vector, in HEK293 (left) and SH-SY5Y (right), for 16 putative enhancer elements (linear mixed effects model, log2 enhancer effect fold change (FC) ± standard error). Green means significant positive effect (P < 0.01); blue, significant negative effect (P < 0.01); grey, no significant (NS) effect. (B) Enhancer activity in HEK 293 versus SH-SY5Y cells. Log2 of the relative luciferase activity in HEK293 versus SH-SY5Y cells. (C) Tissue-specific enhancers in zebrafish embryos at 24 and 48 hpf. Eight enhancers induce neuro-specific GFP expression: e1 and e2 in the forebrain and specific peripheral neurons; e3 in the middle of the notochord at 24 hpf; e4 in the forebrain, specific neurons above the eye, somitic muscles and heart; e7 in the forebrain and notochord at 24 hpf; e9 in neurons with vertical projections in the midbrain/hindbrain and spinal cord at 24 hpf e12 drove general GFP expression in the central nerve system, including the head, tail and trunk at 24 hpf; and e15 in the forebrain and notochord at 48 hpf. The color code reflects the observed activity of the 16 tested candidate enhancer elements: green means active in neuronal tissues; blue, active in other than neuronal tissues; white, not active.
MEF2C regulatory elements show in vivo neuronal enhancer activity
Next, we characterized the in vivo activity pattern of the 16 candidate enhancer elements using a zebrafish model. The enhancer candidate sequences were cloned into a zebrafish enhancer assay vector, containing an E1b minimal promoter followed by the green fluorescent protein (GFP) reporter gene (34). These vectors were microinjected into one-cell stage zebrafish embryos along with the Tol2 transposase to facilitate genomic integration. GFP expression was monitored at 24, 48 and 72 h post fertilization (hpf).
Eleven sequences showed consistent GFP expression (≥30% of GFP expressing embryos) in specific tissues (Supplementary Material, Table S4). Eight enhancers (e1, e2, e3, e4, e7, e9, e12 and e15) exhibited neuro-specific activity, in concordance with previously described Mef2c expression patterns (Fig. 2C and Supplementary Material, Fig. S8) (35,36). e1 and e2 drove GFP expression in the forebrain and specific peripheral neurons. The activity of these enhancers is specific to bilateral neurons above the eye that project along the trunk at 24, 48 and 72 hpf (Fig. 2C and Supplementary Material, Fig. S8). e3 drove GFP expression at the middle of the notochord at 24 hpf and expanded to the entire notochord at 48 and 72 hpf (Fig. 2C and Supplementary Material, Fig. S8). Not only e4 was active in the forebrain and specific neurons above the eye at 24–72 hpf, mimicking the activity of e1 and e2, but also it drove GFP expression in somitic muscles and the heart. e7 drove GFP expression in the forebrain and notochord at 48 and 72 hpf. e9 showed activity in the midbrain, hindbrain and spinal cord at 48 and 72 hpf. The enhancer is active in neurons with vertical projections in midbrain and hindbrain. e12 drove general GFP expression in the central nerve system at 24 hpf. The enhancer shows activity in the head, tail and trunk at 24–72 hpf. e15 drove specific GFP expression in the forebrain and notochord at 24 hpf that was reduced at 48 hpf and totally eliminated at 72 hpf. In addition, e6 and e13 showed specific expression in the heart at 48 hpf (Supplementary Material, Fig. S8) and the enhancer-like promoter, e16, directed expression in the epithelial of the head at 24 hpf (Supplementary Material, Fig. S8). In conclusion, the zebrafish enhancer assay identified five forebrain enhancers (e1, e2, e4, e7, e12 and e15), one mid / hindbrain enhancer (e9), three enhancers with specific activity in neurons above the eye that project to the trunk (e1, e2 and e4) and three notochord enhancers (e3, e7 and e15). Altogether, these enhancers may regulate MEF2C expression during central nervous system development.
Discussion
Previously, only a few (intragenic) MEF2C enhancers had been identified and some single, close-range interactions with the MEF2C promoter had been tested (21,37), leaving it hitherto impossible to evaluate the suspected functional impact of SVs in the MEF2C region. Here, however, we presented a first thorough overview of MEF2C interactions, enhancer elements and their activities.
Through 4C-seq in a neuronal cell line, we found that the MEF2C promoter engages in long-range interactions with several distal loci, some located as far as 2 Mb upstream and many of which are situated within open and active chromatin (determined by ATAC-seq). These interactions are notably confined to the MEF2C TAD, as reflected by the rapidly decreasing 4C coverage beyond the TAD boundaries, and do not appear to be ubiquitously present across cell lines, since they are absent in HEK293 cells. Moreover, we have shown that, similar to known brain enhancers, almost all of these interacting regions are situated in close proximity to enhancer-associated epigenetic marks identified in brain tissues. This implicates that, while we have only identified them in a neuronal model cell line, these regions also harbor active regulatory elements in true neuronal cells and tissues.
By gathering all detected interactions in the MEF2C locus, it becomes clear that several enhancer loci interact not only with the MEF2C promoter but also with other enhancer regions and promoters within the TAD. For instance, the region that encompasses neuronal enhancer e7 interacts with both the MEF2C promoter and putative enhancers e11–e15. In this way, a MEF2C interaction network is revealed, comprising the MEF2C promoter, multiple distal sites harboring validated neuronal enhancers and other putative regulatory elements such as the enhancer-like promoter of CETN3. This network greatly extends upon previously identified regulatory interactions in the proximal region upstream of MEF2C (37). Although this interaction network is yet to be fully completed, it clearly suggests that the MEF2C promoter is involved in a complex chromatin organization, probably required for the precise regulation of MEF2C.
The majority of the selected interacting enhancer regions show in vitro enhancer activity. Interestingly, we observed clear differences in their activities between a neuronal and non-neuronal cell line, suggesting that a specific transcription factor repertoire is required for enhancer activity. Further research will be necessary to identify the transcription factors essential for the activity of the selected enhancers in neuronal cells. Eleven enhancers display distinct activity patterns (eight neuronal and three non-neuronal) during zebrafish development. Together, these might regulate MEF2C transcription in a specific spatiotemporal manner. However, several enhancers also show overlapping activity (e.g. e1, e2, e4, e7 and e12 are active in the forebrain), probably ensuring a robust MEF2C expression, essential to normal development. Further investigation will be required to elucidate the exact mode of action of these enhancers. Not all of the tested enhancer candidates were found to be active, although it is likely that a few of them are active but were not detected due to the use of a generic minimal promoter (e.g. e1b promoter for zebrafish) or because these sequences were taken out of context. Nevertheless, the identification of these neuronal MEF2C enhancers should provide a starting point to assess the functional implications of aberrations in the MEF2C region. Four elements (e8, e13, e15 and e16) were already included in a targeted screen for damaging de novo mutations in 6000 exome-negative patients with developmental disorders (38). Although only a small fraction (0.15%) of de novo enhancer mutations cause neurodevelopmental disorders through a dominant mechanism, the enhancers we identified should be a valuable addition to such screens as they have similar characteristics (conserved and with neuronal activity) as enhancers that were shown to be enriched in damaging de novo mutations (38).
Hitherto, at least 20 SVs affecting the MEF2C regulatory region without disrupting MEF2C have been described in the literature or are present in variant databases. Clinical features often include developmental delay, seizures, hypotonia, intellectual disability and characteristics they have in common with the previously described Rett-like MEF2C syndrome. We found deletions ranging from 314 kb to 37.7 Mb, some falling completely within the MEF2C TAD, some crossing the TAD boundary, extending for megabases upstream of MEF2C and comprising several other genes and putative regulatory elements. Although, for these very large deletions, deletion of other genes probably contributes to the aberrant phenotype, also for the smaller deletions and balanced aberrations we could not find a correlation between the severity of the reported phenotype and the number of deleted or translocated enhancers. However, as most translocation breakpoints are situated in the region between e6 and e7, it appears that the presence of the more proximal enhancers alone is not sufficient for correct MEF2C regulation and that the distal region contains some crucial neuronal enhancers. Moreover, some smaller deletions contain only a few enhancers, suggesting that the entire regulatory region is probably required for correct MEF2C regulation.
In summary, MEF2C has a pivotal role in neuronal development and MEF2C haploinsufficiency manifests as a Rett-like syndrome featured by severe intellectual disability, seizures and stereotypic movements. The MEF2C promoter interacts with multiple distal neuronal enhancers in its upstream region and the disruption of these interactions by chromosomal abnormalities could lead to haploinsufficiency in early brain development and result in a similar phenotypic outcome as MEF2C coding mutations.
Materials and Methods
Cell culture
All cell lines were cultured in complete RPMI 1640 medium (FBS, 10%; P/S, 1%; glutamine, 1%; kanamycine, 1%). Cells were passaged every 3–4 days. We allowed at least two passages before using cells in experiments.
RNA isolation, cDNA synthesis and quantitative PCR
Total RNA was extracted using TRIzol (Invitrogen #15596026; Thermo Fisher Scientific, Waltham, MA, USA) and the RNAeasy kit (Qiagen #217004; Qiagen, Venlo, The Netherlands). Complementary DNA (cDNA) synthesis was performed using the iScript cDNA synthesis kit (Bio-Rad #170-8891; Bio-Rad, Hercules, California, USA). Quantitative polymerase chain reaction (qPCR) was performed using 2× SYBR Green SsoAdvanced Supermix (Bio-Rad #172-5274) with 5 μm forward and reverse primer and 5 ng cDNA input. Expression values were analyzed using qBase + software (Biogazelle, Ghent, Belgium) and normalized using three reference genes (GAPDH, SDHA and UBC). All primer sequences can be found in Supplementary Material, Table S5.
Preparation of 4C templates and sequencing libraries
The 4C templates were prepared according to the protocol by Van de Werken et al. (39). In brief, for each template 1 × 10⁷ cells were detached, counted, resuspended and cross-linked by incubating them with 2% formaldehyde for 10 min at room temperature. Following cell lysis, cross-linked DNA was digested with 400U of DpnII restriction enzyme (NEB #R0543L; NEB, Ipswich, Massachusetts, USA) and nearby DNA fragments were ligated using 50U of T4 DNA ligase (Roche #10799009001; Merck, Darmstadt, Germany). Ligated DNA circles were de-cross-linked overnight using proteinase K and purified with NucleoMag P-Beads (Macherey-Nagel, Düren, Germany) to obtain an intermediate 3C template. A second round of digestion and ligation, using 50U of Csp6I restriction enzyme (Thermo Scientific #ER0211; Thermo Fisher Scientific, Waltham, MA, USA), resulted in 4C templates.
Adaptor-containing reading and non-reading primers, specific to the viewpoints of interest, were designed to amplify all captured, interacting DNA fragments (Supplementary Material, Tables S1 and S2) (39). For each viewpoint, 16 PCR reactions, each using 200 ng of input 4C template, were pooled. Resulting 4C-sequencing libraries were purified using High Pure PCR Product Purification kit (Roche #11732676001) and QIAquick PCR Purification kit (Qiagen #28106).
4C sequencing and analysis
Approximately 15 to 20 different 4C sequencing libraries were pooled and sequenced simultaneously on an Illumina NextSeq 500 (single-end, 75 nt, loading concentration 1.6 pM). Sequencing libraries were demultiplexed based on the presence of the viewpoint-specific reading primer sequence, which precedes the captured DNA sequence. Following removal of these reading primer prefixes, captured sequences were mapped to the hg19 reference genome using Bowtie2 (40). For the cis chromosome, mapped read counts were summarized per DpnII restriction fragment. Finally, 4C coverage profiles were obtained by normalizing the per fragment coverage to reads per million (RPM) on the cis chromosome and smoothing the normalized coverage using the rollmean function from the R ‘zoo’ package with a window size of 21 fragments (41). 4C peaks were called using the peak C algorithm (28), based on two biological replicates, except for reciprocal viewpoint 2 for which only one replicate was available. The parameter settings used were wSize = 21, alphaFDR = 0.2 and qW = 0.5.
4C peak conservation
PhastCons conservation scores for chromosome 5 were retrieved from University of California Santa Cruz (UCSC; http://genome.ucsc.edu/) (42,43). These scores were used to calculate an average conservation score per nucleotide in 4 kb windows surrounding all called 4C peak centers and 1000 random coordinates within the MEF2C TAD (chr5:87300000-90700000, hg19).
4C peak zipper plot analyses
We used zipper plots (32) to evaluate the overlap of our set of SH-SY5Y 4C peaks with data for enhancer-associated epigenetic marks generated by the ROADMAP Epigenomics Consortium (44). Zipper plots provide a visual way of assessing the proximity of loci of interest to a wide range of epigenetic features in a multitude of tissues, by tapping into publicly available data from the FANTOM (45) and ROADMAP consortia. We used all 69 SH-SY5Y 4C peaks as input and queried enhancer marks, H3K4me1, H3K27Ac and DNaseI hypersensitivity, identified by the ROADMAP consortium in multiple human neuronal cell types or brain tissues. The samples included were cortex derived primary cultured neurospheres, ganglion eminence derived primary cultured neurospheres, brain angular gyrus, brain anterior caudate, brain cingulate gyrus, brain germinal matrix, brain hippocampus middle, brain inferior temporal lobe, brain dorsolateral pre-frontal cortex, brain substantia nigra, fetal brain male and fetal brain female. The same zipper plot analysis was performed for an equally large set of random coordinates within the MEF2C TAD (chr5:87300000-90700000, hg19, seed set to 1) and in vivo validated brain enhancers from the VISTA Enhancer Browser (33).
Assay for ATAC-seq
ATAC-seq was performed as previously described with minor changes (29). In short, 50 000 cells were lysed and fragmented using 1% digitonin and Tn5 transposase (Illumina, San Diego, California, USA). Next, the samples were purified using the MinElute kit (Qiagen). The transposased DNA fragments were amplified using 13 PCR cycles and purified using Agencourt AMPure XP beads (Beckman Coulter, Brea, California, USA). ATAC-seq libraries were paired-end sequenced on the NextSeq 500 platform (Illumina) using the Nextseq 500 High Output kit V2 150 cycles (Illumina). The ATAC files were aligned to the human reference genome (hg19) using STAR (46) with default parameters and blacklisted genomic regions were excluded. ATAC-seq peaks were called using MACS2 with parameters –nomodel and –nolambda. The overlap of these peaks with enhancer marks in SH-SY5Y cells (H3K4me1 and H3K27Ac) and brain tissues (DNaseI, H3K27Ac and H3K4me1) was determined using deepTools’ plotHeatmap function and zipper plots, respectively (32,47).
Enhancer region delineation
We narrowed down enhancer regions for further characterization based on conservation and/or the presence of predicted enhancer elements by the ROADMAP or FANTOM consortium (42,44,48). PhastCons conservation scores, enhancer elements called by the FANTOM consortium through CAGE-seq and chromatin state segmentation for 11 neuronal cell lines or brain tissues by the ROADMAP consortium, were accessed through the UCSC genome browser (43).
Luciferase enhancer assays
Selected, putative enhancer sequences (Supplementary Material, Table S3) were amplified from human genomic DNA (Roche #11691112001) and subsequently cloned into the pGL4.24 firefly luciferase reporter vector (Promega #E8421; Promega, Madison, Wisconsin, USA) using either standard restriction ligation cloning or Gibson Assembly (NEB #E2611L). The constructed enhancer luciferase vectors (100 ng) were cotransfected with the Renilla luciferase control vector pRL-TK (5 ng, Promega #E2241) in HEK293 cells (96-well format, seeding density 10 000 cells/well, 24 h pre-transfection) using 0.3 μl lipofectamine 3000 (Thermo Fisher #L3000001) per well. For transfection of vectors into SH-SY5Y, we used either 0.5 μl lipofectamine 3000 (96-well format, seeding density 25 000 cells/well, 24 h pre-transfection) or Neon nucleofection (Thermo Fisher #MPK10025) (96-well format, seeding 60 000 transfected cells per well). Each experiment was at least performed in triplicate with six technical replicates per experiment. Enhancer activity was determined 24 h post transfection using a Dual-Luciferase Reporter Assay (Promega #E1910). Replicates for which the signal did not exceed background (less than two standard deviations above the mean background) were filtered out and excluded from the analysis. Firefly luciferase activity per well was normalized to Renilla luciferase activity. A negative control luciferase vector with a ~1500 bp insert was used as reference. For each candidate enhancer, we determined the effect on luciferase activity using a linear mixed effects model (R ‘lme4’ package (49)) with luciferase vector as fixed and biological replicate as random effect. P-values were obtained by likelihood ratio tests of the model with the fixed effect against a null model without this effect.
Transgenic zebrafish enhancer assays
Primers were designed to amplify the candidate enhancer sequences from human genomic DNA (Supplementary Material, Table S3). PCR products were cloned into the E1b-GFP-Tol2 enhancer assay vector containing an E1b minimal promoter followed by GFP (34). These constructs were injected to zebrafish embryos using standard procedures. For statistical significance, at least 100 embryos were injected per construct in at least two different injection experiments along with Tol2 mRNA to facilitate genomic integration (50). GFP expression was observed and annotated at 24, 48 and 72 hpf (Supplementary Material, Table S4). An enhancer was considered a positive enhancer when 30% of the alive embryos showed a consistent GFP expression pattern.
Data availability
The 4C data reported in this paper was deposited in NCBI’s Gene Expression Omnibus (GEO) with accession number GSE121549 (http://www.ncbi.nlm.nih.gov/geo/query/acc.cgi?acc=GSE121549).
Funding
This research was supported by the Research Foundation Flanders (FWO) under grant G044615N and 1520518N, the Bi-National Science Foundation (2013288), Brain and Behavior Research Foundation (22893), CURE epilepsy foundation, and Marie Curie integration grant (630849). ED and SV are respectively supported by a doctoral and postdoctoral fellowship of the Research Foundation Flanders (FWO). FAC and KV are supported by a Special Research Fund (BOF) doctoral scholarship of Ghent University (respectively BOF.DOC.2017.0026.01 and BOF15/DOC/220). RYB is supported, in part, by a Marie Curie integration grant (630849).
Author contributions
E.D., R.B.Y., I.B., B.M., R.Y.B. and S.V. conceived and designed the experiments. E.D., R.B.Y., I.B., L.V., S.V.L., R.E. and R.A. performed the experiments. E.D., R.B.Y., R.Y.B. and S.V. analyzed the data. F.A.C. performed zipper plot analyses. K.V. performed ATAC-seq. E.D., R.B.Y., R.Y.B. and S.V. wrote the paper. All authors critically reviewed the manuscript and approved the final version.
Supplementary Material
References
- 1. Potthoff M.J. and Olson E.N. (2007) MEF2: a central regulator of diverse developmental programs. Development, 134, 4131–4140. [DOI] [PubMed] [Google Scholar]
- 2. Edmondson D.G., Lyons G.E., Martin J.F. and Olson E.N. (1994) Mef2 gene expression marks the cardiac and skeletal muscle lineages during mouse embryogenesis. Development, 120, 1251–1263. [DOI] [PubMed] [Google Scholar]
- 3. Lin Q., Schwarz J., Bucana C. and Olson E.N. (1997) Control of mouse cardiac morphogenesis and myogenesis by transcription factor MEF2C. Science, 276, 1404–1407. [DOI] [PMC free article] [PubMed] [Google Scholar]
- 4. Barbosa A.C., Kim M.-S., Ertunc M., Adachi M., Nelson E.D., McAnally J., Richardson J.A., Kavalali E.T., Monteggia L.M., Bassel-Duby R. et al. (2008) MEF2C, a transcription factor that facilitates learning and memory by negative regulation of synapse numbers and function. Proc. Natl. Acad. Sci. U. S. A., 105, 9391–9396. [DOI] [PMC free article] [PubMed] [Google Scholar]
- 5. Zweier M., Gregor A., Zweier C., Engels H., Sticht H., Wohlleber E., Bijlsma E.K., Holder S.E., Zenker M., Rossier E. et al. (2010) Mutations in MEF2C from the 5q14.3q15 microdeletion syndrome region are a frequent cause of severe mental retardation and diminish MECP2 and CDKL5 expression. Hum. Mutat., 31, 722–733. [DOI] [PubMed] [Google Scholar]
- 6. Vidal S., Brandi N., Pacheco P., Gerotina E., Blasco L., Trotta J.-R., Derdak S., Mar O’Callaghan M., Garcia-Cazorla À., Pineda M. et al. (2017) The utility of next generation sequencing for molecular diagnostics in Rett syndrome. Sci. Rep., 7, 12288. [DOI] [PMC free article] [PubMed] [Google Scholar]
- 7. Vrečar I., Innes J., Jones E., Kingston H., Reardon W., Kerr B., Clayton-Smith J. and Douzgou S. (2017) Further clinical delineation of the MEF2C haploinsufficiency syndrome: report on new cases and literature review of severe neurodevelopmental disorders presenting with seizures, absent speech, and involuntary movements. J. Pediatr. Genet., 6, 129–141. [DOI] [PMC free article] [PubMed] [Google Scholar]
- 8. Engels H., Wohlleber E., Zink A., Hoyer J., Ludwig K.U., Brockschmidt F.F., Wieczorek D., Moog U., Hellmann-Mersch B., Weber R.G. et al. (2009) A novel microdeletion syndrome involving 5q14.3-q15: clinical and molecular cytogenetic characterization of three patients. Eur. J. Hum. Genet., 17, 1592–1599. [DOI] [PMC free article] [PubMed] [Google Scholar]
- 9. Rocha H., Sampaio M., Rocha R., Fernandes S. and Leão M. (2016) MEF2C haploinsufficiency syndrome: report of a new MEF2C mutation and review. Eur. J. Med. Genet., 59, 478–482. [DOI] [PubMed] [Google Scholar]
- 10. Cesaretti C., Spaccini L., Righini A., Parazzini C., Conte G., Crosti F., Redaelli S., Bulfamante G., Avagliano L. and Rustico M. (2016) Prenatal detection of 5q14.3 duplication including MEF2C and brain phenotype. Am. J. Med. Genet. A, 170, 1352–1357. [DOI] [PubMed] [Google Scholar]
- 11. Lambert L., Bienvenu T., Allou L., Valduga M., Echenne B., Diebold B., Mignot C., Héron D., Roth V., Saunier A. et al. (2012) MEF2C mutations are a rare cause of Rett or severe Rett-like encephalopathies. Clin. Genet., 82, 499–501. [DOI] [PubMed] [Google Scholar]
- 12. Le Meur N., Holder-Espinasse M., Jaillard S., Goldenberg A., Joriot S., Amati-Bonneau P., Guichet A., Barth M., Charollais A., Journel H. et al. (2010) MEF2C haploinsufficiency caused by either microdeletion of the 5q14.3 region or mutation is responsible for severe mental retardation with stereotypic movements, epilepsy and/or cerebral malformations. J. Med. Genet., 47, 22–29. [DOI] [PMC free article] [PubMed] [Google Scholar]
- 13. Redin C., Brand H., Collins R.L., Kammin T., Mitchell E., Hodge J.C., Hanscom C., Pillalamarri V., Seabra C.M., Abbott M.-A. et al. (2017) The genomic landscape of balanced cytogenetic abnormalities associated with human congenital anomalies. Nat. Genet., 49, 36–45. [DOI] [PMC free article] [PubMed] [Google Scholar]
- 14. Floris C., Rassu S., Boccone L., Gasperini D., Cao A. and Crisponi L. (2008) Two patients with balanced translocations and autistic disorder: CSMD3 as a candidate gene for autism found in their common 8q23 breakpoint area. Eur. J. Hum. Genet., 16, 696–704. [DOI] [PubMed] [Google Scholar]
- 15. Cardoso C., Boys A., Parrini E., Mignon-Ravix C., McMahon J.M., Khantane S., Bertini E., Pallesi E., Missirian C., Zuffardi O. et al. (2009) Periventricular heterotopia, mental retardation, and epilepsy associated with 5q14.3-q15 deletion. Neurology, 72, 784–792. [DOI] [PubMed] [Google Scholar]
- 16. Sobreira N., Walsh M.F., Batista D. and Wang T. (2009) Interstitial deletion 5q14.3-q21 associated with iris coloboma, hearing loss, dental anomaly, moderate intellectual disability, and attention deficit and hyperactivity disorder. Am. J. Med. Genet. A, 149A, 2581–2583. [DOI] [PMC free article] [PubMed] [Google Scholar]
- 17. Saitsu H., Igarashi N., Kato M., Okada I., Kosho T., Shimokawa O., Sasaki Y., Nishiyama K., Tsurusaki Y., Doi H. et al. (2011) De novo 5q14.3 translocation 121.5-kb upstream of MEF2C in a patient with severe intellectual disability and early-onset epileptic encephalopathy. Am. J. Med. Genet. A, 155, 2879–2884. [DOI] [PubMed] [Google Scholar]
- 18. Vergult S., Van Binsbergen E., Sante T., Nowak S., Vanakker O., Claes K., Poppe B., Van der Aa N., Roosmalen M.J., Duran K. et al. (2014) Mate pair sequencing for the detection of chromosomal aberrations in patients with intellectual disability and congenital malformations. Eur. J. Hum. Genet., 22, 652–659. [DOI] [PMC free article] [PubMed] [Google Scholar]
- 19. De Val S., Anderson J.P., Heidt A.B., Khiem D., Xu S.-M. and Black B.L. (2004) Mef2c is activated directly by Ets transcription factors through an evolutionarily conserved endothelial cell-specific enhancer. Dev. Biol., 275, 424–434. [DOI] [PubMed] [Google Scholar]
- 20. Dodou E., Verzi M.P., Anderson J.P., Xu S.-M. and Black B.L. (2004) Mef2c is a direct transcriptional target of ISL1 and GATA factors in the anterior heart field during mouse embryonic development. Development, 131, 3931–3942. [DOI] [PubMed] [Google Scholar]
- 21. De Val S., Chi N.C., Meadows S.M., Minovitsky S., Anderson J.P., Harris I.S., Ehlers M.L., Agarwal P., Visel A., Xu S.-M. et al. (2008) Combinatorial regulation of endothelial gene expression by Ets and Forkhead transcription factors. Cell, 135, 1053–1064. [DOI] [PMC free article] [PubMed] [Google Scholar]
- 22. Dodou E., Xu S.-M. and Black B.L. (2003) MEF2c is activated directly by myogenic basic helix-loop-helix proteins during skeletal muscle development in vivo. Mech. Dev., 120, 1021–1032. [DOI] [PubMed] [Google Scholar]
- 23. Janson C.G., Chen Y., Li Y. and Leifer D. (2001) Functional regulatory regions of human transcription factor MEF2C. Brain Res. Mol. Brain Res., 97, 70–82. [DOI] [PubMed] [Google Scholar]
- 24. Leifer D., Golden J. and Kowall N.W. (1994) Myocyte-specific enhancer binding factor 2C expression in human brain development. Neuroscience, 63, 1067–1079. [DOI] [PubMed] [Google Scholar]
- 25. Kaminsky E.B., Kaul V., Paschall J., Church D.M., Bunke B., Kunig D., Moreno-De-Luca D., Moreno-De-Luca A., Mulle J.G., Warren S.T. et al. (2011) An evidence-based approach to establish the functional and clinical significance of CNVs in intellectual and developmental disabilities. Genet. Med., 13, 777–784. [DOI] [PMC free article] [PubMed] [Google Scholar]
- 26. Xicoy H., Wieringa B. and Martens G.J.M. (2017) The SH-SY5Y cell line in Parkinson’s disease research: a systematic review. Mol. Neurodegener., 12, 10. [DOI] [PMC free article] [PubMed] [Google Scholar]
- 27. Kovalevich J. and Langford D. (2013) Considerations for the use of SH-SY5Y neuroblastoma cells in neurobiology. Methods Mol. Biol., 1078, 9–21. [DOI] [PMC free article] [PubMed] [Google Scholar]
- 28. Wit E., Vos E.S.M., Holwerda S.J.B., Valdes-Quezada C., Verstegen M.J.A.M., Teunissen H., Splinter E., Wijchers P.J., Krijger P.H.L. and Laat W. (2015) CTCF binding polarity determines chromatin looping. Mol. Cell, 60, 676–684. [DOI] [PubMed] [Google Scholar]
- 29. Buenrostro J.D., Wu B., Y C.,.H.Y. and Greenleaf, W.J. (2015) ATAC-seq: a method for assaying chromatin accessibility genome-wide. Curr. Protoc. Mol. Biol., 109, 21.29.1–21.29.9. [DOI] [PMC free article] [PubMed] [Google Scholar]
- 30. Polak P., Lawrence M.S., Haugen E., Stoletzki N., Stojanov P., Thurman R.E., Garraway L.A., Mirkin S., Getz G., Stamatoyannopoulos J.A. et al. (2014) Reduced local mutation density in regulatory DNA of cancer genomes is linked to DNA repair. Nat. Biotechnol., 32, 71–75. [DOI] [PMC free article] [PubMed] [Google Scholar]
- 31. Henrich K.-O., Bender S., Saadati M., Dreidax D., Gartlgruber M., Shao C., Herrmann C., Wiesenfarth M., Parzonka M., Wehrmann L. et al. (2016) Integrative genome-scale analysis identifies epigenetic mechanisms of transcriptional deregulation in unfavorable neuroblastomas. Cancer Res., 76, 5523–5537. [DOI] [PubMed] [Google Scholar]
- 32. Avila Cobos F., Anckaert J., Volders P.-J., Everaert C., Rombaut D., Vandesompele J., De Preter K. and Mestdagh P. (2017) Zipper plot: visualizing transcriptional activity of genomic regions. BMC Bioinformatics, 18, 231. [DOI] [PMC free article] [PubMed] [Google Scholar]
- 33. Visel A., Minovitsky S., Dubchak I. and Pennacchio L.A. (2007) VISTA enhancer browser—a database of tissue-specific human enhancers. Nucleic Acids Res., 35, D88–D92. [DOI] [PMC free article] [PubMed] [Google Scholar]
- 34. Li Q., Ritter D., Yang N., Dong Z., Li H., Chuang J.H. and Guo S. (2010) A systematic approach to identify functional motifs within vertebrate developmental enhancers. Dev. Biol., 337, 484–495. [DOI] [PMC free article] [PubMed] [Google Scholar]
- 35. Kudoh T. (2001) A gene expression screen in zebrafish embryogenesis. Genome Res., 11, 1979–1987. [DOI] [PubMed] [Google Scholar]
- 36. Hammond D.R. and Udvadia A.J. (2010) Cabin1 expression suggests roles in neuronal development. Dev. Dyn., 239, 2443–2451. [DOI] [PubMed] [Google Scholar]
- 37. Mitchell A.C., Javidfar B., Pothula V., Ibi D., Shen E.Y., Peter C.J., Bicks L.K., Fehr T., Jiang Y., Brennand K.J. et al. (2017) MEF2C transcription factor is associated with the genetic and epigenetic risk architecture of schizophrenia and improves cognition in mice. Mol. Psychiatry, 23, 123–132. [DOI] [PMC free article] [PubMed] [Google Scholar]
- 38. Short P.J., McRae J.F., Gallone G., Sifrim A., Won H., Geschwind D.H., Wright C.F., Firth H.V., FitzPatrick D.R., Barrett J.C. et al. (2018) De novo mutations in regulatory elements in neurodevelopmental disorders. Nature, 555, 611–616. [DOI] [PMC free article] [PubMed] [Google Scholar]
- 39. Werken H.J.G., Vree P.J.P., Splinter E., Holwerda S.J.B., Klous P., Wit E. and Laat W. (2012) 4C Technology: protocols and data analysis. Methods Enzymol ., 593, 89–112. [DOI] [PubMed] [Google Scholar]
- 40. Langmead B. and Salzberg S.L. (2012) Fast gapped-read alignment with Bowtie 2. Nat. Methods, 9, 357–359. [DOI] [PMC free article] [PubMed] [Google Scholar]
- 41. Zeileis A. and Grothendieck G. (2005) zoo: S3 infrastructure for regular and irregular time series. J. Stat. Softw., 14, 1–27. [Google Scholar]
- 42. Siepel A., Bejerano G., Pedersen J.S., Hinrichs A.S., Hou M., Rosenbloom K., Clawson H., Spieth J., Hillier L.W., Richards S. et al. (2005) Evolutionarily conserved elements in vertebrate, insect, worm, and yeast genomes. Genome Res., 15, 1034–1050. [DOI] [PMC free article] [PubMed] [Google Scholar]
- 43. Tyner C., Barber G.P., Casper J., Clawson H., Diekhans M., Eisenhart C., Fischer C.M., Gibson D., Gonzalez J.N., Guruvadoo L. et al. (2017) The UCSC Genome Browser database: 2017 update. Nucleic Acids Res., 45, D626–D634. [DOI] [PMC free article] [PubMed] [Google Scholar]
- 44. Kundaje A., Meuleman W., Ernst J., Bilenky M., Yen A., Heravi-Moussavi A., Kheradpour P., Zhang Z., Wang J., Ziller M.J. et al. (2015) Integrative analysis of 111 reference human epigenomes. Nature, 518, 317–330. [DOI] [PMC free article] [PubMed] [Google Scholar]
- 45. The Fantom Consortium (2014) A promoter-level mammalian expression atlas. Nature, 507, 462–470. [DOI] [PMC free article] [PubMed] [Google Scholar]
- 46. Dobin A., Davis C.A., Schlesinger F., Drenkow J., Zaleski C., Jha S., Batut P., Chaisson M. and Gingeras T.R. (2013) STAR: ultrafast universal RNA-seq aligner. Bioinformatics, 29, 15–21. [DOI] [PMC free article] [PubMed] [Google Scholar]
- 47. Ramírez F., Ryan D.P., Grüning B., Bhardwaj V., Kilpert F., Richter A.S., Heyne S., Dündar F. and Manke T. (2016) deepTools2: a next generation web server for deep-sequencing data analysis. Nucleic Acids Res., 44, W160–W165. [DOI] [PMC free article] [PubMed] [Google Scholar]
- 48. Andersson R., Gebhard C., Miguel-Escalada I., Hoof I., Bornholdt J., Boyd M., Chen Y., Zhao X., Schmidl C., Suzuki T. et al. (2014) An atlas of active enhancers across human cell types and tissues. Nature, 507, 455–461. [DOI] [PMC free article] [PubMed] [Google Scholar]
- 49. Bates D., Mächler M., Bolker B. and Walker S. (2015) Fitting linear mixed-effects models using lme4. J. Stat. Softw., 67, 1–48. [Google Scholar]
- 50. Kawakami K. (2005) Transposon tools and methods in zebrafish. Dev. Dyn., 234, 244–254. [DOI] [PubMed] [Google Scholar]
- 51. Rao S.S.P., Huntley M.H., Durand N.C., Stamenova E.K., Bochkov I.D., Robinson J.T., Sanborn A.L., Machol I., Omer A.D., Lander E.S. et al. (2014) A 3D map of the human genome at kilobase resolution reveals principles of chromatin looping. Cell, 159, 1665–1680. [DOI] [PMC free article] [PubMed] [Google Scholar]
- 52. Wang Y., Song F., Zhang B., Zhang L., Xu J., Kuang D., Li D., Choudhary M.N.K., Li Y., Hu M. et al. (2018) The 3D Genome Browser: a web-based browser for visualizing 3D genome organization and long-range chromatin interactions. Genome Biol., 19, 151. [DOI] [PMC free article] [PubMed] [Google Scholar]
Associated Data
This section collects any data citations, data availability statements, or supplementary materials included in this article.
Supplementary Materials
Data Availability Statement
The 4C data reported in this paper was deposited in NCBI’s Gene Expression Omnibus (GEO) with accession number GSE121549 (http://www.ncbi.nlm.nih.gov/geo/query/acc.cgi?acc=GSE121549).