

Abstract
The mammary gland undergoes fast cell proliferation during early pregnancy, yet the mechanism to ensure genome integrity during this highly proliferative stage is largely unknown. We show that pregnancy triggers replicative stresses leading to genetic instability in mice carrying a mammary specific disruption of breast cancer associated gene-1 (BRCA1). The fast cell proliferation was correlated with enhanced expression of most genes encoding replisomes, which are positively regulated by estrogen/ERα signaling but negatively regulated by BRCA1. Our further analysis revealed two parallel signaling pathways, which are mediated by ATR–CHK1 and WEE1–MCM2 and are responsible for regulating DNA replication checkpoint. Upon DNA damage, BRCA1 deficiency markedly enhances DNA replication initiation and preferably impairs DNA replication checkpoint mediated by ATR and CHK1. Meanwhile, DNA damage also activates WEE1–MCM2 signaling, which inhibits DNA replication initiation and enables BRCA1-deficient cells to avoid further genomic instability. Finally, we demonstrated that overriding this defense by WEE1 inhibition in combination with cisplatin, which causes DNA damage, serves as a promising therapeutic approach for killing BRCA1-deficient cancer cells.
Introduction
Pregnancy is a physiological process in which a new life develops and the maternal tissues undergo changes to support fetal growth. During pregnancy, mammary cells undergo developmental progression, including ductal elongation, terminal end bud formation, branching morphogenesis and alveolar development, leading to the formation of a fully functional mammary gland (1–3). In earlier stages of pregnancy, mammary cells undergo rapid proliferation, whereas at later stages, cells mainly undergo differentiation while their proliferation rate gradually decreases (1–3). Many factors, including growth factors, hormones, components of extracellular matrix and cytokines, play essential roles in the normal development of the mammary gland (1,4–9). Yet, the precise role of each of these factors and their coordinated actions remain elusive.
Breast cancer-associated gene-1 (BRCA1) is known for its role in suppressing breast carcinogenesis. It has been estimated that loss of function mutations in BRCA1 contributes to approximately one-third of all familial breast cancer cases and most of combined familial breast/ovarian cancers (10–14). Expression of the mouse BRCA1 gene is induced during proliferation stages of mammary gland development and gradually decreases at differentiation stages (15), suggesting a role of BRCA1 in mammary gland development. Consistently, a functional study in a mouse model that carries a mammary tissue-specific deletion of full-length BRCA1 mediated by the Cre–LoxP approach (Brca1Co/Co;MMTV-Cre) indicates that BRCA1 deficiency causes impaired mammary gland development characterized by blunted ductal morphogenesis and increased apoptosis (16). Brca1 Co/Co;MMTV-Cre mice start to develop mammary tumors at ~9 months of age, and tumor incidence reaches ~25% by 1.5 year of age (17–19). Tumors exhibit extensive genetic instability leading to the activation of oncogenes and inactivation of tumor suppressor genes, including p53 (17,18). Meanwhile, tumorigenesis in BRCA1 mutant mice is sensitive to levels of estrogen in that exposure to exogenous estrogen increases, whereas oophorectomy decreases, cancer risk (20,21). Cells isolated from BRCA1 mutant mice also display multiple cellular defects in culture, such as reduced cell proliferation, abnormal centrosome duplication, increased DNA damage, impaired homologous recombination and defective cell cycle checkpoints (17,22–27).
In the present study, we have studied the function of BRCA1 in the mammary gland development during pregnancy. Because early pregnancy is associated with fast cell proliferation and quick expansion of mammary epithelia cells (1–3), we assume that such events may produce replicative stress and cast a huge pressure on the DNA damage repair system. Thus, we hypothesize that pregnancy may induce DNA damage by markedly increasing cell proliferation and that increased BRCA1 expression is required to modulate the resulting replicative stress and maintain genome integrity. Using the Brca1Co/Co;MMTV-Cre mice (16), we have tested this hypothesis. The data uncover coordinated actions among E2/ERα signaling, BRCA1 and WEE1 in regulating initiation of DNA replication and facilitating fast proliferation of mammary cells while maintaining genome integrity.
Results
BRCA1 deficiency enhances BrdU incorporation in S phase and leads to miscoordination of cell cycle progression during pregnancy
To study potential effect of BRCA1 on mammary gland development, we first counted the total number of mammary epithelial cells in Brca1Co/Co;MMTV-Cre (MT) mice and Brca1+/+;MMTV-Cre (WT) mice (16) at various time points during pregnancy. We detected a fast increase in cell numbers in both WT and MT glands; however, the total number of epithelial cells was lower in MT glands than in WT glands at all stages studied (Fig. 1A). Next, we examined the proliferation status of mammary epithelial cells by injecting pregnant females with a pulse of BrdU and harvesting mammary glands 2 h later. Fluorescence activation cell sorting (FACS) analysis detected an increased abundance of BrdU+ cells (Fig. 1B) and a higher intensity of BrdU staining per cell in MT glands than in WT glands (Fig. 1C). Staining histological sections with an antibody directed against BrdU confirmed that MT mammary epithelium contained significantly higher percentage of BrdU+ cells than WT epithelium (Fig. 1D).
Figure 1.
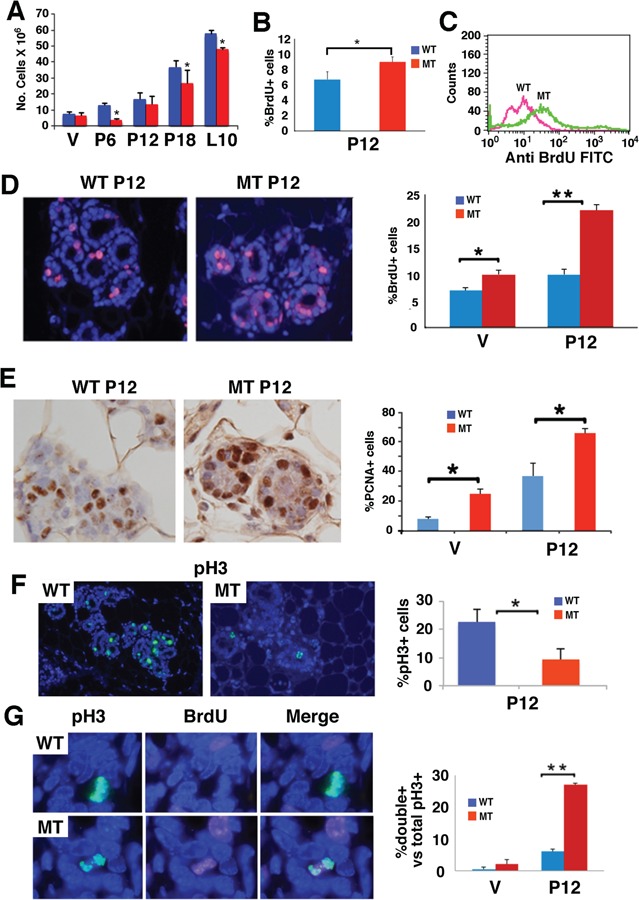
Loss of BRCA1 results in accumulation of mammary epithelial cells in early S phase. (A) Number of mammary epithelial cells in the fourth gland of BRCA1 mutant-type (MT) and wild-type (WT) mice at virgin (V), pregnant day 12 (P12), P18 and L10. (B and C) Detection of percentage (B) and intensity (C) BrdU+ cells in the fourth mammary gland using FACS analysis. (D) Immunoflorence staining in histological sections. Percentages of BrdU+ cells were shown in the bar figure on the right. (E) PCNA+ cells in MT and WT glands. Percentages of PCNA+ cells were shown in the bar figure on the right. (F) Phosphorylated histone 3 positive (pH3+) cells at P12 MT and WT glands. Percentages of pH3+ cells were shown in the bar figure on the right. (G) pH3 and BrdU positive cells in MT and WT glands. Percentages of pH3 and BrdU double-positive cells were shown in the bar figure on the right. At least three animals for each genotype and each time points were used. Most mice used were at ~4 months of age with average weights (from more than 15 mice for each genotype) were 28.3 ± 5.3 g for WT and 30.02 ± 5.5 g for MT. All experiments were done in triplication and P-value of Student’s t-test was calculated accordingly. *P < 0.05 and **P < 0.01.
The higher fraction of BrdU+ cells is not consistent with the lower number of total mammary cells in the MT glands. To investigate this, we stained cells with proliferating cell nuclear antigen (PCNA), which shows no or weak expression in G1, G2 and M phases but accumulates more abundantly in S phase with variable patterns of staining in terms of both intensity and distribution (28). Consistent with BrdU staining, we observed significantly increased percentage of PCNA+ cells in MT glands than in WT glands at both virgin and P12 (Fig. 1E). Based on the staining patterns of PCNA (Supplementary Material, Fig. S1A), we found that the increase in PCNA+ cells occurred at the early S phase, whereas at middle and late S phases, the fraction of PCNA+ cells was moderately lower in MT glands than in WT glands, (Supplementary Material, Fig. S1B). While this observation confirmed the enhanced BrdU incorporation in the MT gland, it raises two questions: (1) Why does the absence of BRCA1 enhance DNA replication? and (2) Why does the enhanced DNA replication correlate with reduced, instead of increased, total number of cells?
To investigate this, we first analyzed cell cycle progression in WT and MT cells. Our data showed that fewer MT cells entered mitosis compared with WT cells as revealed by reduced number of p-histone H3 positive (pH3+) cells (Fig. 1F). Notably, 27% of BRCA1-deficient cells at P12 prematurely entered the mitotic phase and were labeled with both pH3+ and BrdU+ (pH3+/BrdU+), whereas only ~6% pH3+/BrdU+ cells were detected in WT glands at P12 (Fig. 1G). Such premature mitotic entry was rarely detected in the virgin glands of both genotypes (Fig. 1G). Double labeling with pH3 and PCNA detected a similar abnormality and revealed that some pH3+/PCNA+ double-positive MT cells at different stages of the S phase (Supplementary Material, Fig. S1C), providing additional support that BRCA1 MT cells prematurely enter mitosis before their DNA is completely replicated.
Using γH2AX staining, which marks cells with damaged DNA, in particular DNA double strand breaks (DSBs), we detected an ~6-fold increase in γH2AX+ cells, i.e. from 3% in P12 WT glands to 18% in MT glands. No obvious γH2AX+ cells were found at the virgin glands of both genotypes (Supplementary Material, Fig. S1D). These observations, combined with our previous finding that BRCA1 MT mammary glands exhibit high levels of apoptosis revealed by Terminal deoxynucleotidyl transferase dUTP nick end labeling (TUNEL) assay (16), indicate that BRCA1 deficiency enhanced DNA replication, triggered abnormal cell cycle progression, induced DNA damage at the expense of cell viability and consequently reduced cell numbers. On the other hand, BRCA1 WT pregnant glands also displayed some of these abnormalities, although at lower severity than MT glands, which suggests that fast cell proliferation during pregnancy is stressful in terms of inducing DNA damage and miscoordination of cell cycle progression, highlighting an essential role of BRCA1 in these processes.
BRCA1 deficiency enhances expression of genes involved in DNA replication pathways during pregnancy
To investigate the mechanisms underlying the BRCA1 deficiency-associated abnormalities and identify genes that mediate BRCA1 function during pregnancy, we first performed microarray studies on RNAs isolated from virgin, P12 (highly proliferative gland), P18 (well-differentiated gland, characterized by the high levels of milk protein, such as WAP; Supplementary Material, Fig. S2A) and lactation 10 (L10, fully matured nursing gland) mammary glands of both Brca1Co/Co;MMTV-Cre and Brca1+/+;MMTV-Cre mice at 3–4 months of age. Expression of BRCA1 at these stages represents its basal, high, reduced and low levels (Supplementary Material, Fig. S2B). Genes that were differentially expressed among these developmental stages with both P < 0.05 and fold change of ≥1.5 or ≤−1.5 using analysis of variance (ANOVA) were identified. Our data revealed a large number of genes whose expression changed at different stages of the pregnancy, which represent proliferation-, differentiation- and lactation-associated changes in BRCA1 WT (Samples 1–3) and MT (Samples 4–6) mice (Supplementary Material, Table S1).
Next, we compared MT and WT glands to identify genes whose expression can be affected by BRCA1 mutation. The data revealed that BRCA1 deficiency changed expression of 2746 genes in virgin and 2703 genes in lactation glands, suggesting BRCA1 loss yielded a significant impact on mammary gland development at these stages. Of note, the difference between BRCA1 MT and WT glands became significantly attenuated during the pregnancy and only had expression change of 144 and 77 genes at P12 and P18, respectively (Samples 7–10, Supplementary Material, Table S1). This observation suggests that pregnancy has masked the impact of BRCA1 deficiency on mammary gland development. A comparison between proliferation-associated genes in P12 WT and MT glands identified 1135 genes that are shared by both WT and MT mice (Fig. 2A). These genes may be involved in the development of mammary gland from virgin to P12 and their expression is affected by BRCA1 deficiency.
Figure 2.
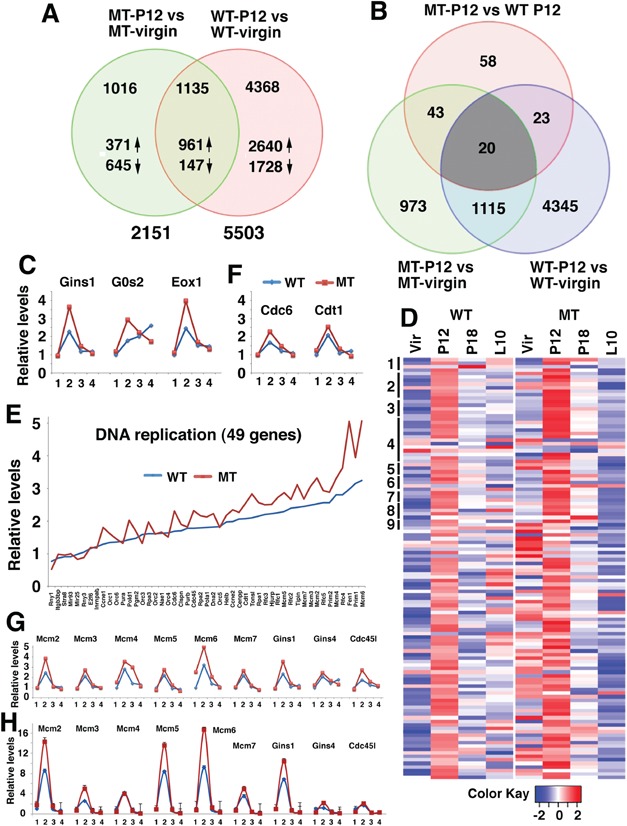
Identification of genes whose expression is affected by pregnancy and BRCA1. (A) Venn diagram comparing genes differentially expressed in P12 and virgin between BRCA1 MT and WT mammary glands. Number of genes changed was as listed. (B) Venn diagram comparing genes differentially expressed among MT-P12 versus WT-P12, MT-P12 versus MT virgin and WT-P12 versus WT virgin. (C) Relative expression levels of GINS1, G0S2 and EXO1 at virgin (1), P12 (2), P18 (3) and L10 (4) revealed by microarray. Expression levels of these genes at virgin were set at 1. (D) Heatmap showing expression of 121 genes that are involved in various pathways of DNA replication in WT and MT mammary gland at virgin, P12, P18 and L10. Forty-nine genes in the first nine pathways in Supplementary Material, Table S3 are marked by vertical bars on the left side and are shown in panel (E). (E) Expression of genes in P12 MT and WT mammary glands that are involved in DNA replication (only 49 genes in the first 9 DNA replication pathways were shown because of space limitation). (F) Expression levels of CDC6 and CDT1 at virgin (1), P12 (2), P18 and L10 (4) revealed by microarray. (G and H) Expression levels of some DNA replication-related genes at virgin (1), P12 (2), P18 (3) and L10 (4) revealed by microarray (G) and validation of their expression by real-time PCR (H). See also Supplementary Materials, Figure S2 and Tables S1–S3. Three animals for each genotype and each time points were used for microarray.
From the 144 genes that are differentially expressed between P12 WT and P12 MT glands, we identified 20 genes that are common in all three lists (Fig. 2B, Supplementary Material, Table S2). We noticed three genes that are involved in some well-known functions of BRCA1, such as DNA replication (GINS complex subunit 1, GINS1), cell cycle (G0/G1 switch gene 2, G0S2) or DNA repair (Exonuclease 1, EXO1) that were induced at P12 and were further enhanced by BRCA1 deficiency (Fig. 2C).
Consistent with this finding, our Go ANOVA pathway analysis on gene expression in BRCA1 WT and MT glands revealed that the most significantly upregulated pathways are those that are involved in DNA replication followed by some pathways for DNA damage repair (Supplementary Materials, Fig. S2C and Table S3). Of note, all 22 pathways for DNA replication were significantly upregulated in both p12 BRCA1 WT and MT glands compared with their corresponding virgin glands. Their levels were also moderately increased in MT glands than in WT glands (Supplementary Material, Table S3). Heatmap analysis indicated that most genes (111 out of all 121 genes in these 22 pathways) were upregulated from virgin to P12 and gradually reduced at P18 and L10 (Fig. 2D, left), whereas BRCA1 deficiency further enhanced their expression at virgin and P12 (Fig. 2D, right). More detailed analysis was performed in 49 genes in the first 9 pathways (Fig. 2E). Higher expression levels of MT gland at P12 than WT p12 were also found, although at less extent, in DNA repair pathways (Supplementary Materials, Table S3 and Fig. S2D). Thus, to cope up with fast cell proliferation, pregnancy markedly upregulated the expression of genes involved in cell cycle progression and DNA damage repair. Loss of BRCA1 exhibited a specific enhancement on expression of most genes related in DNA replication, whereas its impact on expression of genes involved in other pathways was less obvious or not obvious.
DNA replication is tightly regulated by a large protein complex, called replisome, composed of helicases, primases and DNA polymerases that are responsible for initiating and maintaining replication forks to duplicate both leading and lagging DNA strands. The impact of BRCA1 deficiency on genes encoding replisome components prompted us to examine their expression in specific steps of DNA replication. The first step of DNA replication is the formation of the origin recognition complex (ORC) on DNA at replication origins. Our data indicate that expression of all six members of this complex (ORC1–6) was induced at P12 WT mammary glands (Supplementary Material, Fig. S3A), which is consistent with the impact of the pregnancy on DNA replication. Loss of BRCA1 significantly increased expression of 4 genes (ORC2–5) in MT cells in virgin mice, but did not cause obvious changes in their expression at P12 mammary gland compared with WT cells (Supplementary Material, Fig. S3A). ORC serves as a scaffold for the assembly of other key initiation factors, includes cell division cycle 6 (CDC6), chromatin licensing and DNA replication factor 1 (CDT1) and minichromosome maintenance proteins to form the pre-replication complex (29). Loading of MCM proteins, which form the replicative helicase, occurs during G1 and the helicase is activated during S phase by recruitment of additional components, the cell division cycle 45 (CDC45) and the GINS complex (30). A variety of regulatory factors assemble around the helicase to produce the replisome, which is responsible for DNA replication (31). In WT mammary gland, expression of most of the pre-replication complex genes was induced at P12 from the basal level at virgin, reduced at P18 and further decreased to a level similar to that of virgin gland. BRCA1 deficiency enhanced expression of many components of the pre-replication complex (Fig. 2F and G). Expression of CDC45 and GINS1 was further increased in BRCA1-deficient glands, while expression of other three GINS subunits was induced by pregnancy, but BRCA1 deficiency did not further increase their expression (Fig. 2G). We conducted real-time RT-PCR analysis on RNA isolated from WT and MT glands and were able to confirm the microarray data. Overall, our data indicate that pregnancy induces higher expression of majority genes involved in DNA replication that is further enhanced by BRCA1 deficiency (Fig. 2H).
BRCA1 antagonizes estrogen signaling and suppresses transcription of genes encoding replisome
It has been reported that three major pregnancy associated hormones, estrogen, progesterone and prolactin, play important roles in mammary gland development (32,33). To investigate which of these factors are responsible for the enhanced expression of genes involved in DNA replication, we isolated primary mammary epithelial cells from BRCA1 MT and WT mice and tested the effect of these three hormones. Because BRCA1 MT primary mammary epithelial cells grow poorly after passaging 2 to 3 times, similar to BRCA1 MT mouse fibroblast cells (16), we only used cells at passage 1 for this experiment. The data indicated that estrogen treatment induces transcription of MCM2–7, CDC45 and GINS1, which was enhanced by BRCA1 deficiency at most time points (Fig. 3A). This expression pattern mimics in vivo expression pattern of these genes, i.e. expression increases at P12 and BRCA1 deficiency further enhances it. In contrast, treatment of progesterone (Supplementary Material, Fig. S3B) and prolactin (Supplementary Material, Fig. S3C) induced transcription of these genes initially (in the first 6 h); however, the induction was blocked by BRCA1 deficiency. This finding suggests that while all three hormones might play some distinct roles during various stages of normal pregnancy, E2/ERα play a major function upon the absence of Brca1. Therefore, we focused on the potential interplay between BRCA1 and estrogen signaling. First, we validated the results using human T47D breast cancer cells carrying a specific BRCA1 knockdown (sh-BRCA1) or mock knockdown (wt-BRCA1) generated earlier (34). Setting the expression levels of untreated wt-BRCA1 T47D cells as a 1, estrogen treatment significantly increased fold change of each gene tested in the WT cells (Fig. 3B). However, the gene expression in the sh-BRCA1 cells was even higher and the treated BRCA1 MT cells exhibited the highest expression (Fig. 3B). Similar observations were also made in sh-BRCA1 and wt-BRCA1 MCF7 breast cancer cells (Fig. 3C, Supplementary Material, Fig. S3D).
Figure 3.
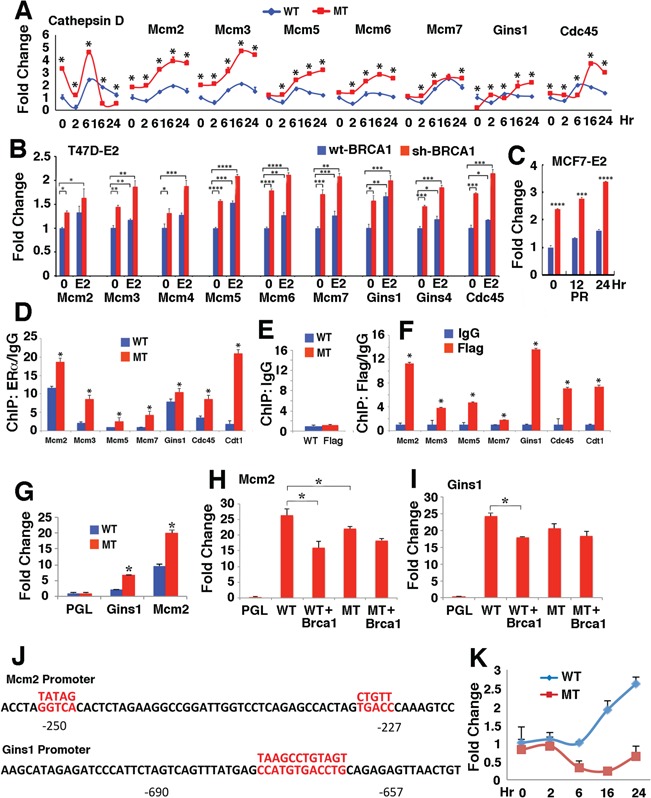
BRCA1 antagonizes the induction of replisome-related genes by estrogen signaling. (A) Estrogen induces expression of replisome-related genes, which is enhanced by the loss of BRCA1 in primary mammary epithelial cells during a time course in cell culture condition revealed by qRT-PCR. Cathepsin D, which is a known transcriptional target of estrogen, was used as a control. The mammary cells were isolated from P12 BRCA1-MT and WT glands and the assay was performed at passage 1. (B) Expression of these genes was upregulated by E2 treatment for 24 h in human T47D sh-BRCA1 and wt-BRCA1 cells. (C) PR expression in human MCF7 sh-BRCA1 and wt-BRCA1 cells 24 h after E2 treatment. (D–F) ERα and BRCA1 bind to the promoters of these genes revealed by using an antibody to ERα (D) and Flag, which was knocked in-frame into the 3′ end of Brca1 (F) in P12 BRCA1 MT and WT mammary tissues. The Brca1 WT mice expressed a full-length Brca1–Flag fusion protein and Brca1 MT mice expressed a Δ11 Brca1–Flag fusion protein and both can be detected by an antibody to Flag (our unpublished data). An example of control ChIP using an antibody to IgG was shown in (E). (G) Relative levels of MCM2 and GINS1 luciferase promoter reporters transfected into mouse BRCA1 MT (G600) and WT (B447) mammary epithelial cell lines. Expression levels of the vector without the reporter (PGL) were set at 1. (H and I) Expression of MCM2 (H) and GINS1 (I) luciferase reporter in G600 cells. WT: transfection with WT luciferase reporter; WT + Brca1: co-transfection of WT reporter and a BRCA1 expression unit; MT: transfection with a luciferase reporter that carries a mutation in MCM2 (H) or GINS1 (I). (J) The promoter of the MCM2 and GINS1genes and mutation sites. The candidate estrogen binding sites were marked by red color and the mutated sequences were shown above. (K) Relative expression of BRCA1 in BRCA1 WT and MT primary mammary epithelial cells treated with estrogen at various time points detected using primers located in the exon 11 by qRT-PCR. MT + Brca1: co-transfection of MT reporter and a BRCA1 expression unit. *P < 0.05 and **P < 0.01 of Student’s t-test. See also Supplementary Material, Figure S3.
Estrogen regulates gene expression mainly through its nuclear receptor ERα, which binds to promoters of target genes in a sequence specific manner (33,35–37). Our informatics analysis detected putative ERα binding sites in many genes involved in replication pathways. To test if ERα could bind to the promoter of these genes, we performed ChIP analysis using P12 mammary tissues and the data revealed that ERα indeed binds to the promoter of these genes and that BRCA1 deficiency enhanced the binding at various levels (Fig. 3C and D). Using an antibody to Flag, which was knocked into the 3′ end of BRCA1, we also detected binding of BRCA1 to the same region in the promoter of these genes (Fig. 3D and E).
Next, we conducted further analysis on the promoter of two genes, MCM2 and GINS1, using luciferase promoter reporters in the established mammary cell lines from BRCA1 MT (G600: Brca1Δ11/ Δ11;p53+/−) and BRCA1 WT (B447: Brca1+/+;p53+/−) mammary glands. These cells were immortalized after prolonged culture and continuous passaging and spontaneously deleted their remaining WT copy of p53 gene and could be transfected with relatively high frequency. Our study indicated that both MCM2 and GINS1 luciferase reporters had higher expression levels in BRCA1 MT cells than in WT cells (Fig. 3F). Then, we studied the response of MCM2 reporter (Fig. 3G) and GINS1 reporter (Fig. 3H) in BRCA1 MT cells after transfection of BRCA1 back to these cells. The data indicated that expression of BRCA1 significantly repressed expression these reporters (compare lanes 2 and 3 in Fig. 3G and H). The promoter of MCM2 and GINS1 contains estrogen response element consensus site (38), which ERα may bind to (Fig. 3J). We next mutated these sites in the reporters and the data indicated that mutation of these sites attenuated the inhibitory effect of BRCA1 (compare lanes 4 and 5 in Fig. 3G and H). Finally, our data revealed that E2 treatment induced expression of BRCA1 (Fig. 3K), highlighting an intrigue interaction between these factors in maintaining normal mammary gland development through maintaining a balanced expression of genes encoding replisome.
BRCA1 deficiency enhances replication initiation rates and leading to collapse of replication fork
Because estrogen treatment increased expression of gene encoding CDC45/MCM2-7/GINS (CMG) complex and BRCA1 deficiency further enhanced their expression, we performed a DNA combing assay for studying DNA replication speed and replication initiation frequency in the presence or absence of E2 in Brca1 WT and MT mammary primary cells (Fig. 4A–C). The data indicated that WT cells have slightly higher DNA replication speed (fork velocity, FV) (average FV: 2.3 kb/min) than MT cells (average FV: 2 kb/min) prior to E2 treatment (Fig. 4D) (P = 0.344). However, they displayed a marked difference in the inter-origin distances (IODs) with an average of 66 kb for BRCA1 MT cells and an average of 110 kb for WT cells (Fig. 4E) (P = 0.00535). Considering the mouse genome is ~3 × 10⁹ bp, we calculated that there were approximately 45454 (3 × 10⁹/66 = 45454) and 27272 (3 × 10⁹/110 = 27272) replication initiation events in the BRCA1 MT and WT cells, respectively. Hence, there are ~70% more active origins in MT cells than in WT cells.
Figure 4.
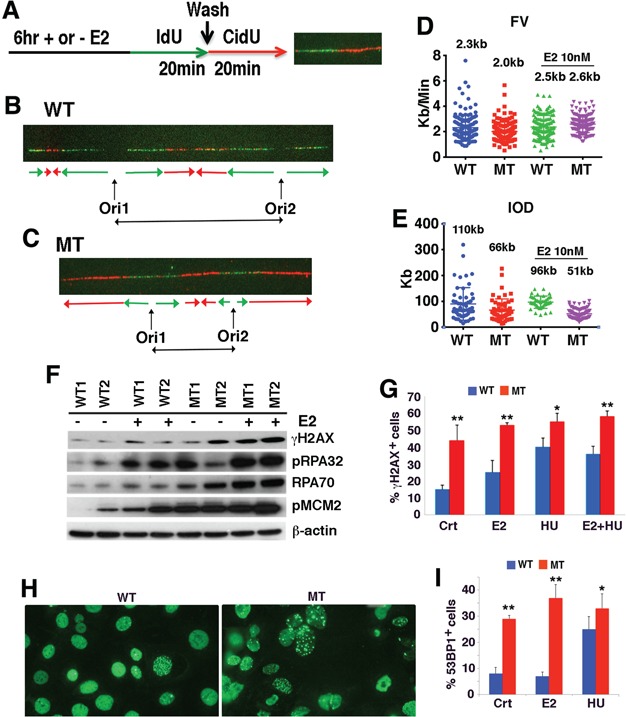
BRCA1 deficiency results in increased replication initiation and replication fork collapse. (A–C) Analysis of DNA replication using DNA combing assay with or without E2 treatment for 6 hours followed by sequential labeling with IdU and CldU for 20 min each, respectively (A). Examples of IdU-CldU ssDNA fiber tracks from BRCA1 WT (B) and MT cells (C). The lengths of fiber label associated with ldU and CIdU incorporation and IODs and rates of replication fork progression were calculated as described previously (71). (D,E) Fork velocity (FV) (D) and inter-origin distance (IOD) (E) before and after E2 treatment (statistics are mentioned in the corresponding text.). (F) Western blot analysis of mammary epithelial cells isolated from two pairs of P12 BRCA1 WT and MT mammary glands before and after E2 treatment. (G) Percentages of γH2AX positive cells. Crt: control; E2: estrogen at 10 nm for 6 h: HU: hydroxyurea at 1 mm for 90 min; and E2 + HU. (Also see time course of E2 treatment in Supplementary Material, Figure S4). (H and I) Images of 53bP1 positive cells in MT and WT cells (H) and percentages of 53BP1 under E2 or HU treatment conditions (I). *P < 0.05 and **P < 0.01 of Student’s t-test. See also Supplementary Material, Figure S4.
Next, we treated the cells with E2 (10 nm) for 6 h and measured their IOD at the last 20 min of the treatment. We observed slightly shortening of IOD in BRCA1 WT cells upon estrogen treatment, from 110 to 96 kb (P = 0.28759), whereas such a shortening in BRCA1 MT cells became much more statistically significant, from 66 to 51 kb (P = 0.0098) (Fig. 4E). Consistent with this, E2 treatment only slightly increased the FV in WT cells (from 2.3 to 2.4 kb, P = 0.344), but the FV was significantly enhanced in MT cells (from 2.0 to 2.6 kb, P = 8.61e-11; Fig. 4D). These data are consistent with the notion that BRCA1 MT cells have stronger DNA replication activity than BRCA1 WT cells.
However, this notion is contradictory to the fact that BRCA1 MT cells grow much more poorly than BRCA1 WT cells both in the mammary gland and in the cell culture. To understand this, we performed western blot analysis and detected higher levels of γH2AX in MT cells than in WT cells, which were further increased by E2 treatment (Fig. 4F), suggesting that estrogen treatment might have caused some damage to replication fork in MT cells. BRCA1 MT cells also exhibited higher levels of single-strand DNA (ssDNA) binding proteins (RPA70 and pRPA32) than WT cells prior to and after E2 treatment, which serve as a sign for increased ssDNA due to increased replication initiation (Fig. 4F). Consistently, MT cells also displayed increased levels of MCM2-S40/41 in both basal and E2-treated conditions compared with WT cells (Fig. 4F, also see more later).
Higher levels of RPA70 and pRPA32 also suggest that BRCA1 MT cells have more collapsed replication fork, which are enhanced profoundly by E2 treatment. Immunoflorescent staining with an antibody to γH2AX, which is commonly used for detecting collapsed replication fork (39), revealed higher percentage of cells containing γH2AX foci in MT cells, which is enhanced by E2 treatment (Fig. 4G; Supplementary Material, Fig. S4). Notably, the effect of E2 on inducing γH2AX foci is only slightly lower than that of hydroxyurea (HU) in MT cells, which is known to induce replication fork collapse (Fig. 4G). It was shown that upon the damage of replication fork, 53bP1 is recruited to sites of aberrant fork structures to suppress homologous recombination and facilitate non-homologous end joining (40). Consistent with the increased aberrant fork structures upon E2 or HU treatment, our data revealed markedly increased 53bP1 foci in MT cells than in WT cells (Fig. 4H and I). These observations indicate that the enhanced DNA replication initiation in BRCA1 MT cells caused replication fork collapse, increased DNA damage and apoptosis during pregnancy or upon estrogen treatment.
Analysis of DNA replication checkpoint reveals the impairment of ATR-mediated phosphorylation of RPA2-S33
Collapsed replication fork generates ssDNA, which activates the master checkpoint kinases cascade: ataxia telangiectasia-mutated and Rad3-related (ATR), CHK1 and WEE1 (41–43). To investigate if ATR, CHK1 and WEE1 signaling are indeed involved in DNA replication abnormality found here, we treated mammary epithelial cell line cell with 1 mm of HU for 90 min and added specific inhibitors to these kinases, individually, at the last 20 min followed by chlorodeoxyuridine (CldU) labeling for 10 min with inhibitor present (Fig. 5A). Our data indicated that BRCA1 WT cells immediately reduced DNA replication upon HU treatment as reflected by diminished CldU incorporation in terms of both CldU+ cells and intensities (Fig. 5B–D). In contrast, much milder reduction in CldU incorporation was observed in BRCA1 MT cells (Fig. 5B, C and E), suggesting BRCA1 deficiency impaired the DNA replication checkpoint. Next, we treated cells with inhibitors for ATR, CHK1 or WEE1, and the data revealed partially restoration of CldU incorporation in WT cells, indicating that these kinases cumulatively inhibited DNA replication (Fig. 5B, C and D). In MT cells, the inhibition of ATR or CHK1 did not cause significant changes in CldU incorporation, whereas inhibition of WEE1 completely restored it (Fig. 5B, C and E), suggesting that activation of WEE1 is responsible for the partial reduction of CldU incorporation upon HU treatment while ATR and CHK1 might have already inactivated in BRCA1 MT cells prior to the adding of their inhibitors.
Figure 5.
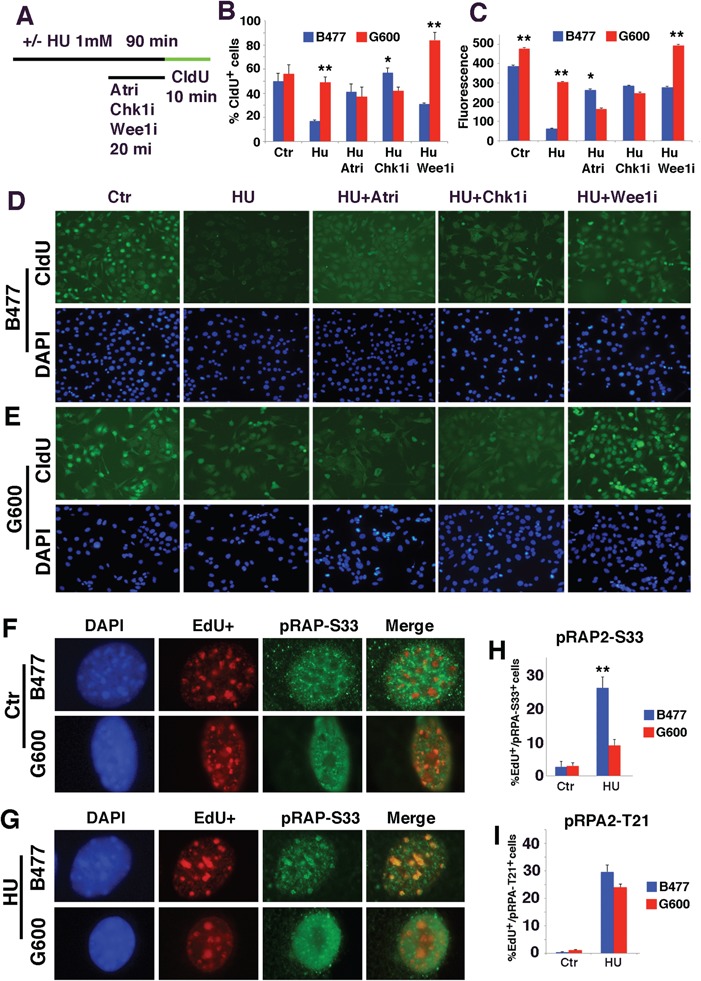
Analysis of DNA replication checkpoint reveals the impairment of ATR-mediated phosphorylation of RPA2-S33. (A) The procedure for analysis of DNA replication by CldU incorporation in BRCA1 WT (B477) and MT (G600) cells upon the treatment of HU together with inhibitors for ATR (ATRi), CHK1 (CHK1i) and WEE1 (WEE1i). (B and C) Quantification of CldU positive cells (B) and fluorescent intensity for CldU labeling (C) under these treatment conditions. *P < 0.05, **P < 0.01 and ***P < 0.001 of Student’s t-test. (D and E) Representative images of WT (D) and MT (E) cells under these treatment conditions. (F–H) Representative images of EdU+ and pRPA2-S33+ foci in untreated (F) and HU-treated (G) B477 and G600 cells. Percentages of pRPA-S33+/EdU+ are shown in bar figure on the right (H). Both cells contain lower levels of pRPA-S33+ cells in untreated condition. Upon HU treatment, the percent of pRPA-S33+ increases to ~26% in B477 cells, while it only reaches to ~8% in G600 cells. (I) Percentages of pRPA-T21+/EdU+ cells in B477 and G600 cells shown in the bar figure. Both cells contain lower levels of pRPA-T21+ cells in untreated condition. Upon HU treatment, the percent of pRPA-T21+ cells increases to ~28 and 25% in B477 and G600 cells, respectively.
To investigate the effect of WEE1 further, we stained cells with an antibody for phosphorylation of replication protein A2 (RPA2) at S33 (pRPA2-S33), which is a target by ATR at replication fork. The data indicated that levels of pRPA2-S33 were at low levels in WT and MT cells prior to HU treatment (Fig. 5F and H). In contrast, HU treatment induced pRPA2-S33 formation in ~26% of WT cells at DNA replication foci whereas only ~8% MT cells showed weak pRPA2-S33 foci (Fig. 5G and H). On the other hand, BRCA1 deficiency did not interfere with formation of pRPA2-T21, which is phosphorylated by ataxia telangiectasia mutated at DSB (Fig. 5I). This observation suggests that the DNA replication checkpoint mediated by ATR is impaired in BRCA1 MT cells. It has been shown that ATR elicits some of its functions through phosphorylation and interaction with BRCA1 (44,45), and both ATR and BRCA1 are essential for activating CHK1 kinase that regulates DNA damage-induced G2/M arrest (41–43,46), which may account for the reason why CHK1 activity is also impaired in BRCA1 MT cells.
BRCA1 and WEE1–MCM2 signaling inhibit the initiation of DNA replication in parallel to reduce DNA damage
Activation of DNA replication checkpoint upon DNA damage serves as a mechanism to prevent accumulation of mutations caused by DNA damage, therefore protect cells from lethality induced by DNA damaging. In the light of the finding that the DNA replication checkpoint in BRCA1 MT cells is partially active because of the activation of WEE1, we hypothesized that the activation of WEE1 replication checkpoint in BRCA1 MT cells could serve as a defense for these cells to avoid further genomic instability. From the cancer therapy aspects, if this defense is overridden, BRCA1 MT cells should be more sensitive to DNA damaging agents.
To investigate this, we examined effect of WEE1 inhibition together with cisplatin. Cisplatin treatment causes DNA damage and is known to be more potent in killing BRCA1 associated breast cancer than sporadic breast cancer (47–49), but its effect with WEE1 inhibition has not been tested. Our data indicated that cisplatin treatment significantly reduced DNA replication in BRCA1 WT cells (30% reduction in CldU intensity), but such effect was moderate in MT cells (14% reduction) (Supplementary Material, Fig. S5A, B, D and E). Most notably, WEE1 inhibition overrode the effect of cisplatin and enhanced DNA replication initiation rates, as reflected by more extensive CldU incorporation. The data also revealed significant more CldU and γH2AX double-positive cells and in BRCA1 MT than WT cells upon WEE1i treatment (Supplementary Material, Fig. S5C, D and E), reflecting more extensive replication fork collapses upon WEE1 inhibition in the MT cells. These data underscore the important role of WEE1 in repressing initiation of DNA replication and maintain genome stability.
We showed earlier that pMCM2-S40/41 level is higher upon the loss of BRCA1 and further enhanced upon estrogen treatment (Fig. 4G). It has been shown that the phosphorylation of MCM2 promotes MCM2–7 ring opening, which facilitates DNA replication initiation rates (50,51). Therefore, we hypothesized that WEE1 might repress replication initiation through MCM2. To investigate this, we treated G600 cells with WEE1i followed by CIdU labeling (Fig. 6A). The data indicated that WEE1i resulted in more intensive pMCM2-S40/41 positivity, which is correlated with significantly increased DNA replication origin initiation as reflected by increased CldU incorporation than untreated cells (Fig. 6B and C). This observation provides initial evidence that the suppression of DNA replication initiation by WEE1 may be mediated by MCM2.
Figure 6.
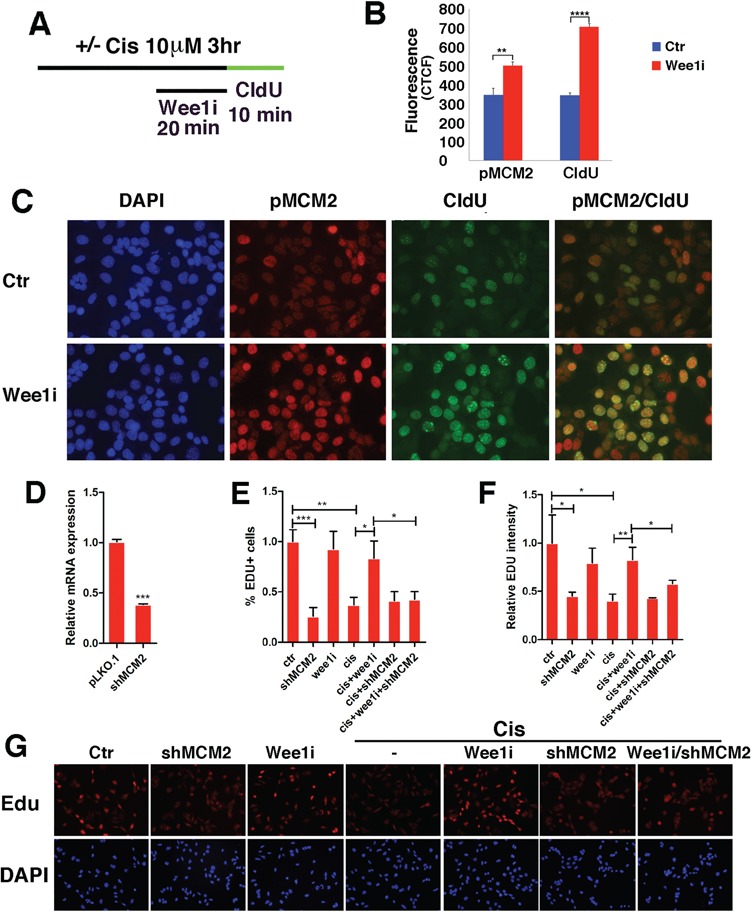
Analysis of DNA replication checkpoint in relation to WEE1–MCM2 signaling in BRCA1 MT G600 cells. (A–C) Effects of cisplatin and WEE1i on phosphorylation of MCM2. (A) Conditions for the treatment procedure. (B) Quantification of fluorescent intensity for pMCM2-S40/41 and CldU labeling. (C) Representative images showing the effect of WEE1i on pMCM2-S40/41 and DNA replication (revealed by CldU incorporation) under these conditions. (D–G) Effect of MCM2 knockdown on DNA replication in G600 and G600-shMCM2 cells that were treated with WEE1i and/or cisplatin. (D) MCM2 mRNA levels in control and shMCM2 cells, (E and F) quantification of percent of Edu + cells and relative Edu intensity and (G) representative images showing the effect of cisplatin and/or WEE1i on G600 cells and G600-shMCM2 cells. *P < 0.05, **P < 0.01 and ***P < 0.001 of Student’s t-test.
We showed earlier that WEE1i could override cisplatin-mediated repression on DNA replication (Supplementary Material, Fig. S5). To study if this effect of WEE1 is mediated by MCM2, we knocked down MCM2 using shRNA against MCM2 in G600 cells (Fig. 6D). Our data indicated that while cisplatin or MCM2-KD significantly shut down DNA replication, WEE1i failed to overrode cisplatin-mediated repression on DNA replication when MCM2 was knocked down (Fig. 6E–G). We also knocked down MCM2 in MDA-MB231–shBRCA1 cell line, which was generated previously (32) and made the similar finding (Supplementary Material, Fig. S6). These data provide further evidence that the suppression of DNA replication by WEE1 is largely mediated by MCM2.
Targeting impaired DNA replication checkpoint as a therapeutic strategy for BRCA1 deficient cancer
The failure to shut down DNA replication upon DNA damage could further enhance DNA damage, leading to cell death; next, we examined the effect of WEE1 inhibition and cisplatin treatment on the viability of BRCA1 MT and WT cells. Our data revealed that BRCA1 MT G600 cells were indeed more sensitive than BRCA1 WT B447 cells to cisplatin, and the addition of WEE1 inhibitor, MK1775, further enhanced the killing (Fig. 7A, P < 0.01). Human BRCA1 MT breast cancer cells (Sum1315 and MB-MDA-436) were also significantly more sensitive than BRCA1 WT breast cancer cells (BT20) at doses of WEE1i at 1 and 10 nm (P < 0.01), and they all showed high sensitivity to WEE1i at higher doses (Fig. 7B). The effect of cisplatin and WEE1i on MCF10A, a normal mammary epithelial cell line, was minimal (Fig. 7B). Similar to mouse cells, the human BRCA1 MT cancer cells exhibited increased expression levels of genes involved DNA replication (Fig. 7C).
Figure 7.
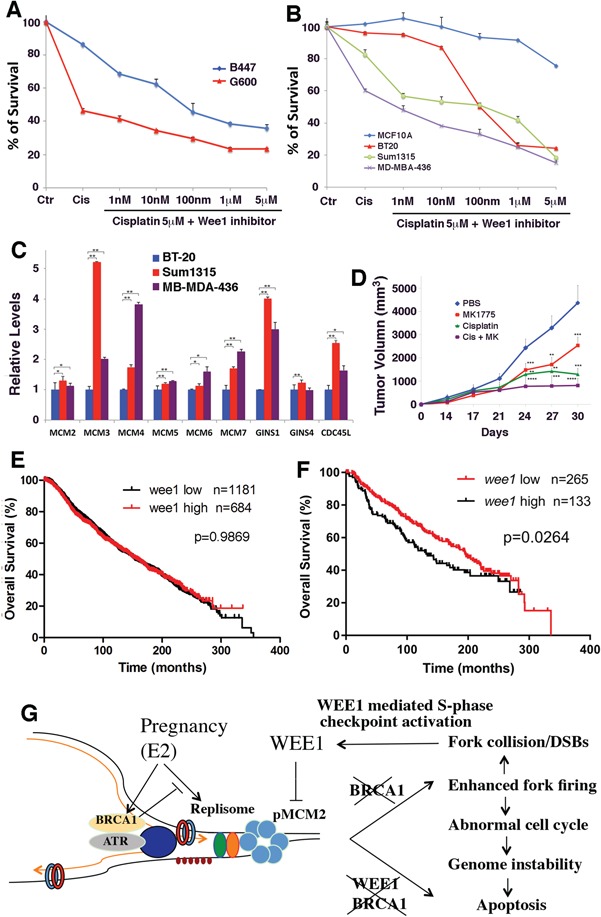
Analysis of drug response of mouse and human breast cancer cell lines. (A) Relative viability of B477 and G600 cells upon treatment of cisplatin and cisplatin/WEE1i. 5 M of cisplatin (~50% survival for G600) was used together with increasing concentration of WEE1i as indicated. G600 cells are significantly more sensitive to cisplatin and WEE1i treatment (P < 0.01). (B) Relative viability of human breast cancer Sum1315 and MDA-MB-436 cell lines (both are BRCA1-deficient cell lines), BT20 (a BRCA1-proficient cell line) and MCF10a (a cell line derived from normal human mammary epithelial cells) upon treatment of cisplatin and cisplatin/WEE1i. All cancer cell lines are more sensitive than MCF10a to the treatment (P < 0.01). BRCA1-deficient cell lines are significantly sensitive than BT20 at lower concentrations of WEE1i (1–10 nm, P < 0.01) and showed similar sensitivity at higher doses of WEE1 inhibitor. (C) Relative expression levels of several DNA replication-related genes in human breast cancer cell lines. (D) Volume of tumors in nude mice generated by implanting of cells of a BRCA1 MT mammary tumor cell line: 69. Drugs used were as indicated. **P < 0.01, ***P < 0.001 and ***P < 0.0001 are Student’s t-test indicating significant differences between untreated and treated samples. Significant differences also observed between WEE1i/cisplatin group and WEE1i or cisplatin single-treated groups. (E and F) Kaplan–Meier analysis showing overall relapse-free survival stratified by WEE1 high and WEE1 low expression in all patients (E) and in BRCA1 mutation and 20% cases with lowest level of brca1 expression (F). All patients with available information regarding expression of BRCA1 and WEE1 and relapse-free time were included in the analysis. All analyses were based upon data obtained in TCGA Research Network: http://cancergenome.nih.gov/. (G) A model for the interplay between BRCA1 and E2/ERα signaling in regulation of DNA replication initiation. As described in the text, this model elicits an intrinsic genetic interplay among E2/ERα, BRCA1 and WEE1–MCM2 signaling in regulation of DNA initiation, enabling the fast proliferation of mammary cells while maintaining the integrity of their genome.
In the allograft model developed by implanting BRCA1 MT cells into mouse mammary fat pad of nude mice, synergistic action between cisplatin and WEE1 was also observed (Fig. 7D). These results suggest that BRCA1 MT cells are more sensitive to combined treatment of cisplatin and WEE1i, and this sensitivity may be attributed to the lack of ability to repair damaged DNA because of BRCA1 functional deficiency.
Overall, these data suggest that WEE1 plays an important role in human BRCA1-associated breast cancer growth. To investigate this, we examined WEE1 expression levels in a large public clinical microarray database of breast cancers (TCGA Research Network: http://cancergenome.nih.gov/). When entire population of cancers was stratified by WEE1 high and low expression, there was no difference in the relapse-free survival (Fig. 7E). In contrast, when cancers with low BRCA1 expression were compared, lower levels of WEE1 correlate with a better relapse-free survival (Fig. 7F). These observations are consistent with our experimental finding that a model that BRCA1 and WEE1 inhibit the initiation of DNA replication in parallel to reduce DNA damage as evidenced by the enhanced DNA replication and DNA damage upon Brca1 deficiency. Consequently, BRCA1 deficient cancer cells are more sensitive to WEE1 inhibition, as reflected by slower growth, which is further inhibited by cisplatin treatment.
Discussion
We have investigated the potential impact of pregnancy on gene expression and genome integrity in relation with BRCA1 deficiency. Our data indicate that pregnancy may generate replicative stresses because of the fast cell proliferation and consequently trigger genetic instability when tumor suppressor BRCA1 is lost. Further analyses revealed that BRCA1 and estrogen signaling antagonize each other in regulating genes encoding replisome, and BRCA1 and WEE1 play a parallel role in suppressing DNA replication during pregnancy to avoid mitotic catastrophe.
Fast cell proliferation during pregnancy induces replicative stress
A special feature of pregnancy, especially in the early stages, is fast cell proliferation (1–3). To cope up with the fast cell proliferation, the early stages of pregnancy upregulate expression of genes involved in DNA replication, cell cycle progression and DNA damage repair, together with many others. However, even in the WT cells, these events are associated with increased DNA damage, suggesting that the pregnancy may generate replicative stresses due to the fast cell proliferation. We detected markedly enhanced DNA replication forks firing in the absence of Brca1, primarily owing to the enhanced activity of replisome, which drives DNA replication (31). BRCA1 deficiency also significantly induces DNA damage as reflected by increased percentage of γH2AX+ cells. Although BRCA1 MT cells exhibit enhanced expression of some genes involved in DNA damage repair, it is apparently not effective, as the absence of BRCA1 should have already impaired DNA repair ability (reviewed in 52). Consequently, BRCA1 deficiency is associated with extensive DNA damage, genome instability and cell cycle abnormalities, leading to the abnormal development of the mammary gland. These data demonstrate that the pregnancy, while serving as a normal process for nurturing new life, is stressful because of its fast cell proliferation and BRCA1 plays a protective role during this process.
Our analysis indicates that E2/ERα signaling acts as a major cause for the upregulation of genes encoding replisome during pregnancy. Indeed, it has been shown that among three major pregnancy-associated hormones involved in mammary gland development, estrogen signaling plays the most critical role especially in the early stages of gland development as MT mice carrying ERα mutation failed to develop mammary gland while disruption of progesterone receptor or prolactin receptor yielded much milder effects (32,33,53–55). Estrogen/ERα signaling transcriptionally regulates expression of numerous genes and induces human breast cancer formation through promotes cell proliferation (36,56–58). Our data uncover an essential role of BRCA1 in antagonizing estrogen signaling to secure the smooth progression of the pregnancy.
BRCA1 antagonizes estrogen on the expression of genes encoding replisome and represses initiation of DNA replication
Previous studies have illustrated intensive interactions between BRCA1 and estrogen signaling in various aspects (21,59–62). We and others also showed previously that high percentages of BRCA1-deficient breast cancers are ERα positive at early stages of tumorigenesis and gradually turned into negative at advanced stages, suggesting that estrogen plays an important role in the initiation of BRCA1-deficient breast cancers (21,63). Here we detected an intensive interaction between BRCA1 and estrogen signaling in modulating the initiation of DNA replication during pregnancy in that estrogen promotes, BRCA1 inhibits, expression of many genes encoding replisome, which is necessary for the fast proliferation of mammary cells. Our further studies provide evidence that this is not due to secondary effects. First, we show that ERα and BRCA1 bind to the promoters of some of these genes. Second, in cultured cells treatment of E2 induces gene expression of these genes, which is enhanced by the absence of BRCA1 and habited by ectopic overexpression of BRCA1. Furthermore, we also showed that estrogen signaling induces expression of Brca1, which serves as a negative regulator for transcription activity of E2 signaling and DNA replication. This observation is consistent with the finding that BRCA1 expression levels are markedly elevated during early stages of pregnancy (15) and our own data (Supplementary Material, Fig. S2B). The markedly increased replication initiation and fork collapse in BRCA1 MT cells underscores the importance of this regulation in maintaining normal development of mammary glands.
BRCA1 and WEE1 inhibit initiation of DNA replication and prevent DNA damage
Previous studies have shown that BRCA1 is required in maintaining integrity of DNA replication fork through its role in regulating homologous recombination at the fork (24,25), promoting unloading of the CMG helicase from a stalled DNA (64) and maintaining DNA Replication fork stability (65,66). However, the role of BRCA1 in regulating DNA replication initiation has not been reported. In this regard, our study indicated that BRCA1 deficiency impaired functions of ATR and CHK1 in the intra S-phase checkpoint activated by HU. It has been previously shown that ATR interacts and phosphorylates BRCA1 on several Ser/Thr residues (i.e. Ser-1423) following cellular exposure to HU or UV light (44,67,68). BRCA1 deficiency also causes mislocalization of ATR to X-chromosome and affects meiotic sex chromosome inactivation during spermatogenesis (45). Our data indicated that BRCA1 deficiency also impairs pRAP-T21 foci formation on ssDNA, which is mediated by ATR. It has been shown that CHK1 is located at stalled replication forks (69) and its function in S-phase checkpoint largely depends on functions of ATR (70). Indeed, both ATR and BRCA1 are essential for activating CHK1 kinase that regulates DNA damage-induced G2/M arrest (41–43,46). These observations may explain why function of CHK1 is impaired in BRCA1-MT cells.
A significant finding is that WEE1 represses initiation of DNA replication primarily through MCM2, as inhibition of WEE1 increases level of Phosphorylated Minichromosome maintenance proteins (pMCM) that is accompanied by enhanced DNA replication initiation, whereas knockdown of MCM2 diminished the suppression of WEE1i to replication initiation. Altogether, as summarized in Figure 7G, our study revealed an intrinsic genetic interplay among E2/ERα, BRCA1 and WEE1–MCM2 signaling in regulation of DNA initiation and enable fast proliferation of mammary cells while maintaining the integrity of their genome. While E2/ERα induces expression of replisome-related genes, Brca1, which is also induced by E2, inhibits them. BRCA1 also interacts with ATR in maintaining the functional DNA replication checkpoint. Our data also reveal that WEE1 represses DNA replication through MCM2 parallel with BRCA1 signaling. Thus, loss of BRCA1 (BRCA1 deficiency alone) or inhibition of WEE1 in BRCA1 WT cells (reduced activity of WEE1 alone) does not completely disruption their repression on DNA replication initiation. On the other hand, WEE1 inhibition in BRCA1-deficient cells enables initiation of DNA replication and forces cells proliferation without proper checkpoint and sensitizes cells to cisplatin treatment. Thus, the combination of WEE1i and cisplatin may serve as a promising therapeutic approach for killing BRCA1-deficient breast cancer.
Materials and Methods
Cell culture and animal
All human breast cancer cell lines (SUM1315, MDA-MB-436 and BT20) and MCF-10a cell line were obtained from American Type Culture Collection (ATCC) and cultured with DMEM (Life Technologies, Carisbad, CA) supplemented with 10% Fetal bovine serum (FBS) (Sigma, St. Louis, MO) and 1% l-glutamine (Life Technologies, Carisbad, CA). MCF10A immortalized mammary epithelial cells were obtained from ATCC and cultured with DMEM/F12 (1:1; Invitrogen, Carlsbad, CA) supplemented with 5% horse serum (Life Technologies, Carisbad, CA), hydrocortisone (0.5 μg/ml; Sigma, St. Louis, MO), EGF (20 ng/ml; Peprotech), insulin (10 μg/ml; Invitrogen, Carlsbad, CA) and cholera toxin (100 ng/ml; Sigma, St. Louis, MO). For culturing primary mammary cells, the fourth pair of the mammary glands of P12 BRCA1 MT mice and WT mice are dissected and immediately cut with scissors into small pieces. Epithelial cells are treated with collagenase III and hyaluronidase for 2 h followed by disassociating them into single or small clusters of cells. Cells are cultured with DMEM (Life Technologies, Carisbad, CA) as described earlier but supplemented with 5 μg/ml of insulin. All animal studies were based animal protocols approved by the Animal Care and Use Committee (ACUC) of University of Macau.
Chemicals and antibodies
The following chemical inhibitors and reagents were used at the indicated concentrations unless stated otherwise: WEE1 inhibitor MK-1775 (500 nm; Selleck Chemicals, Houston, TX), CHK1 inhibitor SB 218078 (2 μm; Tocris), ATR inhibitor VE-821 (20 μm; Selleck Chemicals, Houston, TX), iododeoxyuridine (IdU; 10 μg/ml; Sigma-Aldrich, St. Louis, MO) and CldU (10 μg/ml; Sigma-Aldrich, St. Louis, MO). The following antibodies were used: RPA32 (Bethyl Laboratories, Montgomery, TX), RPA32-pT21 (Abcam, Austin, TX), RPA32-pS33 (Abcam, Austin, TX), α-Tubulin and β-actin (Sigma-Aldrich, St. Louis, MO), RPA70 (Abcam, Austin, TX), CldU (Accurate Chemical, Westbury, NY), IdU (Becton Dickinson, Franklin Lakes, New Jersey), phospho-Histone-H2AX-Ser139 (γH2AX; Millpore, St. Louis, MO), pMCM-S40/S41 (Abcam, Austin, TX) and PCNA (Abcam, Austin, TX).
DNA combing assay
Cells were pulse-labeled sequentially with 50 μm iododeoxyuridine (IdU) and 100 μm CldU(Sigma, St. Louis, MO) for 20 min each. Cells were then harvested for the DNA combing assay as described previously (71). Slides were scanned with a Becton Dickinson (BD) pathway 855 controlled by AttoVision (Becton Dickinson, Franklin Lakes, New Jersey). Fluorescent signals were measured using the ImageJ program (National Cancer Institute, Bethesda, MD) and converted to base-pair values according to the criteria that 1 μm equals 2 kb and 1 px encompasses 340 base pairs. Statistical analysis was performed using Prism 5 software (GraphPad, San Diego, CA).
RNA isolation and transcriptome analysis
Total RNA was extracted from freshly isolated from virgin (V), pregnant day 12 (P12), P18 and L10 mammary glands of both Brca1co/Co;MMTV-Cre and Brca1+/+;MMTV-Cre mice at 3–4 months of age by using RNA STAT-60TM solution according to manufacturer’s instruction (Tel-Test, Inc., Alvin, TX). The purity and concentration of RNA were determined using NanoDrop Spectrophotometer (NanoDrop Technologies, Wilmington, DE) at 260/280 nm and gel electrophoresis. RNA samples with high quality were reverse transcribed to cDNA by using the cDNA kit purchased from Ambion Inc., Austin, TX, Cat. Am1723) following the manufacturer’s instructions. Affymetrix oligo array (Cat# 901169) was used for microarray analysis. Bioinformatic analysis was performed using the software Partek Genomic Suite and gene ontology was performed using the software GeneGo. Genes that are differentially expressed among these developmental stages with both P < 0.05 and fold change with absolute value ≥1.5 using ANOVA were identified. The microarray data have been submitted to the Gene expression omnibus (GEO) database under the accession number GSE92342.
Real-time RT-PCR validation of microarray data
Quantitative real-time PCR (qRT-PCR) was performed to validate the expression levels of some genes generated from bioinformatics analysis of microarray data in mammary gland cells. A master mix composed of 11.5 μl water, 12.5 μl SYBR Green Mix, 0.5 μl of F primer and 0.5 μl R primer was compiled for a total of 25 μl per reaction. Approximately 25 μl of master mix was added to each well of a real-time PCR plate and 2 μl of cDNA from the cells to be tested was added to each well. Each sample was triplicated on a 96 well PCR plate. Analyses of data were performed initially using SPSS 13.0 software accompanied with the PCR machine. The results were statistically analyzed and graphed using Prism 5 (Graphpad, Inc., San Diego, CA). Primers for real-time RT-PCR were shown below.
ChIP analysis
For performing ChIP analysis, cells were trypsinized with 0.25% trypsin, washed twice and resuspended in PBS with 0.05% formaldehyde for 10 min at room temperature on a rotating platform. Crosslinking reaction was stopped by adding 57 μl of 1.25 m Glycine to the sample and incubated for 5 min at RT on rotating platform. The cells were spun down, washed and resuspended in 100 μl Buffer B (Diagenode LowCell ChIP Kit, Mountain View, CA) containing 1 mm PMSF and 0.1% protease inhibitor cocktail, incubated for 10 min on ice and were sonicated (Sonicator S-4000, Misonix, Farmingdale, NY) at amplitude 99, pulse on 30 s, pulse off 30 s for 15–25 min. The magnetic immunoprecipitation procedure is according to the Diagenode LowCell ChIP kit protocol (Cat. Kch-mglow-G48, Diagenode). Input DNA purification was processed with PCR Purification Kit (Cat. 28106, Qiagen). Antibodies against FLAG (Sigma-Aldrich, St. Louis, MO, F1804) and ERα (Santa Cruze, Santa Cruz, CA, SC-53493) were used for the ChIP assay.
Histology and immuneflorence staining
For histology, mammary tissues were fixed in 10% formalin, blocked in paraffin, sectioned, stained with hematoxylin and eosin and examined by light microscopy. Detection of primary antibodies was performed using the Zymed Histomouse SP Kit (Zymed, South San Francisco, CA, USA) according to the manufacturer’s instructions. Antibodies for BrdU (from Covance, Princeton, NJ, USA), phospho-H2AX (JWB301, from Upstate, Lake Placid, NY, USA) and phospho-histone 3 (from Upstate, Lake Placid, NY, USA) were used for immuneflorence staining following standard protocols. Fluorescent signals were measured and quantified using the ImageJ program (National Cancer Institute, Bethesda, MD). For immunofluorescent detection of apoptotic cells, the ApopTag→ Fluorescein in Situ Apoptosis Detection kit by Millipore was used according to manufacturer’s instructions.
Allograft experiments
BRCA1-MT cancer cells were injected into the fourth mammary fat pad of 5–6-week-old female nude mice at 1 × 10⁶ cells/100 μl per spot. When the tumors became palpable (~200 mm3, mice were randomly assigned to 4 groups of 5 mice each for the following treatment: (1) PBS (control), (2) cisplatin (6 mg/kg, injected i.p., twice a week), (3) MK-1775 (in 0.5% methylcellulose and 30 mg/kg p.o., twice a week) or (4) a combination of cisplatin and MK-1775. Tumor volumes were measured twice a week with a caliper and calculated as previously described (34). Tumor volume was calculated in mm3 by the following equation: V = (a2 × b)/2, where a is the width of the tumor (small diameter) and b the length (large diameter), both in millimeters. The protocols for animal studies were approved by the ACUC of University of Macau.
Statistical analysis
For Microarray, gene expression data generated by the Affymetrix MOE430 chip (three samples per condition) were imported to GeneSpring for analysis. Absence and presence call for each probe was made by MAS5. Differentially expressed genes were identified between any two conditions (fold-change > 1.5 and P < 0.05; t-test); probes labeled by absence on both duplicates in either condition were discarded. All experiments that require statistical analysis were done in triplication and P-value of Student’s t-test was calculated accordingly. *P < 0.05 and **P < 0.01.
Supplementary Material
Acknowledgements
We thank members of the Deng Laboratory for critical discussions.
Conflict of Interest statement. None declared.
Funding
Intramural Research Program of NIDDK, NIH, USA; the Chair Professor Grant; Start-Up Research Grant; University of Macau (MYRG2016-00132-FHS and MYRG2016-00139); Science and Technology Development Fund (FDCT) (065/2015/A2 and 094/2015/A3 to C.X.D. and 027/2015/A1 to X.X.).
References
- 1. Inman J.L., Robertson C., Mott J.D. and Bissell M.J. (2015) Mammary gland development: cell fate specification, stem cells and the microenvironment. Development, 142, 1028–1042. [DOI] [PubMed] [Google Scholar]
- 2. Cardiff R.D., Anver M.R., Gusterson B.A., Hennighausen L., Jensen R.A., Merino M.J., Rehm S., Russo J., Tavassoli F.A., Wakefield L.M., Ward J.M. and Green J.E. (2000) The mammary pathology of genetically engineered mice: the consensus report and recommendations from the Annapolis meeting. Oncogene, 19, 968–988. [DOI] [PubMed] [Google Scholar]
- 3. Visvader J.E. (2009) Keeping abreast of the mammary epithelial hierarchy and breast tumorigenesis. Genes Dev., 23, 2563–2577. [DOI] [PMC free article] [PubMed] [Google Scholar]
- 4. Yu Q.C., Verheyen E.M. and Zeng Y.A. (2016) Mammary development and breast cancer: a Wnt perspective. Cancers (Basel), 8(7), pii: E65. [DOI] [PMC free article] [PubMed] [Google Scholar]
- 5. Patel V.N., Pineda D.L. and Hoffman M.P. (2017) The function of heparan sulfate during branching morphogenesis. Matrix Biol., 57--58, 311–323. [DOI] [PMC free article] [PubMed] [Google Scholar]
- 6. Nistico P., Di Modugno F., Spada S. and Bissell M.J. (2014) β1 and β4 integrins: from breast development to clinical practice. Breast Cancer Res., 16, 459. [DOI] [PMC free article] [PubMed] [Google Scholar]
- 7. Berryhill G.E., Trott J.F. and Hovey R.C. (2016) Mammary gland development—it’s not just about estrogen. J. Dairy Sci., 99, 875–883. [DOI] [PMC free article] [PubMed] [Google Scholar]
- 8. Radler P.D., Wehde B.L. and Wagner K.U. (2017) Crosstalk between STAT5 activation and PI3K/AKT functions in normal and transformed mammary epithelial cells. Mol. Cell. Endocrinol., 451, 31–39. [DOI] [PMC free article] [PubMed] [Google Scholar]
- 9. McBryan J. and Howlin J. (2017) Pubertal mammary gland development: elucidation of in vivo morphogenesis using murine models. Methods Mol. Biol., 1501, 77–114. [DOI] [PubMed] [Google Scholar]
- 10. Alberg A.J. and Helzlsouer K.J. (1997) Epidemiology, prevention, and early detection of breast cancer. Curr. Opin. Oncol., 9, 505–511. [DOI] [PubMed] [Google Scholar]
- 11. Zhang J. and Powell S.N. (2005) The role of the BRCA1 tumor suppressor in DNA double-strand break repair. Mol. Cancer Res., 3, 531–539. [DOI] [PubMed] [Google Scholar]
- 12. Brody L.C. and Biesecker B.B. (1998) Breast cancer susceptibility genes. BRCA1 and BRCA2. Medicine (Baltimore), 77, 208–226. [DOI] [PubMed] [Google Scholar]
- 13. Eccles D.M. and Pichert G. (2005) Familial non-BRCA1/BRCA2-associated breast cancer. Lancet Oncol., 6, 705–711. [DOI] [PubMed] [Google Scholar]
- 14. Corso G., Feroce I., Intra M., Toesca A., Magnoni F., Sargenti M., Naninato P., Caldarella P., Pagani G., Vento A. et al. (2018) BRCA1/2 germline missense mutations: a systematic review. Eur. J. Cancer Prev., 27, 279–286. [DOI] [PubMed] [Google Scholar]
- 15. Marquis S.T., Rajan J.V., Wynshaw-Boris A., Xu J., Yin G.Y., Abel K.J., Weber B.L. and Chodosh L.A. (1995) The developmental pattern of Brca1 expression implies a role in differentiation of the breast and other tissues. Nat. Genet., 11, 17–26. [DOI] [PubMed] [Google Scholar]
- 16. Xu X., Wagner K.U., Larson D., Weaver Z., Li C., Ried T., Hennighausen L., Wynshaw-Boris A. and Deng C.X. (1999) Conditional mutation of Brca1 in mammary epithelial cells results in blunted ductal morphogenesis and tumour formation. Nat. Genet., 22, 37–43. [DOI] [PubMed] [Google Scholar]
- 17. Xu X., Qiao W., Linke S.P., Cao L., Li W.M., Furth P.A., Harris C.C. and Deng C.X. (2001) Genetic interactions between tumor suppressors Brca1 and p53 in apoptosis, cell cycle and tumorigenesis. Nat. Genet., 28, 266–271. [DOI] [PubMed] [Google Scholar]
- 18. Weaver Z., Montagna C., Xu X., Howard T., Gadina M., Brodie S.G., Deng C.X. and Ried T. (2002) Mammary tumors in mice conditionally mutant for Brca1 exhibit gross genomic instability and centrosome amplification yet display a recurring distribution of genomic imbalances that is similar to human breast cancer. Oncogene, 21, 5097–5107. [DOI] [PubMed] [Google Scholar]
- 19. Brodie S.G., Xu X., Qiao W., Li W.M., Cao L. and Deng C.X. (2001) Multiple genetic changes are associated with mammary tumorigenesis in Brca1 conditional knockout mice. Oncogene, 20, 7514–7523. [DOI] [PubMed] [Google Scholar]
- 20. Bachelier R., Li C., Qiao W., Furth P.A., Lubet R.A. and Deng C.X. (2005) Effects of bilateral oophorectomy on mammary tumor formation in breast cancer associated Gene 1 (Brca1) mutant mice. Oncol. Rep., 14, 1117–1120. [PubMed] [Google Scholar]
- 21. Li W., Xiao C., Vonderhaar B.K. and Deng C.X. (2007) A role of estrogen/ERalpha signaling in BRCA1-associated tissue-specific tumor formation. Oncogene, 26, 7204–7212. [DOI] [PubMed] [Google Scholar]
- 22. Deng C.X. (2006) BRCA1: cell cycle checkpoint, genetic instability, DNA damage response, and cancer evolution. Nucleic Acids Res., 34, 1416–1426. [DOI] [PMC free article] [PubMed] [Google Scholar]
- 23. Xu X., Weaver Z., Linke S.P., Li C., Gotay J., Wang X.W., Harris C.C., Ried T. and Deng C.X. (1999) Centrosome amplification and a defective G2-M cell cycle checkpoint induce genetic instability in BRCA1 exon 11 isoform-deficient cells. Mol. Cell, 3, 389–395. [DOI] [PubMed] [Google Scholar]
- 24. Masuda T., Xu X., Dimitriadis E.K., Lahusen T. and Deng C.X. (2016) “DNA binding region” of BRCA1 affects genetic stability through modulating the intra-S-phase checkpoint. Int. J. Biol. Sci., 12, 133–143. [DOI] [PMC free article] [PubMed] [Google Scholar]
- 25. Willis N.A., Chandramouly G., Huang B., Kwok A., Follonier C., Deng C. and Scully R. (2014) BRCA1 controls homologous recombination at Tus/Ter-stalled mammalian replication forks. Nature, 510, 556–559. [DOI] [PMC free article] [PubMed] [Google Scholar]
- 26. Deng C.X. (2014) Conditional knockout mouse models of cancer. Cold Spring Harb. Protoc., 2014, 1217–1233. [DOI] [PubMed] [Google Scholar]
- 27. Lahusen T.J., Kim S.J., Miao K., Huang Z., Xu X. and Deng C.X. (2018) BRCA1 function in the intra-S checkpoint is activated by acetylation via a pCAF/SIRT1 axis. Oncogene, 37, 2343–2350. [DOI] [PubMed] [Google Scholar]
- 28. Celis J.E. and Celis A. (1985) Cell cycle-dependent variations in the distribution of the nuclear protein cyclin proliferating cell nuclear antigen in cultured cells: subdivision of S phase. Proc. Natl. Acad. Sci. U. S. A., 82, 3262–3266. [DOI] [PMC free article] [PubMed] [Google Scholar]
- 29. Lei M. and Tye B.K. (2001) Initiating DNA synthesis: from recruiting to activating the MCM complex. J. Cell Sci., 114, 1447–1454. [DOI] [PubMed] [Google Scholar]
- 30. Kamada K. (2012) The GINS complex: structure and function. Subcell. Biochem., 62, 135–156. [DOI] [PubMed] [Google Scholar]
- 31. Zech J. and Dalgaard J.Z. (2014) Replisome components—post-translational modifications and their effects. Semin. Cell Dev. Biol., 30, 144–153. [DOI] [PubMed] [Google Scholar]
- 32. Brisken C. and O'Malley B. (2010) Hormone action in the mammary gland. Cold Spring Harb. Perspect. Biol., 2, a003178. [DOI] [PMC free article] [PubMed] [Google Scholar]
- 33. Burek M., Steinberg K. and Forster C.Y. (2014) Mechanisms of transcriptional activation of the mouse claudin-5 promoter by estrogen receptor alpha and beta. Mol. Cell. Endocrinol., 392, 144–151. [DOI] [PubMed] [Google Scholar]
- 34. Vazquez-Ortiz G., Chisholm C., Xu X., Lahusen T.J., Li C., Sakamuru S., Huang R., Thomas C.J., Xia M. and Deng C. (2014) Drug repurposing screen identifies lestaurtinib amplifies the ability of the poly (ADP-ribose) polymerase 1 inhibitor AG14361 to kill breast cancer associated gene-1 mutant and wild type breast cancer cells. Breast Cancer Res., 16, R67. [DOI] [PMC free article] [PubMed] [Google Scholar]
- 35. Prall O.W., Rogan E.M. and Sutherland R.L. (1998) Estrogen regulation of cell cycle progression in breast cancer cells. J. Steroid Biochem. Mol. Biol., 65, 169–174. [DOI] [PubMed] [Google Scholar]
- 36. Zou R., Zhong X., Wang C., Sun H., Wang S., Lin L., Sun S., Tong C., Luo H., Gao P. et al. (2015) MDC1 enhances estrogen receptor-mediated transactivation and contributes to breast cancer suppression. Int. J. Biol. Sci., 11, 992–1005. [DOI] [PMC free article] [PubMed] [Google Scholar]
- 37. Barone I., Brusco L. and Fuqua S.A. (2010) Estrogen receptor mutations and changes in downstream gene expression and signaling. Clin. Cancer Res., 16, 2702–2708. [DOI] [PMC free article] [PubMed] [Google Scholar]
- 38. Gruber C.J., Gruber D.M., Gruber I.M., Wieser F. and Huber J.C. (2004) Anatomy of the estrogen response element. Trends Endocrinol. Metab., 15, 73–78. [DOI] [PubMed] [Google Scholar]
- 39. Saleh-Gohari N., Bryant H.E., Schultz N., Parker K.M., Cassel T.N. and Helleday T. (2005) Spontaneous homologous recombination is induced by collapsed replication forks that are caused by endogenous DNA single-strand breaks. Mol. Cell Biol., 25, 7158–7169. [DOI] [PMC free article] [PubMed] [Google Scholar]
- 40. Renaud E., Barascu A. and Rosselli F. (2016) Impaired TIP60-mediated H4K16 acetylation accounts for the aberrant chromatin accumulation of 53BP1 and RAP80 in Fanconi anemia pathway-deficient cells. Nucleic Acids Res., 44, 648–656. [DOI] [PMC free article] [PubMed] [Google Scholar]
- 41. Zeman M.K. and Cimprich K.A. (2014) Causes and consequences of replication stress. Nat. Cell Biol., 16, 2–9. [DOI] [PMC free article] [PubMed] [Google Scholar]
- 42. Pichierri P., Ammazzalorso F., Bignami M. and Franchitto A. (2011) The Werner syndrome protein: linking the replication checkpoint response to genome stability. Aging (Albany NY), 3, 311–318. [DOI] [PMC free article] [PubMed] [Google Scholar]
- 43. Pichierri P. and Rosselli F. (2004) The DNA crosslink-induced S-phase checkpoint depends on ATR-CHK1 and ATR-NBS1-FANCD2 pathways. EMBO J., 23, 1178–1187. [DOI] [PMC free article] [PubMed] [Google Scholar]
- 44. Martin S.A. and Ouchi T. (2005) BRCA1 phosphorylation regulates caspase-3 activation in UV-induced apoptosis. Cancer Res., 65, 10657–10662. [DOI] [PubMed] [Google Scholar]
- 45. Turner J.M., Aprelikova O., Xu X., Wang R., Kim S., Chandramouli G.V., Barrett J.C., Burgoyne P.S. and Deng C.X. (2004) BRCA1, histone H2AX phosphorylation, and male meiotic sex chromosome inactivation. Curr. Biol., 14, 2135–2142. [DOI] [PubMed] [Google Scholar]
- 46. Yarden R.I., Pardo-Reoyo S., Sgagias M., Cowan K.H. and Brody L.C. (2002) BRCA1 regulates the G2/M checkpoint by activating Chk1 kinase upon DNA damage. Nat. Genet., 30, 285–289. [DOI] [PubMed] [Google Scholar]
- 47. Vassilopoulos A., Xiao C., Chisholm C., Chen W., Xu X., Lahusen T.J., Bewley C. and Deng C.X. (2014) Synergistic therapeutic effect of cisplatin and phosphatidylinositol 3-kinase (PI3K) inhibitors in cancer growth and metastasis of Brca1 mutant tumors. J. Biol. Chem., 289, 24202–24214. [DOI] [PMC free article] [PubMed] [Google Scholar]
- 48. Bhattacharyya A., Ear U.S., Koller B.H., Weichselbaum R.R. and Bishop D.K. (2000) The breast cancer susceptibility gene BRCA1 is required for subnuclear assembly of Rad51 and survival following treatment with the DNA cross-linking agent cisplatin. J. Biol. Chem., 275, 23899–23903. [DOI] [PubMed] [Google Scholar]
- 49. Byrski T., Huzarski T., Dent R., Marczyk E., Jasiowka M., Gronwald J., Jakubowicz J., Cybulski C., Wisniowski R., Godlewski D., Lubinski, J. and Narod S.A. (2014) Pathologic complete response to neoadjuvant cisplatin in BRCA1-positive breast cancer patients. Breast Cancer Res. Treat., 147, 401–405. [DOI] [PubMed] [Google Scholar]
- 50. Bruck I. and Kaplan D.L. (2015) The Dbf4-Cdc7 kinase promotes Mcm2-7 ring opening to allow for single-stranded DNA extrusion and helicase assembly. J. Biol. Chem., 290, 1210–1221. [DOI] [PMC free article] [PubMed] [Google Scholar] [Retracted]
- 51. Chuang L.C., Teixeira L.K., Wohlschlegel J.A., Henze M., Yates J.R., Mendez J. and Reed S.I. (2009) Phosphorylation of Mcm2 by Cdc7 promotes pre-replication complex assembly during cell-cycle re-entry. Mol. Cell, 35, 206–216. [DOI] [PMC free article] [PubMed] [Google Scholar]
- 52. Deng C.X. and Wang R.H. (2003) Roles of BRCA1 in DNA damage repair: a link between development and cancer. Hum. Mol. Genet., 12, R113–R123. [DOI] [PubMed] [Google Scholar]
- 53. Mallepell S., Krust A., Chambon P. and Brisken C. (2006) Paracrine signaling through the epithelial estrogen receptor alpha is required for proliferation and morphogenesis in the mammary gland. Proc. Natl. Acad. Sci. U. S. A., 103, 2196–2201. [DOI] [PMC free article] [PubMed] [Google Scholar]
- 54. Mulac-Jericevic B., Lydon J.P., DeMayo F.J. and Conneely O.M. (2003) Defective mammary gland morphogenesis in mice lacking the progesterone receptor B isoform. Proc. Natl. Acad. Sci. U. S. A., 100, 9744–9749. [DOI] [PMC free article] [PubMed] [Google Scholar]
- 55. Brisken C., Kaur S., Chavarria T.E., Binart N., Sutherland R.L., Weinberg R.A., Kelly P.A. and Ormandy C.J. (1999) Prolactin controls mammary gland development via direct and indirect mechanisms. Dev. Biol., 210, 96–106. [DOI] [PubMed] [Google Scholar]
- 56. Russo J. and Russo I.H. (2006) The role of estrogen in the initiation of breast cancer. J. Steroid Biochem. Mol. Biol., 102, 89–96. [DOI] [PMC free article] [PubMed] [Google Scholar]
- 57. Izawa N., Wu W., Sato K., Nishikawa H., Kato A., Boku N., Itoh F. and Ohta T. (2011) HERC2 interacts with Claspin and regulates DNA origin firing and replication fork progression. Cancer Res., 71, 5621–5625. [DOI] [PubMed] [Google Scholar]
- 58. Siegelmann-Danieli N., Tamir A., Zohar H., Papa M.Z., Chetver L.L., Gallimidi Z., Stein M.E. and Kuten A. (2003) Breast cancer in women with recent exposure to fertility medications is associated with poor prognostic features. Ann. Surg. Oncol., 10, 1031–1038. [DOI] [PubMed] [Google Scholar]
- 59. Fan S., Wang J., Yuan R., Ma Y., Meng Q., Erdos M.R., Pestell R.G., Yuan F., Auborn K.J., Goldberg I.D. and Rosen E.M. (1999) BRCA1 inhibition of estrogen receptor signaling in transfected cells. Science, 284, 1354–1356. [DOI] [PubMed] [Google Scholar]
- 60. Shukrun M., Jabareen A., Abou-Kandil A., Chamias R., Aboud M. and Huleihel M. (2014) HTLV-1 tax oncoprotein inhibits the estrogen-induced-ER α-mediated BRCA1 expression by interaction with CBP/p300 cofactors. PloS One, 9, e89390. [DOI] [PMC free article] [PubMed] [Google Scholar]
- 61. Hilakivi-Clarke L. (2000) Estrogens, BRCA1 and breast cancer. Cancer Res., 60, 4993–5001. [PubMed] [Google Scholar]
- 62. Wang L. and Di L.J. (2014) BRCA1 and estrogen/estrogen receptor in breast cancer: where they interact? Int. J. Biol. Sci., 10, 566–575. [DOI] [PMC free article] [PubMed] [Google Scholar]
- 63. Foulkes W.D., Metcalfe K., Sun P., Hanna W.M., Lynch H.T., Ghadirian P., Tung N., Olopade O.I., Weber B.L., McLennan J. et al. (2004) Estrogen receptor status in BRCA1- and BRCA2-related breast cancer: the influence of age, grade, and histological type. Clin. Cancer Res., 10, 2029–2034. [DOI] [PubMed] [Google Scholar]
- 64. Long D.T., Joukov V., Budzowska M. and Walter J.C. (2014) BRCA1 promotes unloading of the CMG helicase from a stalled DNA replication fork. Mol. Cell, 56, 174–185. [DOI] [PMC free article] [PubMed] [Google Scholar]
- 65. Schlacher K., Wu H. and Jasin M. (2012) A distinct replication fork protection pathway connects Fanconi anemia tumor suppressors to RAD51-BRCA1/2. Cancer Cell, 22, 106–116. [DOI] [PMC free article] [PubMed] [Google Scholar]
- 66. Ray Chaudhuri A., Callen E., Ding X., Gogola E., Duarte A.A., Lee J.E., Wong N., Lafarga V., Calvo J.A., Panzarino N.J. et al. (2016) Replication fork stability confers chemoresistance in BRCA-deficient cells. Nature, 535, 382–387. [DOI] [PMC free article] [PubMed] [Google Scholar]
- 67. Okada S. and Ouchi T. (2003) Cell cycle differences in DNA damage-induced BRCA1 phosphorylation affect its subcellular localization. J. Biol. Chem., 278, 2015–2020. [DOI] [PubMed] [Google Scholar]
- 68. Tibbetts R.S., Cortez D., Brumbaugh K.M., Scully R., Livingston D., Elledge S.J. and Abraham R.T. (2000) Functional interactions between BRCA1 and the checkpoint kinase ATR during genotoxic stress. Genes Dev., 14, 2989–3002. [DOI] [PMC free article] [PubMed] [Google Scholar]
- 69. Min W., Bruhn C., Grigaravicius P., Zhou Z.W., Li F., Kruger A., Siddeek B., Greulich K.O., Popp O., Meisezahl C. et al. (2013) Poly(ADP-ribose) binding to Chk1 at stalled replication forks is required for S-phase checkpoint activation. Nat. Commun., 4, 2993. [DOI] [PubMed] [Google Scholar]
- 70. Sorensen C.S. and Syljuasen R.G. (2012) Safeguarding genome integrity: the checkpoint kinases ATR, CHK1 and WEE1 restrain CDK activity during normal DNA replication. Nucleic Acids Res., 40, 477–486. [DOI] [PMC free article] [PubMed] [Google Scholar]
- 71. Fu H., Martin M.M., Regairaz M., Huang L., You Y., Lin C.M., Ryan M., Kim R., Shimura T., Pommier Y. and Aladjem M.I. (2015) The DNA repair endonuclease Mus81 facilitates fast DNA replication in the absence of exogenous damage. Nat. Commun., 6, 6746. [DOI] [PMC free article] [PubMed] [Google Scholar]
Associated Data
This section collects any data citations, data availability statements, or supplementary materials included in this article.