Abstract
Advanced prostate cancer displays conspicuous chromosomal instability and rampant copy number aberrations, yet the identity of functional drivers resident in many amplicons remain elusive. Here, we implemented a functional genomics approach to identify new oncogenes involved in prostate cancer progression. Through integrated analyses of focal amplicons in large prostate cancer genomic and transcriptomic datasets as well as genes upregulated in metastasis, 276 putative oncogenes were enlisted into an in vivo gain-of-function tumorigenesis screen. Among the top positive hits, we conducted an in-depth functional analysis on Pygopus family PHD finger 2 (PYGO2), located in the amplicon at 1q21.3. PYGO2 overexpression enhances primary tumor growth and local invasion to draining lymph nodes. Conversely, PYGO2 depletion inhibits prostate cancer cell invasion in vitro and progression of primary tumor and metastasis in vivo. In clinical samples, PYGO2 upregulation associated with higher Gleason score and metastasis to lymph nodes and bone. Silencing PYGO2 expression in patient-derived xenograft models impairs tumor progression. Lastly, PYGO2 is necessary to enhance the transcriptional activation in response to ligand-induced Wnt/β-catenin signaling. Together, our results indicate that PYGO2 functions as a driver oncogene in the 1q21.3 amplicon and may serve as a potential prognostic biomarker and therapeutic target for metastatic prostate cancer.
Keywords: Prostate cancer, in vivo ORF screen, PYGO2, bone metastasis, patient-derived xenograft model
Introduction
Prostate cancer (PCa) is the most commonly diagnosed noncutaneous malignancy and the third leading cause of cancer mortality for men in the United States (1). Bone is the most frequent site for distant metastasis of PCa, which inflicts significant morbidity and mortality (2). Genomic profiling of PCa (3–7) has revealed overall lower mutation frequency compared with most solid cancer types (8), yet advanced disease is characterized by rampant genomic rearrangements and somatic copy number alterations (SCNAs) (3–7). SCNAs affect a larger fraction of the cancer genome than any other type of genetic alterations in cancer (9), underscoring the potential role of SCNAs in driving the malignant nature of PCa. Functional driver genes residing within recurrent amplifications include key PCa oncogenes such as EZH2 on 7q36.1, MYC on 8q23–24, NCOA2 on 8q13.3, and AR on Xq12 (3). Gain-of-function screens of resident genes within amplicons is a proven approach in the identification of novel oncogenes.
In this study, our screen identified PYGO2 as a putative driver of PCa progression. PYGO2 is an essential transcription co-activator with β-catenin/TCF complex for the Wnt signaling pathway in Drosophila (10). With a highly conserved plant homeodomain (PHD) in its C-terminus, PYGO2 binds to H3K4me and activates β-catenin-dependent transcriptional regulation (11). Evidence suggests that PYGO2 modulates gene transcription through both Wnt-dependent and Wnt-independent mechanisms (11). Emerging data indicate its pivotal role in multiple cancers including glioma (12), breast cancer (13), hepatic carcinoma (14), and intestinal tumors (15). Recently, PYGO2 expression was identified as a potential risk stratification marker for PSA progression in PCa following radical prostatectomy (16). PYGO2 is recruited by PCGEM1, a long non-coding RNA, to enhance AR-bound enhancer activity (17). Nevertheless, the functional contribution of PYGO2 to PCa progression, particularly bone metastasis, is not known, prompting us to explore its role in PCa biology.
Materials and Methods
Cell culture and patient-derived xenograft models
The LHMK cell line was a generous gift from William Hahn (18). LHMK and 293T (obtained from ATCC) were maintained in DMEM, 10% FBS. Prostate cancer cell lines PC-3, LNCaP, C4, C4–2, DU145 and 22Rv1 were obtained from ATCC and maintained in RPMI640, 10% FBS. L cells and L Wnt-3A cells were obtained from ATCC and maintained in DMEM, 10% FBS (for L Wnt-3A cells, 0.4 mg/ml G-418 was supplemented). ATCC provides the Human STR Profiling Cell Authentication Service to authenticate these cell lines. All cells were routinely verified as being free of mycoplasma using MycoAlert Mycoplasma Detection Kit (Lonza). Patient-derived xenograft (PDX) models were previously published and generous gifts from Dr. Nora Navone (19,20). The scramble control shRNA and PYGO2-targeting shRNA were ordered from Sigma, with sequences listed in Supplementary Table S1.
Generation of LHMK sublines for screening
The ORF lentiviral vectors in the Precision LentiORF collection were obtained from the Functional Genomics Facility at MD Anderson Cancer Center. In 96-well plates, we packaged 288 ORF lentiviruses individually and infected low-passage LHMK cells. Stable sublines were generated by blasticidin selection, with each sub-line individually expanded for the in vivo screen.
In vivo ORF screen
To evaluate the tumorigenicity of the parental cell line, LHMK cells were injected subcutaneously with 106 viable cells in a mixture of PBS:Matrigel (BD Biosciences) in NCr nude mice (Taconic), which did not form tumors 6 months post implantation. Expecting a small fraction of the candidate genes to promote tumorigenesis, we designed a multi-site subcutaneous inoculation method to reduce the number of mice needed for the screen. For each LHMK-ORF sub-line, 106 viable cells, resuspended in 50μL mixture of PBS:Matrigel, were injected subcutaneously into pre-labeled flank positions of mice (5 sites on each side of flank, so total 10 sites per mouse). The experiment was designed so that each subline was evaluated in 10 different mice, and each mouse received injections from 10 different sublines. Mice were monitored for tumor formation via caliper measurement for 8 months. We did not observed formation of more than two subcutaneous tumors on any mice in the screen. All animal experimental protocols were approved by the IACUC at MD Anderson Cancer Center.
Tissue specimens, histology and western blot
A prostate cancer tissue microarray with 80 cases and Gleason grade information was purchased (PR803b, US Biomax). Archived prostate cancer FFPE specimens of adjacent normal, primary tumor and metastasis (total n = 49) were requested from MD Anderson Cancer Center Prostate Cancer SPORE program (Specialized Programs of Research Excellence) under approved IRB protocol at MD Anderson Cancer Center. For all clinical samples, written informed consent was obtained from the patients. The studies were conducted in accordance with recognized ethical guidelines (Declaration of Helsinki, CIOMS, Belmont Report, U.S. Common Rule). H&E stain, immunohistochemical (IHC) and western blot were performed as previously described (21). Primary antibodies used include PYGO2 (HPA023689, Sigma, for IHC; GTX119726, GeneTex, for western blot), KRAS (sc-30, Santa Cruz), FGFR1, β-Catenin, c-Myc, Met, H3K4me2, H3K4me3, H3 (9740, 8480, 5605, 8198, 9725, 9751 and 4499, Cell Signaling Technology), β-actin (A2228, Sigma).
Cell proliferation and soft agar assay
For 2D proliferation, cells were seeded to 24-well plates with confluence tracked by IncuCyte (Essen BioScience) for 3 days. For soft agar assay, DMEM with 1% FBS, 0.6% LE Agarose (Lonza) was used as base layer while cells were seeded in 2×10⁴ cells/mL in DMEM with 1% FBS, 0.3% SeaPlaque Agarose as top layer (Lonza). After incubated at 37°C for 3 weeks, the colonies were stained by crystal violet and quantified.
Migration and invasion assay
Cells were first starved in DMEM with 1% FBS overnight and then seeded in serum-free DMEM at 5×10⁵ cells/200μL to the chamber inserts (BD Falcon) for migration or BioCoat Matrigel Invasion Chamber (BD Falcon) for invasion. DMEM with 10% FBS were placed at the bottom as chemoattractant. Migrated or invaded cells on the membrane were stained with crystal violet for quantification.
Quantitative RT-PCR
RNA was isolated by RNeasy Kit (Qiagen) and reversed transcribed using Superscript III cDNA synthesis Kit (Life Technology). Quantitative PCR was performed using SYBR-GreenER Kit (Life Technology). Primers are listed in Supplementary Table S1.
Functional validation using animal models
Experimental bone metastasis assay using intracardiac injection and noninvasive imaging was performed as previously reported (22). PDX models were passaged in the flank of C.B-17 SCID (Taconic) mice as previously reported (19,20). The tumors were measured by caliper and treated by intratumoral injection of 10μg siRNA targeting PYGO2 (Sigma-Aldrich, SASI_HS01_00059018, or 1:1 ratio of SASI_Hs01_00059021 and SASI_Hs02_00363399) or control siRNA (Sigma-Aldrich, SIC001) twice a week, using MaxSuppressor In Vivo RNA-LANCEr II (Bioo Scientific) following the manufacturer’s protocol and our recent report (23).
Luciferase reporter assay
TCF/LEF reporter plasmids, M50 Super 8x TOPFlash and M51 Super 8x FOPFlash (TOPFlash mutant), were gifts from Randall Moon (24) (Addgene plasmid # 12456, 12457). Activation of Wnt/β-catenin signaling was achieved by using conditioned medium from Wnt3A-secreting L cells and control L cells (25). PC3 sublines were transfected with Lipofectamine LTX Reagent (Life Technologies) following manufacturer’s protocol and the reporter assay was performed as described (26).
Statistical Analysis
Unless otherwise indicated, data represent mean ± s.d., with Student’s t-test assuming two-tailed distributions used to calculate statistical significance between groups. P<0.05 was considered statistically significant (annotation: *P < 0.05, **P < 0.01, ***P < 0.001, #P > 0.05). To display PYGO2 expression from four Oncomine transcriptomic datasets containing primary and metastatic PCa samples (3,4,27,28), log2 median-centered ratio of PYGO2 probe data were drawn as Box plot with whiskers displaying 10–90 percentile using GraphPad Prism.
Results
In vivo ORF screen identified putative genes involved in prostate cancer progression
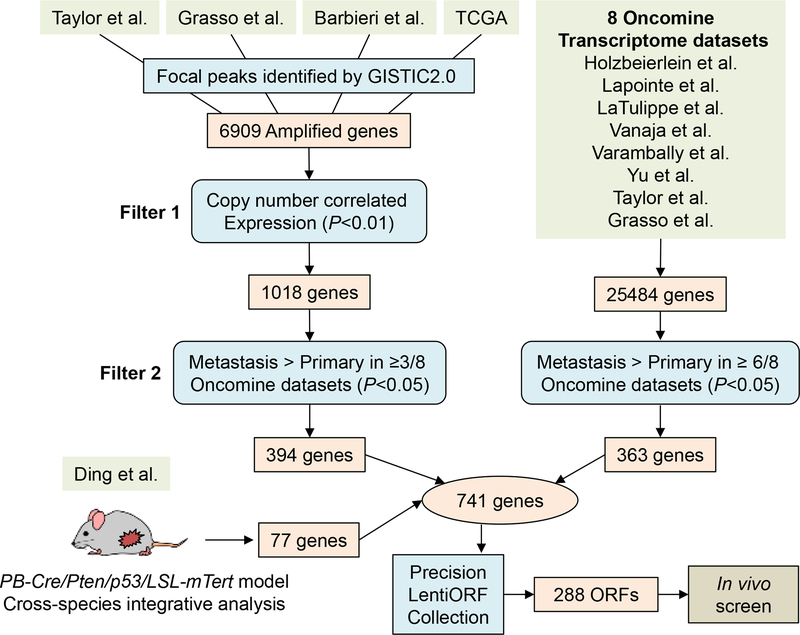
To enlist genes with putative function in promoting PCa progression, we performed an integrated oncogenomic analysis to enrich for cancer-relevant genes and cull passenger genes. First, genes with focal copy number gains were identified using GISTIC2 (29) from 4 PCa genomic datasets: Taylor et al, Grasso et al, Barbieri et al, and TCGA (3–6) (Fig. 1). This analysis resulted in 6909 genes which were further selected based on two filters: genes with copy number correlated expression in at least 1 of the 4 datasets (P<0.01) and genes with higher expression in metastasis compared with primary tumor (P<0.05) in at least 3 out of 8 Oncomine transcriptomic datasets (3,4,27,30–34). The gene expression data for these 8 datasets were directly queried from Oncomine (35). After applying the filters, 394 genes remained (Fig. 1). Second, to enrich for genes potentially contributing to metastasis, 363 genes upregulated in metastasis compared with primary tumor were identified in at least 6 out of 8 Oncomine datasets. Third, 77 amplified genes were identified from integrated analysis of our previous telomerase reactivation PCa mouse model and human PCa genomics (36). From these diverse datasets and experimental systems, a total of 741 putative metastasis-promoting genes were identified (Supplementary Table S2), among which 288 ORFs (corresponding to 276 unique genes) were available at the time of experimentation from the Precision LentiORF Collection for lentiviral overexpression and ORF screening (Supplementary Table S3).
Figure 1. Oncogenomics-informed in vivo ORF screen.
Three sources of candidate PCa genes are integrated: 394 genes located in focal amplicons (4 genomics datasets) and expressed in correlation with copy number gain and metastasis phenotype (3/8 transcriptomic datasets); 363 genes upregulated in metastasis (6/8 transcriptomic datasets), and 77 genes from our published cross-species PCa genome analysis (36). Among the total 741 candidate genes, 288 ORFs corresponding to 276 genes were available for screening.
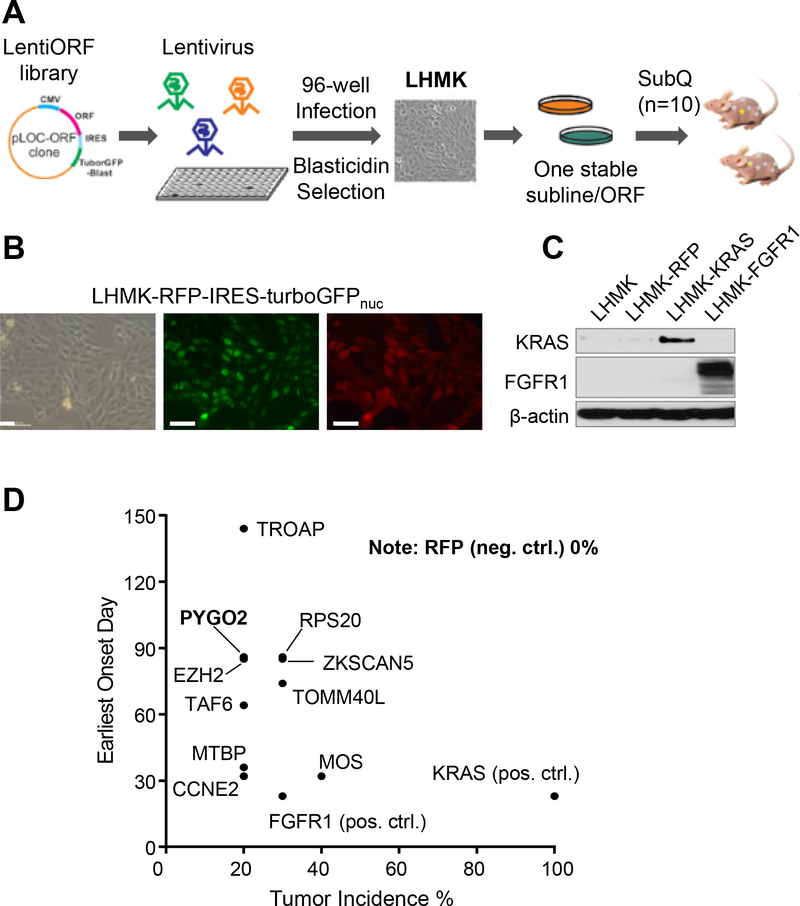
We employed LHMK cells for the in vivo screen, which were derived from primary human prostate epithelial cells after immortalization with SV40 LT and hTERT followed by transformation with MYC and PI3K (18). LHMK cells exhibit very limited tumorigenic capability when inoculated orthotopically or subcutaneously in nude mice (18), providing a suitable system to identify putative oncogenes through a gain-of-function approach. ORF-encoded lentivirus was packaged in 96-well plates and used to transduce LHMK cells, followed by blasticidin selection, to establish 288 individual ORF-expressing sublines (Fig. 2A). Overexpression of Red Fluorescent Protein (RFP) in the same LentiORF backbone was used as negative control (Fig. 2B). ORFs encoding KRAS and FGFR1 were used as positive controls (Fig. 2C), the choice of which was justified given the PCa-promoting role of RAS/MAPK (3,37) or FGF/FGFR1 signaling, respectively (38). ORF-driven overexpression was validated for a number of randomly selected genes using quantitative RT-PCR (Supplementary Fig. S1A) which all showed various levels of overexpression of the putative targets. In the screen, the 288 sublines and RFP control subline were inoculated into mice subcutaneously (n=10 for each ORF). Mice were monitored for tumor development for 8 months. While no tumor growth was detected for the RFP control (total 30 sites were tested), the positive controls KRAS and FGFR1 generated 100% and 30% incidence of tumors, respectively (Supplementary Table S4). Importantly, 38 genes were identified as positive hits based on a 10–50% tumor incidence rate (Supplementary Table S4), among which 10 genes produced more than 2 tumors out of the 10 tested sites (Fig. 2D, Supplementary Fig. S1B). The top 10 hits include EZH2, known to be frequently upregulated in advanced PCa and to promote metastasis, and CCNE2 which is overexpressed in metastatic PCa and critical for cell cycle G1/S transition (39). Notably, the presence of known PCa-promoting genes among the top hits suggests the possibility that the other genes may represent bona fide oncogenes involved in PCa progression. To rule out the possibility that the negative hits were merely due to failure of LentiORF-driven gene overexpression, we randomly selected 26 negative hits from the lenti-ORF infected cells and showed that 23 out of 26 genes were upregulated more than 2-fold (Supplementary Fig. S1C).
Figure 2. In vivo ORF screen identified genes promoting prostate tumorigenesis.
A, Procedure for lentivirus packaging, ORF stable overexpression in LHMK and in vivo tumorigenesis screen. B, Images of LHMK overexpressing the control vector RFP-IRES-turboGFPnuc. Scale bar, 50μm. C, ORF-driven KRAS or FGFR1 overexpression in LHMK, confirmed with western blot. D, Top hits with 20% or higher incidence rate from the in vivo screen.
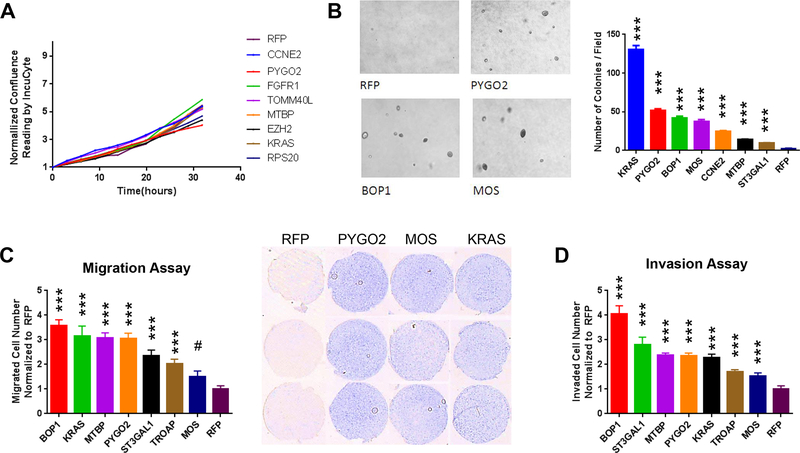
Reasoning that in vitro assays could complement the in vivo result to illuminate biological effects, we performed proliferation, migration and invasion assays for the sublines of the top hits. While meager differences were observed in the two-dimensional (2D) growth curve assay (Fig. 3A), soft-agar assay showed that sublines overexpressing genes like KRAS, PYGO2, MOS, CCNE2 and MTBP could form significantly more colonies than RFP control (Fig. 3B). The gain of colony formation potential by genes such as PYGO2, MOS and MTBP (with functions in PCa uncharacterized) was accompanied by their effect on increased migration and invasion (Fig. 3C,D). Together, the robustness of PYGO2 in the in vivo ORF screen coupled with strong effect in the 3D colony assay (second only to KRAS) (Fig. 3B) prompted further functional investigation of this putative PCa promoting gene. Overexpression of BOP1 (block of proliferation 1) led to strongest enhancement of migration and invasion (Fig. 3C,D). Located at 8q24.3, BOP1 is close to MYC at 8q24.21. These two genes tend to co-amplified in the broad amplification peak at 8q24 (Supplementary Fig. S1D), which is commonly attributed to the oncogenic function of MYC. Therefore, we reasoned that the amplification of BOP1 might be, at least partly, a passenger effect from MYC amplification, which would make a study on BOP1 less significant in terms of finding independent biomarker and/or therapeutic target for PCa. TOMM40L overexpression led to higher tumor incidence rate and shorter onset day than PYGO2 (Fig. 2D). The function of TOMM40L was not studied before. The commercially available reagents for TOMM40L are limited, making it difficult to perform clinical characterization of its expression and related functional studies.
Figure 3. Candidate PCa genes promote soft agar colony formation, migration and invasion.
A, Normalized confluence curves on 2D culture for selected top hit genes showing modest change of cell proliferation. B, Significant increase of colony formation on soft agar by selected top hit genes compared with RFP control. C, Significant increase of cell migration by selected top hit genes compared with RFP control. D, Significant increase of cell invasion by selected top hit genes compared with RFP control. Representative images of invaded cells are shown.
PYGO2 expression is correlated with higher Gleason score and bone metastasis
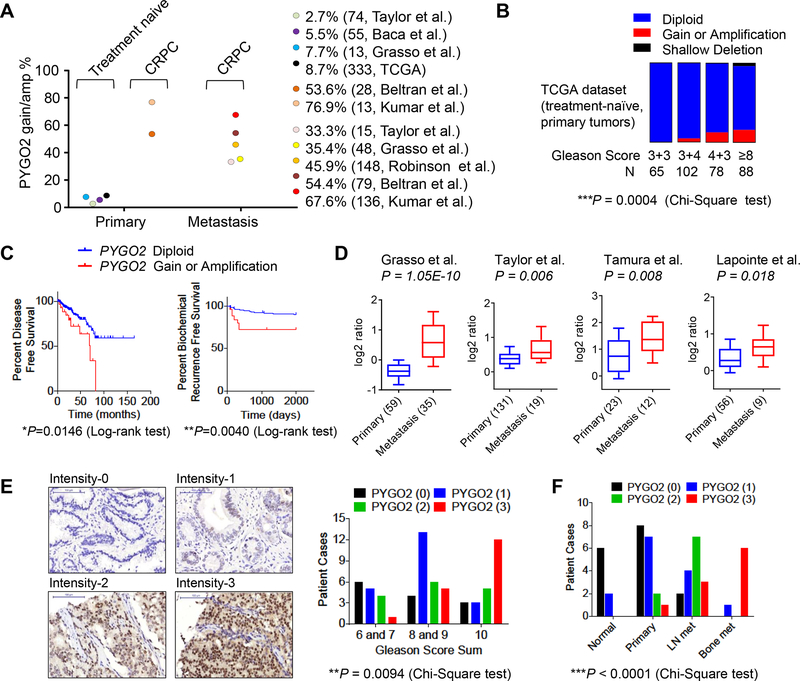
PYGO2 resides on cytoband 1q21.3, a region amplified in advanced PCa (3,40,41) but containing no known definitive PCa oncogenes. When surveyed through PCa databases in cBioPortal, the status of PYGO2 copy number was retrieved from 7 studies (3,4,6,7,42–44) and showed higher gain or amplification in primary CRPC (53.6–76.9%) or metastasis CRPC (33.3–67.7%) compared with treatment-naïve primary PCa (2.7–8.7%, Fig. 4A). In the TCGA dataset, PYGO2 gain/amplification is associated with higher Gleason score in treatment-naïve primary PCa (Fig. 4B), as well as shorter disease-free survival and shorter biochemical recurrence (Fig. 4C). Copy number correlated expression of PYGO2 is evident across several datasets (Supplementary Fig. S2A). Regarding metastasis, PYGO2 is significantly upregulated at the transcriptional level in metastatic PCa compared with primary tumors (Fig. 4D). At the protein level, tissue microarray (TMA) analysis showed that, while PYGO2 expression was not detectable in normal prostate, stronger PYGO2 expression was correlated with higher Gleason score (Fig. 4E). Furthermore, from an archived clinical PCa sample cohort at MD Anderson Cancer Center which includes normal, primary tumors, lymph node metastases and bone metastases, IHC analysis showed that PYGO2 expression was highly upregulated in metastases (Fig. 4F). The clinical expression analysis, in addition to the in vivo functional screen and in vitro functional validation, strongly support a direct role of PYGO2 in promoting PCa progression.
Figure 4. PYGO2 is amplified in PCa and correlates with higher Gleason score and metastasis.
A, Frequency of PYGO2 copy number gain and amplification in a variety of PCa genomics datasets categorized by disease site and treatment. B, Fraction of PYGO2 copy number status in different Gleason score categories in the TCGA dataset. C, Correlation of PYGO2 copy number status with disease-free survival (n=329) or biochemical recurrence (n=281) in the TCGA dataset. D, PYGO2 mRNA expression level in primary tumor and metastasis in 4 PCa studies with data compiled from Oncomine. E, In the TMA, PYGO2 expression as measured by immunohistochemistry and plotted against Gleason grade categories. F, In an archived PCa clinical cohort from MD Anderson Cancer Center, PYGO2 expression plotted against categories as normal prostate, primary prostate tumor, lymph node (LN) metastases and bone metastases.
PYGO2 overexpression promotes prostate tumor growth and invasion to lymph nodes
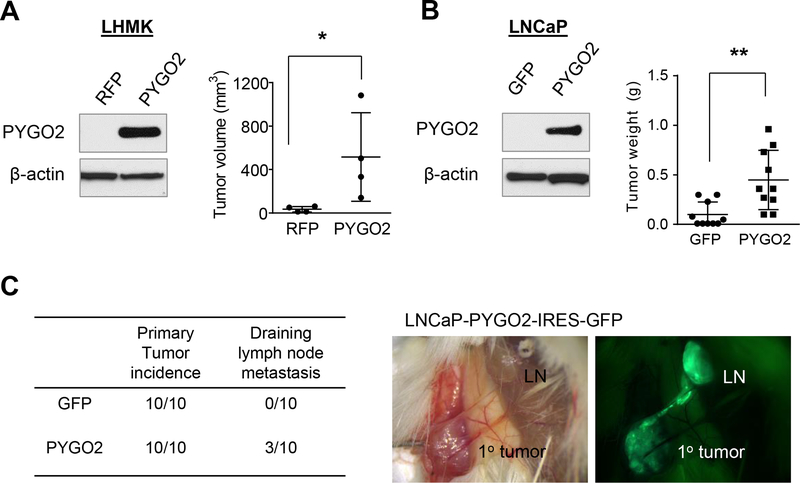
To determine if PYGO2 upregulation enhances PCa progression, we first re-tested the LHMK sublines expressing RFP or PYGO2 by subcutaneous inoculation in NSG mice. The LHMK-PYGO2 subline formed significantly larger tumors as compared to RFP controls (Fig. 5A, Supplementary Fig. S2B). To test the pro-tumor function of PYGO2 in a different PCa cell line, we overexpressed PYGO2 in LNCaP, which also has a low endogenous level of PYGO2 (Fig. 5B). Compared with GFP control, PYGO2 overexpression led to significant increase of subcutaneous tumor weight (Fig. 5B). Based on the IRES-GFP cassette in the overexpression vector, we identified GFP+ tumor cells in draining lymph nodes in 3 out of 10 mice inoculated with LNCaP-PYGO2 cells (Fig. 5C, Supplementary Fig. S2C). Thus, PYGO2 overexpression promotes both primary tumor growth and regional lymph node invasion.
Figure 5. PYGO2 overexpression promotes PCa tumor growth and invasion to draining lymph nodes.
A, PYGO2 overexpression in LHMK cells significantly increased subcutaneous tumor growth in mice (n=4). B, PYGO2 overexpression in LNCaP significantly increased subcutaneous tumor growth in mice (n=10). C, Summary of tumor incidence by LNCaP sublines and fluorescence imaging showing the invasion of LNCaP-PYGO2-IRES-GFP from subcutaneous tumor to local draining lymph node. In (A) and (B), *P < 0.05, **P < 0.01, Mann-Whitney test.
PYGO2 depletion inhibits prostate cancer metastasis and PDX tumor growth
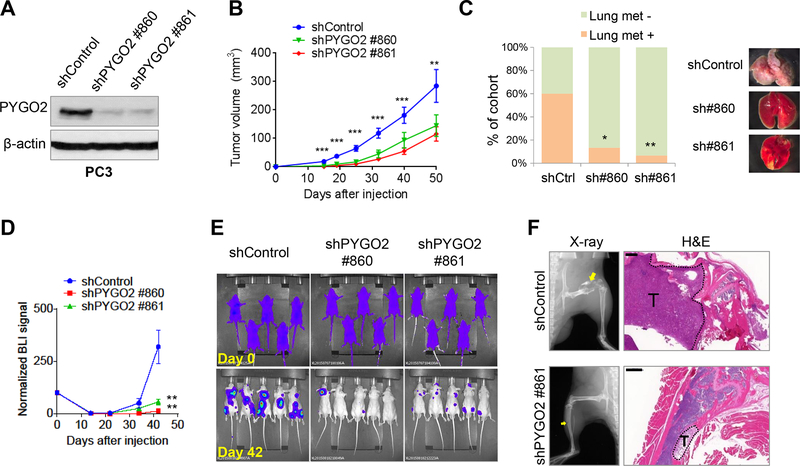
To determine whether PYGO2 is required for PCa progression, we used two independent PYGO2 shRNA vectors to deplete PYGO2 levels in the aggressive PCa cell line PC3 (45) (Fig. 6A). PYGO2 knockdown resulted in modest decrease in cell proliferation in vitro (Supplementary Fig. S3A) but significant reduction of cell invasion (Supplementary Fig. S3B). When inoculated subcutaneously in mice, PYGO2 knockdown cells showed reduced tumorigenic potential (Fig. 6B). To evaluate whether PYGO2 knockdown affects spontaneous metastasis of PC3 to lung, we removed the subcutaneous tumors at Day 50 post-inoculation and assessed metastasis formation in lung 2 months later by gross inspection and histology. While 60% of mice previously inoculated with the PC3-shControl subline developed spontaneous lung metastasis nodules, less than 20% of mice inoculated with the shPYGO sublines of PC3 developed lung metastasis nodules (Fig. 6C, Supplementary Fig. S3C). Expression of PYGO2 in PC3 cells remains pronounced in lung metastasis (Supplementary Fig. S3D).
Figure 6. PYGO2 silencing reduces primary tumorigenicity and metastatic potential of PC3 cells.
A, PYGO2 knockdown by two independent shRNA clones in PC3 shown by western blot. B, Significant decrease of subcutaneous tumor size by PYGO2 knockdown in PC3 (n=25 for each group). Data represent mean ± SEM. C, Incidence of spontaneous lung metastasis from subcutaneous tumors formed by PC3 sublines (n=15 for each group). *P < 0.05, **P < 0.01, Fisher’s exact test. D,E, Weakened bone colonization ability by PYGO2 knockdown in PC3-TR cells, shown by both bioluminescence signals (D, normalized to Day 0) and representative images (E, n=7 for each group). Data represent mean ± SEM. F, Osteolysis in the long bones induced by PC3-TR sublines, shown by X-ray radiographs and H&E staining. Scale bar, 500μm.
As bone is the most frequent site of distant metastasis of PCa, we performed intracardiac injection to compare the bone colonization capability of shControl and shPYGO2 sublines of PC3 after labeling PC3 with a triple reporter (TR) containing firefly luciferase, GFP and thymidine kinase (46). Noninvasive bioluminescence imaging revealed that PYGO2 knockdown impaired the ability of PC3-TR cells to colonize the bone and form osteolytic lesions (Fig. 6D–F). PYGO2 is also expressed by a few other PCa cell lines, including 22Rv1, C4 and C4–2 (Supplementary Fig. S3E).
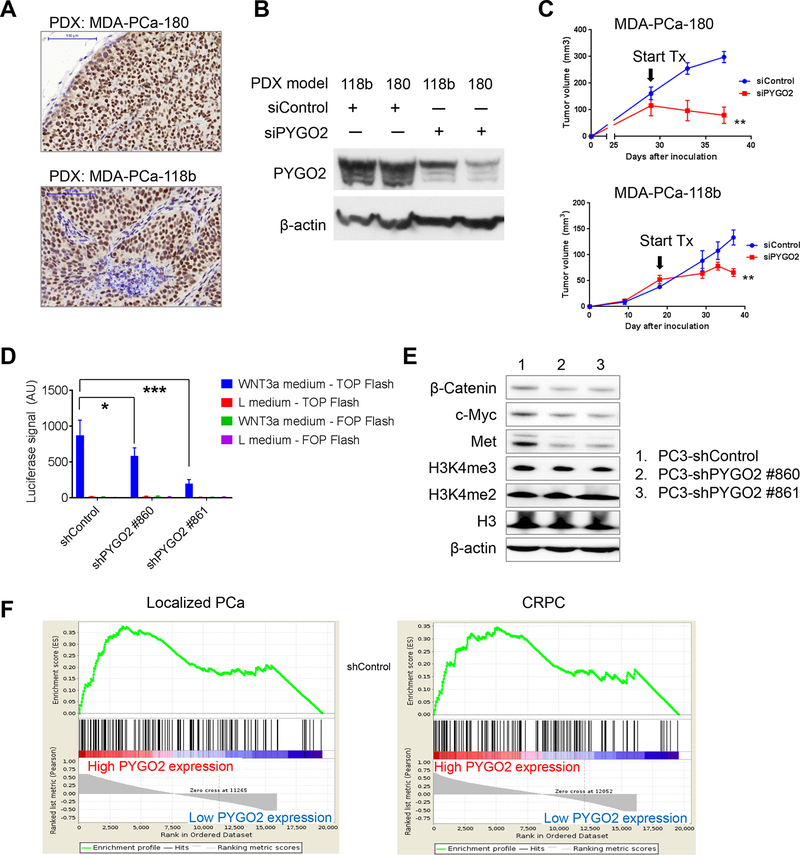
As PDX models more closely resemble the clinical disease, we examined the effect of targeting PYGO2 in two PDX models: MDA-PCa-180 (derived from primary CRPC) (19) and MDA-PCa-118b (derived from bone metastatic CRPC) (20). We first performed IHC for PYGO2 and detected high PYGO2 expression in both models (Fig. 7A). Through intratumoral infusion of siRNA (either scramble control or PYGO2-targeting), we were able to significantly attenuate PYGO2 protein level (Fig. 7B). In both models, PYGO2-targeting siRNA treatment inhibited subcutaneous PDX tumor growth (Fig. 7C). For MDA-PCa-180, we also demonstrated the anti-tumor effect by an independent siRNA mixture (Supplementary Fig. S3F). Spontaneous metastasis to lung or bone from the PDX tumors was not detected based on histological evaluation, and metastasis was not reported to occur in these two models previously (19,20). These results support PYGO2 as a therapeutic target for PCa.
Figure 7. Intratumoral infusion of PYGO2 siRNA blocks prostate tumor growth in PDX models.
A, Strong nuclear expression of PYGO2 in two PDX models of CRPC, detected by IHC. Scale bar, 100μm. B, Reduction of PYGO2 level in two PDX models by PYGO2-targeting siRNA, detected by western blot. C, PYGO2-targeting siRNA (Sigma-Aldrich, SASI_HS01_00059018) impaired PDX tumor growth. Arrows indicate the start day for intratumoral siRNA infusion. D, Luciferase assay measuring effect of PYGO2 knockdown in PC3 on the response to Wnt-3A-mediated TOPFlash reporter activity. E, Effect of PYGO2 knockdown in PC3 on the expression of indicated proteins, detected by western blot. F, GSEA analysis for transcriptomic samples. Samples from Grasso et al. (4), dichotomized by normalized expression level of the PYGO2 probe A_23_P411953. KEGG Wnt pathway with 138 genes was the gene set for the analysis. Localized PCa and CRPC samples were analyzed separately, with FDR q-value being 0.051 and 0.070, respectively. Both FDR q-values are <0.25, the recommended FDR cutoff value by the GSEA User Guide.
To explore the function of PYGO2 as a co-activator of the Wnt/β-catenin pathway in the context of PCa, we compared the ability of PC3-shControl and PC3-shPYGO2 sublines to activate the Wnt/β-catenin reporter TOPFlash (24) under conditioned medium from L Wnt-3A cells (25). As control, FOPFlash and conditioned medium from L cells were used. Interestingly, PYGO2 knockdown significantly reduced the Wnt-3A-induced TOPFlash activity (Fig. 7D). At the protein level, PYGO2 knockdown moderately decreased expression of β-catenin and Wnt/β-catenin targets c-Myc and Met (Fig. 7E). PYGO2 knockdown affected little on H3K4me2 and H3K4me3 levels (Fig. 7E). Our results on the connection of PYGO2 with Wnt signaling was supported by the gene set enrichment analysis (GSEA) showing that Wnt pathway is enriched in both localized PCa and CRPC samples with high PYGO2 expression phenotype (Fig. 7F).
Discussion
In summary, through functional screen and analysis of recurrently amplified genes in PCa, we identified PYGO2 as a PCa-promoting gene capable of driving disease progression and metastasis. Another candidate PCa gene located on 1q21.3, CREB3L4 (a.k.a. AIbZIP, an androgen-regulated gene), has been reported as highly expressed in PCa (47). However, CREB3L4 is distinct in that its expression is neither correlated with copy number gain (3) nor upregulated in metastatic PCa when we surveyed the 8 Oncomine datasets (P>0.5 for all datasets). In fact, CREB3L4 was not among the 60 of 178 genes located in 1q21.2-q22 with transcript levels correlated with copy number gain (3). From the 60 genes in 1q21.2-q22, 13 genes passed our gene selection filters and 6 genes (ENSA, LYSMD1, RPRD2, FLAD1, KRTCAP2, and PYGO2) were screened with available lentiviral ORFs. Only PYGO2 emerged as a functional hit in our tumor models. Our results indicate that PYGO2 promotes primary tumor growth, lymph node invasion and bone metastasis. Together, we conclude that PYGO2 is a key driver gene of 1q21.3 that is targeted for increased expression via copy number gain in PCa.
Hyperactivated Wnt signaling pathway has been increasingly identified to play important roles in promoting advanced prostate cancer, including the metastatic process and development of castration-resistant prostate cancer (48). Therefore, the implication of PYGO2 in Wnt pathway has significant clinical relevance. Future studies to investigate the molecular mechanism of PYGO2 in PCa progression will provide new opportunities to target lethal PCa. We envision at least two potential approaches to target PYGO2. First, the PHD finger in PYGO2 is responsible for binding to di- and trimethylated lysine 4 of histone H3 (H3K4me2/3). Therefore, small molecule inhibitors blocking the PHD finger (49) may serve as useful agents for PYGO2-overexpressed lethal PCa. Second, siRNAs that effectively downregulate PYGO2 in vivo may provide another avenue. siRNA or shRNA as therapeutics is being actively developed, although challenges remain in the delivery of these agents. That said, recent progress using exosomes to deliver siRNA or shRNA in vivo (50) marks a new direction for moving this idea forward.
Supplementary Material
Acknowledgements
The authors thank Dr. Denise J. Spring for manuscript proofreading; all members of the DePinho laboratory and the Lu laboratory for a variety of technical support and helpful suggestions.
Grant Support: The project was supported by R01 CA084628 (R.A. DePinho), P01CA117969 (R.A. DePinho), MDACC Knowledge Gap Award (Y.A. Wang), MDACC Prostate Cancer Moon Shot Award (R.A. DePinho, Y.A. Wang), Department of Defense Prostate Cancer Research Program Idea Development Award W81XWH-14-1-0576 (X. Lu). X. Lu is also supported by the Indiana Clinical and Translational Sciences Institute (CTSI) KL2 Young Investigator Award, which is funded in part by grants KL2TR001106 and UL1TR001108 (A. Shekhar, PI) from the National Institutes of Health, National Center for Advancing Translational Sciences, Clinical and Translational Sciences Award. S. Feng is supported by Walther Cancer Foundation Advancing Basic Cancer grants. Cancer Center Support Grant P30CA016672 (MD Anderson Cancer Center) provided facility-based experimental support. Data analysis assistance is partly supported from the Collaborative Core for Cancer Bioinformatics shared by Indiana University Simon Cancer Center (Grant P30CA082709) and Purdue University Center for Cancer Research (Grant P30CA023168) supported by the Walther Cancer Foundation.
Footnotes
Conflicts of interest disclosure: The authors declare no potential conflicts of interest.
References
- 1.Siegel RL, Miller KD, Jemal A. Cancer Statistics, 2017. CA: A Cancer Journal for Clinicians 2017;67:7–30 [DOI] [PubMed] [Google Scholar]
- 2.Gartrell BA, Saad F. Managing bone metastases and reducing skeletal related events in prostate cancer. Nat Rev Clin Oncol 2014;11:335–45 [DOI] [PubMed] [Google Scholar]
- 3.Taylor BS, Schultz N, Hieronymus H, Gopalan A, Xiao Y, Carver BS, et al. Integrative Genomic Profiling of Human Prostate Cancer. Cancer Cell 2010;18:11–22 [DOI] [PMC free article] [PubMed] [Google Scholar]
- 4.Grasso CS, Wu YM, Robinson DR, Cao X, Dhanasekaran SM, Khan AP, et al. The mutational landscape of lethal castration-resistant prostate cancer. Nature 2012;487:239–43 [DOI] [PMC free article] [PubMed] [Google Scholar]
- 5.Barbieri CE, Baca SC, Lawrence MS, Demichelis F, Blattner M, Theurillat JP, et al. Exome sequencing identifies recurrent SPOP, FOXA1 and MED12 mutations in prostate cancer. Nature Genetics 2012;44:685–9 [DOI] [PMC free article] [PubMed] [Google Scholar]
- 6.Abeshouse A, Ahn J, Akbani R, Ally A, Amin S, Andry Christopher D, et al. The Molecular Taxonomy of Primary Prostate Cancer. Cell 2015;163:1011–25 [DOI] [PMC free article] [PubMed] [Google Scholar]
- 7.Robinson D, Van Allen EM, Wu YM, Schultz N, Lonigro RJ, Mosquera JM, et al. Integrative clinical genomics of advanced prostate cancer. Cell 2015;161:1215–28 [DOI] [PMC free article] [PubMed] [Google Scholar]
- 8.Alexandrov LB, Nik-Zainal S, Wedge DC, Aparicio SAJR, Behjati S, Biankin AV, et al. Signatures of mutational processes in human cancer. Nature 2013;500:415–21 [DOI] [PMC free article] [PubMed] [Google Scholar]
- 9.Turajlic S, Swanton C. Metastasis as an evolutionary process. Science 2016;352:169–75 [DOI] [PubMed] [Google Scholar]
- 10.Belenkaya TY, Han C, Standley HJ, Lin X, Houston DW, Heasman J, et al. pygopus Encodes a nuclear protein essential for wingless/Wnt signaling. Development 2002;129:4089–101 [DOI] [PubMed] [Google Scholar]
- 11.Epigenetics Horsley V., Wnt signaling, and stem cells: the Pygo2 connection. The Journal of Cell Biology 2009;185:761–3 [DOI] [PMC free article] [PubMed] [Google Scholar]
- 12.Zhou C, Zhang Y, Dai J, Zhou M, Liu M, Wang Y, et al. Pygo2 functions as a prognostic factor for glioma due to its up-regulation of H3K4me3 and promotion of MLL1/MLL2 complex recruitment. Sci Rep 2016;6:22066. [DOI] [PMC free article] [PubMed] [Google Scholar]
- 13.Zhang ZM, Wu JF, Luo QC, Liu QF, Wu QW, Ye GD, et al. Pygo2 activates MDR1 expression and mediates chemoresistance in breast cancer via the Wnt/beta-catenin pathway. Oncogene 2016;35:4787–97 [DOI] [PubMed] [Google Scholar]
- 14.Zhang S, Li J, Liu P, Xu J, Zhao W, Xie C, et al. Pygopus-2 promotes invasion and metastasis of hepatic carcinoma cell by decreasing E-cadherin expression. Oncotarget 2015;6:11074–86 [DOI] [PMC free article] [PubMed] [Google Scholar]
- 15.Talla SB, Brembeck FH. The role of Pygo2 for Wnt/ss-catenin signaling activity during intestinal tumor initiation and progression. Oncotarget 2016;7:80612–32 [DOI] [PMC free article] [PubMed] [Google Scholar]
- 16.Kao KR, Popadiuk P, Thoms J, Aoki S, Anwar S, Fitzgerald E, et al. PYGOPUS2 expression in prostatic adenocarcinoma is a potential risk stratification marker for PSA progression following radical prostatectomy. J Clin Pathol 2017 [DOI] [PubMed] [Google Scholar]
- 17.Yang L, Lin C, Jin C, Yang JC, Tanasa B, Li W, et al. lncRNA-dependent mechanisms of androgen-receptor-regulated gene activation programs. Nature 2013;500:598–602 [DOI] [PMC free article] [PubMed] [Google Scholar]
- 18.Berger R, Febbo PG, Majumder PK, Zhao JJ, Mukherjee S, Signoretti S, et al. Androgen-Induced Differentiation and Tumorigenicity of Human Prostate Epithelial Cells. Cancer Research 2004;64:8867–75 [DOI] [PubMed] [Google Scholar]
- 19.Tzelepi V, Zhang J, Lu J-F, Kleb B, Wu G, Wan X, et al. Modeling a Lethal Prostate Cancer Variant with Small-Cell Carcinoma Features. Clinical Cancer Research 2012;18:666–77 [DOI] [PMC free article] [PubMed] [Google Scholar]
- 20.Li ZG, Mathew P, Yang J, Starbuck MW, Zurita AJ, Liu J, et al. Androgen receptor–negative human prostate cancer cells induce osteogenesis in mice through FGF9-mediated mechanisms. The Journal of Clinical Investigation 2008;118:2697–710 [DOI] [PMC free article] [PubMed] [Google Scholar]
- 21.Lu X, Horner JW, Paul E, Shang X, Troncoso P, Deng P, et al. Effective combinatorial immunotherapy for castration-resistant prostate cancer. Nature 2017;543:728–32 [DOI] [PMC free article] [PubMed] [Google Scholar]
- 22.Lu X, Mu E, Wei Y, Riethdorf S, Yang Q, Yuan M, et al. VCAM-1 Promotes Osteolytic Expansion of Indolent Bone Micrometastasis of Breast Cancer by Engaging α4β1-Positive Osteoclast Progenitors. Cancer Cell 2011;20:701–14 [DOI] [PMC free article] [PubMed] [Google Scholar]
- 23.Zhao D, Lu X, Wang G, Lan Z, Liao W, Li J, et al. Synthetic essentiality of chromatin remodelling factor CHD1 in PTEN-deficient cancer. Nature 2017;542:484–8 [DOI] [PMC free article] [PubMed] [Google Scholar]
- 24.Veeman MT, Slusarski DC, Kaykas A, Louie SH, Moon RT. Zebrafish prickle, a modulator of noncanonical Wnt/Fz signaling, regulates gastrulation movements. Curr Biol 2003;13:680–5 [DOI] [PubMed] [Google Scholar]
- 25.Willert K, Brown JD, Danenberg E, Duncan AW, Weissman IL, Reya T, et al. Wnt proteins are lipid-modified and can act as stem cell growth factors. Nature 2003;423:448–52 [DOI] [PubMed] [Google Scholar]
- 26.Lu W, Tinsley HN, Keeton A, Qu Z, Piazza GA, Li Y. Suppression of Wnt/beta-catenin signaling inhibits prostate cancer cell proliferation. European journal of pharmacology 2009;602:8–14 [DOI] [PMC free article] [PubMed] [Google Scholar]
- 27.Lapointe J, Li C, Higgins JP, van de Rijn M, Bair E, Montgomery K, et al. Gene expression profiling identifies clinically relevant subtypes of prostate cancer. Proceedings of the National Academy of Sciences of the United States of America 2004;101:811–6 [DOI] [PMC free article] [PubMed] [Google Scholar]
- 28.Tamura K, Furihata M, Tsunoda T, Ashida S, Takata R, Obara W, et al. Molecular Features of Hormone-Refractory Prostate Cancer Cells by Genome-Wide Gene Expression Profiles. Cancer Research 2007;67:5117–25 [DOI] [PubMed] [Google Scholar]
- 29.Beroukhim R, Getz G, Nghiemphu L, Barretina J, Hsueh T, Linhart D, et al. Assessing the significance of chromosomal aberrations in cancer: Methodology and application to glioma. Proceedings of the National Academy of Sciences 2007;104:20007–12 [DOI] [PMC free article] [PubMed] [Google Scholar]
- 30.Varambally S, Yu J, Laxman B, Rhodes DR, Mehra R, Tomlins SA, et al. Integrative genomic and proteomic analysis of prostate cancer reveals signatures of metastatic progression. Cancer Cell 2005;8:393–406 [DOI] [PubMed] [Google Scholar]
- 31.Holzbeierlein J, Lal P, LaTulippe E, Smith A, Satagopan J, Zhang L, et al. Gene Expression Analysis of Human Prostate Carcinoma during Hormonal Therapy Identifies Androgen-Responsive Genes and Mechanisms of Therapy Resistance. The American Journal of Pathology 2004;164:217–27 [DOI] [PMC free article] [PubMed] [Google Scholar]
- 32.LaTulippe E, Satagopan J, Smith A, Scher H, Scardino P, Reuter V, et al. Comprehensive Gene Expression Analysis of Prostate Cancer Reveals Distinct Transcriptional Programs Associated with Metastatic Disease. Cancer Research 2002;62:4499–506 [PubMed] [Google Scholar]
- 33.Vanaja DK, Cheville JC, Iturria SJ, Young CYF. Transcriptional Silencing of Zinc Finger Protein 185 Identified by Expression Profiling Is Associated with Prostate Cancer Progression. Cancer Research 2003;63:3877–82 [PubMed] [Google Scholar]
- 34.Yu YP, Landsittel D, Jing L, Nelson J, Ren B, Liu L, et al. Gene Expression Alterations in Prostate Cancer Predicting Tumor Aggression and Preceding Development of Malignancy. Journal of Clinical Oncology 2004;22:2790–9 [DOI] [PubMed] [Google Scholar]
- 35.Rhodes DR, Yu J, Shanker K, Deshpande N, Varambally R, Ghosh D, et al. ONCOMINE: A Cancer Microarray Database and Integrated Data-Mining Platform. Neoplasia 2004;6:1–6 [DOI] [PMC free article] [PubMed] [Google Scholar]
- 36.Ding Z, Wu CJ, Jaskelioff M, Ivanova E, Kost-Alimova M, Protopopov A, et al. Telomerase reactivation following telomere dysfunction yields murine prostate tumors with bone metastases. Cell 2012;148:896–907 [DOI] [PMC free article] [PubMed] [Google Scholar]
- 37.Mulholland DJ, Kobayashi N, Ruscetti M, Zhi A, Tran LM, Huang J, et al. Pten Loss and RAS/MAPK Activation Cooperate to Promote EMT and Metastasis Initiated from Prostate Cancer Stem/Progenitor Cells. Cancer Research 2012;72:1878–89 [DOI] [PMC free article] [PubMed] [Google Scholar]
- 38.Yang F, Zhang Y, Ressler SJ, Ittmann MM, Ayala GE, Dang TD, et al. FGFR1 Is Essential for Prostate Cancer Progression and Metastasis. Cancer Research 2013;73:3716–24 [DOI] [PMC free article] [PubMed] [Google Scholar]
- 39.Wu Z, Cho H, Hampton GM, Theodorescu D. Cdc6 and cyclin E2 are PTEN-regulated genes associated with human prostate cancer metastasis. Neoplasia 2009;11:66–76 [DOI] [PMC free article] [PubMed] [Google Scholar]
- 40.Alers JC, Rochat J, Krijtenburg PJ, Hop WC, Kranse R, Rosenberg C, et al. Identification of genetic markers for prostatic cancer progression. Laboratory investigation; a journal of technical methods and pathology 2000;80:931–42 [DOI] [PubMed] [Google Scholar]
- 41.El Gedaily A, Bubendorf L, Willi N, Fu W, Richter J, Moch H, et al. Discovery of new DNA amplification loci in prostate cancer by comparative genomic hybridization. Prostate 2001;46:184–90 [DOI] [PubMed] [Google Scholar]
- 42.Baca SC, Prandi D, Lawrence MS, Mosquera JM, Romanel A, Drier Y, et al. Punctuated evolution of prostate cancer genomes. Cell 2013;153:666–77 [DOI] [PMC free article] [PubMed] [Google Scholar]
- 43.Kumar A, Coleman I, Morrissey C, Zhang X, True LD, Gulati R, et al. Substantial interindividual and limited intraindividual genomic diversity among tumors from men with metastatic prostate cancer. Nat Med 2016;22:369–78 [DOI] [PMC free article] [PubMed] [Google Scholar]
- 44.Beltran H, Prandi D, Mosquera JM, Benelli M, Puca L, Cyrta J, et al. Divergent clonal evolution of castration-resistant neuroendocrine prostate cancer. Nat Med 2016;22:298–305 [DOI] [PMC free article] [PubMed] [Google Scholar]
- 45.Kaighn ME, Narayan KS, Ohnuki Y, Lechner JF, Jones LW. Establishment and characterization of a human prostatic carcinoma cell line (PC-3). Investigative urology 1979;17:16–23 [PubMed] [Google Scholar]
- 46.Lu X, Wang Q, Hu G, Van Poznak C, Fleisher M, Reiss M, et al. ADAMTS1 and MMP1 proteolytically engage EGF-like ligands in an osteolytic signaling cascade for bone metastasis. Genes Dev 2009;23:1882–94 [DOI] [PMC free article] [PubMed] [Google Scholar]
- 47.Qi H, Fillion C, Labrie Y, Grenier J, Fournier A, Berger L, et al. AIbZIP, a Novel bZIP Gene Located on Chromosome 1q21.3 That Is Highly Expressed in Prostate Tumors and of Which the Expression Is Up-Regulated by Androgens in LNCaP Human Prostate Cancer Cells. Cancer Research 2002;62:721–33 [PubMed] [Google Scholar]
- 48.Murillo-Garzon V, Kypta R. WNT signalling in prostate cancer. Nat Rev Urol 2017;14:683–96 [DOI] [PubMed] [Google Scholar]
- 49.Wagner EK, Nath N, Flemming R, Feltenberger JB, Denu JM. Identification and characterization of small molecule inhibitors of a plant homeodomain finger. Biochemistry 2012;51:8293–306 [DOI] [PMC free article] [PubMed] [Google Scholar]
- 50.Kamerkar S, LeBleu VS, Sugimoto H, Yang S, Ruivo CF, Melo SA, et al. Exosomes facilitate therapeutic targeting of oncogenic KRAS in pancreatic cancer. Nature 2017;546:498–503 [DOI] [PMC free article] [PubMed] [Google Scholar]
Associated Data
This section collects any data citations, data availability statements, or supplementary materials included in this article.


