

ABSTRACT
This study aimed to evaluate vascular endothelial growth factor (VEGF) and pentraxin 3 (PTX-3) as predictive and diagnostic markers in differentiating severe dengue from non-severe dengue. The study was conducted in Ampang Health Clinic, Ampang Hospital and Serdang Hospital. The plasma levels of VEGF and PTX-3 were compared between severe dengue and non-severe dengue by ELISA from the day of presentation until discharged. Multiple logistic regression was used to develop predictive and diagnostic models by incorporating other clinical parameters. The receiver operating characteristics (ROC) analysis was used to assess the accuracy of the biomarkers and the developed models. Eighty-two patients were recruited, 29 with severe dengue and four died. The Area Under the Curve (AUC) was statistically significant in VEGF as diagnostic marker at Day 2 and 3 of illness with sensitivity of 80.00%-100.00% and specificity of 76.47%-80.00%. The predictive model with AUC of 0.84 (p < 0.01) has a sensitivity of 100.00% and specificity of 79.25% for predicting severe dengue. The diagnostic model with AUC of 0.71 (p < 0.01) has a sensitivity of 76.19% and specificity of 73.58% for diagnosing severe dengue. The AUC for PTX-3 was not statistically significant. VEGF may be used in combination with other clinical parameters to predict the severity of the disease. As a single biomarker, it may be used as an adjunct investigation to support the diagnosis of severe dengue. PTX-3 was not able to differentiate severe dengue from non-severe dengue.
KEYWORDS: Severe dengue, screening, predict, diagnostic, accuracy
Introduction
Dengue virus infection is estimated to have affected 390 million individuals per year globally [1]. The World Health Organization (WHO) estimated 500,000 people with severe dengue require hospitalization each year and about 2.5% of those affected die [2]. Malaysia is a dengue endemic country with incidence rate approximately four times higher in individuals of 15 years of age or more than in individuals younger than 15 [3].
The WHO 2009 classification lists warning signs that are predictors for severe dengue [4]. Patients who present with these warning signs will be admitted to hospital for close monitoring. However, the specificity and the positive predictive value is poor which could lead to high false-positive rates [5,6]. In addition, the clinicians are unable to predict severity accurately, leading to unnecessary hospital admissions for intensive monitoring.
The WHO 2009 classification for severe dengue consisted of three subcategories: severe plasma leakage, severe bleeding and severe organ involvement [4]. Severe plasma leakage is determined by shock (also known as dengue shock syndrome) or fluid accumulation with respiratory distress, and severe bleeding is determined by clinical judgement. Severe organ involvement is determined by the AST or ALT of more than 1000 U/L if liver is affected, heart or central nervous system involvement. Fever in dengue infection was defined as more than 37.5 Celsius (>37.5°C)[4].
A pilot study was conducted to evaluate five biomarkers: neopterin, vascular endothelial growth factor (VEGF), thrombomodulin, vascular cell adhesion molecule 1 and pentraxin 3 (PTX-3). VEGF and PTX-3 were the best two potential biomarkers in differentiating severe dengue from non-severe dengue cases [7]. VEGF is specifically involved in plasma leakage when the endothelial cells in the blood vessels are damaged releasing VEGF as a response to repair the damaged cells. As with other inflammatory cytokines, the VEGF increases the vascular permeability which leads to plasma leakage [8,9]. Depending on the quantity of the leakage, the patient can go into shock or recover if the leak is minimal [4].
Thus far, there is no in vitro study on PTX-3 in the pathogenesis of dengue infection. Based on other studies, PTX-3 is related but distinct from the C-reactive protein which is produced by a variety of cells such as macrophages and endothelial cells. These cells are activated during infection thereby releasing PTX-3 into the blood stream [10].
Detectable PTX-3 and VEGF levels in plasma can serve as predictive markers to determine patients’ admission or as diagnostic investigations. However, many studies conducted could not substantiate its use as predictive, diagnostic and prognostic markers because of the lack of generalizability and inappropriate study design [11–15]. Therefore, this study’s objective was to evaluate VEGF and PTX-3 as predictive and diagnostic markers in differentiating severe dengue from non-severe dengue.
Materials and methods
Study design
This was a prospective study in which the dengue patients were monitored from the day of presentation until hospital discharge. The blood samples were obtained daily when the patient was recruited. Hence, the trend of biomarkers for each day of the illness can be assessed. The plasma levels of VEGF and PTX-3 were compared between severe dengue and non-severe dengue (combined dengue without warning signs and dengue with warning signs). The demography and clinical diagnosis were obtained using a standard data extraction form. The treating physicians were blinded from the biomarker test results.
Settings
This study was conducted in Ampang Health Clinic, Ampang Hospital and Serdang Hospital from January 2016 until October 2017. The patients were recruited consecutively from the outpatient and emergency departments. Ampang Health Clinic is a primary care facility where the majority of patients will seek their first consultation with the general practitioner. Ampang and Serdang Hospitals are the referral centres for the primary health clinics in Malaysia if patients require specialist care. The hospitals also cater for emergency care for dengue patients.
Recruitment criteria
Inclusion criteria: patients aged 15 or older; presented within the first three days (72 hours) of illness; and had tested NS1 Ag positive.
Exclusion criteria: pregnant; patient with autoimmune disorder, haematological disorder, cancer, cardiovascular disease or on long term warfarin and aspirin.
Specimen transport, storage and analysis
The daily blood samples were obtained either separately by the investigator or concurrently with the managing health practitioner/s. The blood samples were collected using ethylenediaminetetraacetic acid tube. The blood samples were centrifuged and the plasma was obtained. The plasma was transported in an ice box until it could be stored at −20 degree Celsius (°C). The blood samples were stored at 4 °C if the test was performed within 24–48 hours.
Biomarker assay and validation procedure
A commercial enzyme-linked immunosorbent assay (ELISA) kit was purchased to compare with the ‘in-house’ optimised ELISA test kit. The ELISA procedure was optimised similar to the commercial test kit with the exception of a shorter duration (around one to two hours). The detailed ELISA procedure can be found in Appendix A.
The reason for optimising is to reduce the cost and duration of the test performed. The duration needed to produce a result with the commercial test kit of PTX-3 (Human Pentraxin 3/TSG-14 Immunoassay, DPTX30, R&D Systems, Inc, Minneapolis, USA) and VEGF (Human VEGF-A, Platinum ELISA, BMS277/2/BMS277/2TEN, eBioscience, Bender MedSystems GmbH, Vienna, Austria) was approximately six hours. The levels of VEGF and PTX-3 was measured separately using an optimised sandwich ELISA.
The Spearman’s correlation coefficient which is also known as validity coefficient was calculated to compare between the commercial ELISA kits and the optimised ELISA kits. The precision of optimized ELISA protocols was determined by coefficient variation (CV) expressed in percentage. CV is defined as standard deviation divided by the mean of the biomarker level. CV is calculated in intra-assay and inter-assay precision. The validity of the optimised ELISA kit was based on 20 samples. (The complete data set can be found in Appendix A)
Diagnosis of dengue infection
The NS1 Ag rapid test kit from Panbio has a sensitivity of 71.9% (95% confidence interval (CI) 64.1–78.9) and specificity of 99% (95% CI 83.1–99.4) [16]. Virus isolation and reverse-transcription polymerase chain reaction (RT-PCR) was performed to determine the virus serotypes. Failure to serotype the virus can occur due to inadequate plasma or serum samples, virus no longer present in the plasma after day three of illness or repeated freeze-thaw cycle that could degrade the viral RNA.
Dengue IgM assay was performed to confirm the dengue status of the patients. Secondary dengue infection was determined by positive dengue IgG assay on the blood samples collected within the first four days of illness. Dengue IgM and IgG ELISA tests were performed using commercial test kits from SD Bioline. Dengue IgM test has a sensitivity and specificity of 96.4% and 98.9%, respectively. Dengue IgG test has a sensitivity and specificity of 98.8% and 99.2%, respectively. All blood tests were performed in the same lab using the same equipment. The laboratory technicians were blinded from the diagnosis to avoid bias. Other blood investigation results (full blood count and liver function test) were recorded from the laboratory of the healthcare centres. The biomarker analysis and the test performed by the healthcare centres were conducted on the tubes of blood collected at the same time from the patients.
Statistical analysis
The calculated sample size was based on the previous study conducted [7,17]. With a power of 80%, the total sample size was 90 patients. An interim analysis was performed when the total sample size had achieved more than 60%. The details of the sample size calculations can be found in Appendix B.
Univariate analysis of biomarker
A receiver operating characteristics (ROC) analysis was used to analyse the biomarker levels for each day comparing severe dengue and non-severe dengue. The analysis included biomarker levels up to the day before they developed severe dengue. This was to ensure the results produced are valid for prediction.
Predictive model using multivariable analysis
The logistic regression model was employed to develop a predictive model by identifying other clinical parameters that can be incorporated with the biomarkers. The outcome variable for the multivariable logistic regression model was severe dengue and non-severe dengue. Other predictor variables were age, gender, race, IgG status, dengue serotype, PTX-3, VEGF, white blood cell (WBC) count, platelet (PLT), haematocrit (HCT), alanine aminotransferase (ALT), and aspartate aminotransferase (AST) levels.
A backward likelihood ratio (LR) was used to build the predictive model. The equation of the model was used to calculate various cut-offs and its corresponding sensitivity and specificity in the ROC curve. The cut-off from the equation was the log odds denoted by ‘ln(p/1-p)’.
Diagnostic model using multivariable analysis
The multivariable analysis included only biomarker levels on the day the severe dengue diagnoses were made. Biomarker levels for severe dengue were compared with non-severe dengue by stratifying the analysis according to the day of illness and without any stratification.
Similarly, logistic regression was employed to develop a diagnostic model by incorporating the same variables as in the predictive model. However, the patient with encephalopathy was removed to improve the diagnostic model. The logistic regression model cut-off values were chosen after a ROC analysis was performed.
Both the predictive and diagnostic models were constructed using data with valid, non-missing data and subsequently validated in the full data set. The prediction model was developed based on 44 patients and the diagnostic model was developed based on 60 patients.
Cut-off values selection
The cut-off value and its sensitivity and specificity were presented only if it was statistically significant. The best few cut-offs for all models were chosen based on Youden’s index and clinical applicability. Youden’s index is an index which provides a guide to select a well-balanced sensitivity and specificity. A p-value of less than 0.05 was considered statistically significant. Statistical Package for Social Science (SPSS Version 20) was used in the statistical analysis.
Ethics statement
This study was approved by the Medical Research & Ethics Committee (MREC), Ministry of Health Malaysia (NMRR-15–1045-25,937) and the study was registered in ClinicalTrials.gov (NCT02606019). All adult subjects were provided informed consent, and a parent or guardian of any child participant was provided informed consent on the child’s behalf. The informed consent was provided in writing to the participants.
Results
Assay validation
The validity coefficients for PTX-3 and VEGF were 0.778 and 0.830, respectively. The validity coefficient ranges from zero to one with the highest being perfectly correlated. The intra-assay CV for VEGF and PTX-3 was 13.52% and 5.04%, respectively. The inter-assay CV for VEGF and PTX-3 was 20.35% and 19.88%, respectively.
Patients’ characteristics
A total of 82 patients with positive NS1 Ag test were included into this study. Acute dengue infection status of nine patients cannot be confirmed by IgM test or serotyping. The characteristics of patients were tabulated in Table 1. Samples that were not tested for the biomarkers were deemed as missing data accounting for 7.83%. The untested samples were due to insufficient plasma obtained and inability to obtain blood samples from the patients. Five patients were excluded due to lost from follow-up (patient did not turn up in the clinic) which was not included into the study.
Table 1.
Characteristics of all included patients.
| Severe dengue (n = 29) | Non-severe dengue (n = 53) | |
|---|---|---|
| Male, n (%) | 12 (41.40) | 35 (66.00) |
| Female, n (%) | 17 (58.60) | 18 (34.00) |
| Race and nationality, n (%) | ||
| Malay | 22 (75.90) | 38 (71.70) |
| Chinese | 2 (6.90) | 10 (18.90) |
| Indian | 1 (3.40) | 4 (7.50) |
| Other Malaysian | 1 (3.40) | 1 (1.90) |
| Other non-Malaysian | 3 (10.30) | 0 (0.00) |
| Serotype (57 samples detected), n (%) | ||
| 1 | 7 (28.00) | 11 (34.38) |
| 2 | 13 (52.00) | 13 (40.63) |
| 3 | 3 (12.00) | 5 (15.63) |
| 4 | 0 (0.00) | 1 (3.13) |
| 1 & 2 | 0 (0.00) | 2 (6.25) |
| 2 & 3 | 2 (8.00) | 0 (0.00) |
| Number of secondary dengue (positive IgG), n (%) | 9 (31.00) | 8 (15.10)* |
| Age (years), mean (SD) | 34.38 (15.96) | 30.17 (13.36) |
| Day of discharge from care #, median (IQR) | 7 (2) | 6 (2) |
| Day of defervescence #, median (IQR) | 4 (2) | 4 (2) |
Abbreviation: n, number of patients, SD, standard deviation; IQR, interquartile range; NA, not applicable.
*Two patients were not able to test IgG serology due to insufficient plasma.
#According to the day of illness.
Among the 28 severe dengue patients, 78.60% had severe plasma leakage alone leading to circulatory shock and respiratory distress. Severe bleeding in all cases was due to upper gastrointestinal bleed. Severe organ involvement in all cases was due to severe hepatitis with the exception of one case of encephalopathy. The complications that occurred in patients with severe dengue are described in Table 2. Seven severe dengue patients were transfused with blood product and four died. One non-severe dengue patient has anaemia, one severe dengue patient has hypertension and another severe dengue patient has both diabetes and hypertension.
Table 2.
The complication occurred in patients who are diagnosed with severe dengue.
| Complications | Number of patients(%) |
|---|---|
| Severe plasma leakage | 22 (78.60) |
| Severe plasma leakage and severe bleeding | 1 (3.60) |
| Severe plasma leakage, severe bleeding and severe organ involvement | 2 (7.10) |
| Severe plasma leakage and severe organ involvement | 2 (7.10) |
| Severe organ involvement* | 1 (3.60) |
*Dengue encephalopathy was diagnosed in one patient.
Note: one patient had severe dengue diagnosis but the complication was not documented.
The accuracy of univariate analysis of biomarkers
The mean and 95% CI of PTX-3 and VEGF levels of each day were displayed in Figures 1 and 2, respectively. The removal of one patient with encephalopathy did not change the Area Under the Curve (AUC) significantly in all models for both biomarkers. Hence, the result of the analysis that was tabulated in Tables 3–5 included this patient with encephalopathy as part of the analysis. None of the AUC were statistically significant except VEGF as a diagnostic marker at Day two and three of illness with AUC of 0.88 (95% CI: 0.73, 1.00) and 0.78 (95% CI: 0.60, 0.95), respectively. The best two cut-offs of VEGF level for the statistically significant AUC models were tabulated in Table 6.
Table 4.
Receiver operating characteristics of PTX-3 and VEGF as diagnostic markers stratified according to the day of illness.
| Day of illness | Number of cases (SD: Non-SD) |
AUC (95% CI) |
|
|---|---|---|---|
| PTX-3 | VEGF | ||
| 1 | 2:2 | 0.50 (0.00, 1.00) | 0.50 (0.00, 1.00) |
| 2 | 5:15 | 0.68 (0.34, 1.00) | 0.88 (0.73, 1.00)* |
| 3 | 10:51 | 0.45 (0.23, 0.66) | 0.78 (0.60, 0.95)* |
| 4 | 1:40 | 0.85 (0.74, 0.96) | 0.33 (0.00, 0.72) |
| 5 | 3: 35 | 0.68 (0.48, 0.88) | 0.50 (0.11, 0.88) |
Abbreviation: SD, severe dengue; Non-SD, non-severe dengue; AUC, area under the curve; CI, confidence interval.
*p < 0.05
Figure 1.
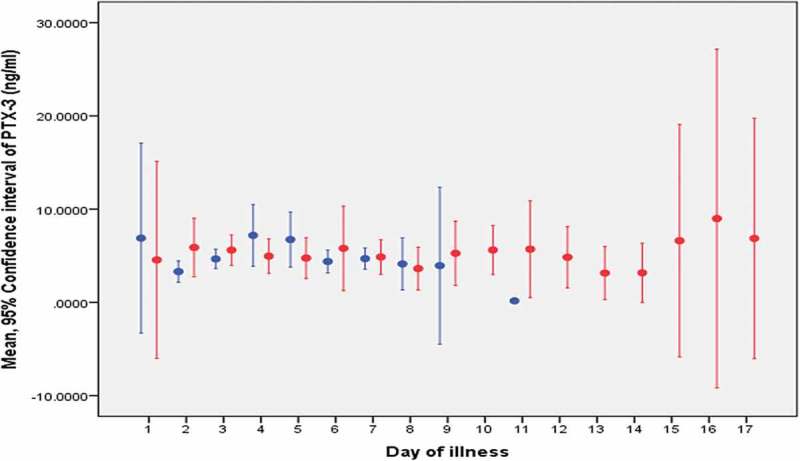
The mean PTX-3 level for each day of illness.
Non-severe dengue is represented by the blue line: -Severe dengue is represented by the red line: -Note: Dot represents the mean and the line represents the confidence interval of the biomarker.
Figure 2.
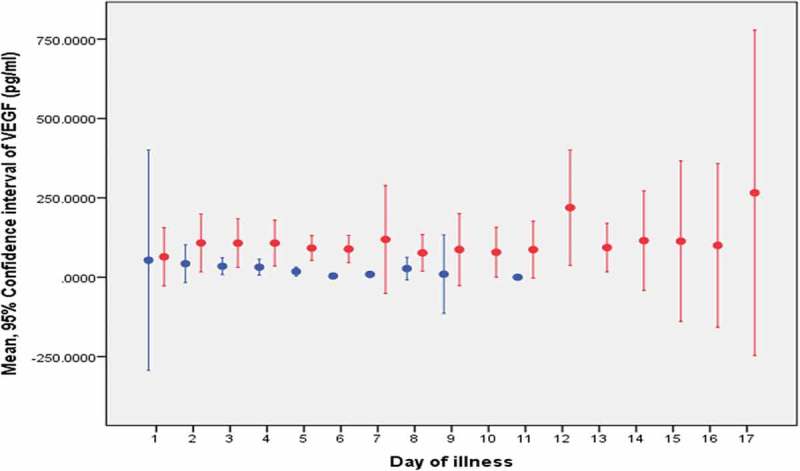
The mean VEGF level for each day of illness.
Non-severe dengue is represented by the blue line: -Severe dengue is represented by the red line: -Note: Dot represents the mean and the line represents the confidence interval of the biomarker.
Table 3.
Receiver operating characteristics of PTX-3 and VEGF as predictive markers.
| AUC (95% CI) | |
|---|---|
| PTX-3 | VEGF |
| 0.41 (0.15, 0.68) | 0.54 (0.29, 0.78) |
Abbreviation: AUC, area under the curve; CI, confidence interval.
Table 5.
Receiver operating characteristics of PTX-3 and VEGF as diagnostic markers without stratification of the day of illness.
| AUC (95% CI) | |
|---|---|
| PTX-3 | VEGF |
| 0.50 (0.34, 0.66) | 0.71 (0.56, 0.86)* |
Abbreviation: AUC, area under the curve; CI, confidence interval.
*p < 0.05
Table 6.
Cut-offs of VEGF levels as a diagnostic marker.
| VEGF level (pg/ml) | Diagnostic accuracy (%) |
|
|---|---|---|
| Sensitivity | Specificity | |
| Day 2 of illness | ||
| 37.50 | 100.00 | 80.00 |
| 50.53 | 80.00 | 80.00 |
| Day 3 of illness | ||
| 19.03 | 80.00 | 76.47 |
| 48.65 | 70.00 | 88.24 |
| Without stratification | ||
| 19.36 | 76.19 | 62.26 |
| 44.59 | 66.67 | 79.25 |
The accuracy of predictive and diagnostic models by multivariable analysis
The best predictive and diagnostic model with p < 0.001 hase been tabulated in Table 7. The predictive model with AUC of 0.84 (95% CI: 0.73, 0.94, p < 0.01) has a sensitivity of 100.00% and specificity of 79.25% for predicting severe dengue with a cut-off of 0.34. The diagnostic model with AUC of 0.71 (95% CI: 0.60, 0.85, p < 0.01) has a sensitivity of 76.19% and specificity of 73.58% for diagnosing severe dengue with a cut-off of −1.07. However, with a cut-off of −3.22, the sensitivity and specificity was 100.00% and 3.77%, respectively. The equation for prognostic model was:
Table 7.
Logistic regression model for prediction and diagnosis.
| Predictor variables | Beta (SE) |
|---|---|
| Prediction model | |
| Constant | 217.03 (25,421.02) |
| Gender = Female | −110.35 (13,928.20) |
| VEGF | 0.33 (36.36) |
| WBC | −16.86 (2335.28) |
| HCT | −6.15 (633.79) |
| ALT | 0.46 (52.53) |
| Diagnostic model | |
| Constant | −4.27 (1.19) |
| VEGF | 0.01 (0,00) |
| PLT | 0.02 (0,01) |
| ALT | 0.01 (0,00) |
Abbreviation: WBC, white blood cell count; HCT, haematocrit; ALT, alanine aminotransferase; PLT, platelet.
ln(p/1-p) = 217.03 + (−110.35) x Gender(Female = 1) + 0.33 x VEGF + (−16.86) x WBC + (−6.15) x HCT + 0.46 x ALT
The equation for the diagnostic model is:
ln(p/1-p) = (−4.27) + 0.01 x VEGF + 0.02 x PLT + 0.01 x ALT
Discussion
VEGF in combination with other variables was able to predict the complication of dengue infection i.e. severe dengue. VEGF as a single marker was also able to diagnose severe dengue on day two and day three of illness. However, PTX-3 was not able to predict and diagnose the severe dengue.
VEGF is involved in the pathogenesis of many diseases such as cancer and diabetic retinopathy particularly in the healing process of damaged blood vessels [18]. However, VEGF is also involved in the pathogenesis of plasma leakage of dengue infection [19]. Hence, a higher VEGF level is expected in a dengue patient who develops circulatory shock [13–15]. One patient with dengue encephalopathy had almost all zero VEGF levels which is consistent with findings from existing literature [20]. This is expected because VEGF is derived mainly from endothelial cells found in blood vessels. Our findings on VEGF levels were consistent with the existing literature [21,22]. However, their analysis was not in accordance with the natural progression of the disease in contrast to our study. Hence, severe dengue could have already occurred when the analysis was performed [21,22].
The difference in PTX-3 level between severe and non-severe dengue was not statistically significant. The finding is not in agreement with the existing study whereby dengue shock syndrome has a higher PTX-3 level [12]. To date, no other study has evaluated PTX-3 in dengue infection after 2005 indicating that PTX-3 may not be useful in predicting or diagnosing severe dengue.
The specificity of the prediction model (VEGF and other clinical parameters) was better than the warning signs employed by the WHO 2009 guidelines. WHO 2009 guidelines has a sensitivity similar to our study but specificity is less than 50% [5,6]. Other studies developed models to predict severe dengue but both sensitivity and specificity were lower than our prediction model [23–25]. However, our diagnostic model and VEGF levels as a single marker have comparatively lower accuracy than the WHO 2009 severe dengue diagnostic criteria with a sensitivity of 96% and specificity of 97% [26]. Therefore, it could not replace the current diagnostic guidelines but may serve as an adjunct investigation to support the diagnosis.
Although this study was designed as a cohort study, the incidence rate could not be reliably calculated because patients were recruited in the first 72 hours of illness. Hence, severe dengue found to be common at day three of illness and the high proportion of severe dengue to non-severe dengue cases is not accurate.
VEGF may be useful in predicting severe dengue along with other available clinical parameters. The model was developed and validated in a full data set. However, to apply this to another hospital or country, the equation must be revalidated because the incidence of severe dengue and clinical parameters may differ. If re-validation fails, a new prediction model must be developed. Therefore, replication of this study is essential before we can conclude its use internationally.
VEGF is a non-specific biomarker which can occur in many disease conditions. The biomarker must be interpreted only if the dengue status of a patient is confirmed such as positive NS1 Ag or IgM. Other possible conditions that could have an effect on the biomarker levels were excluded in this study. Nevertheless, if dengue patients have these condition such as heart disease and pregnancy, they are already at higher risk of complication and death. Thus, the patient should be admitted for close monitoring with or without VEGF testing.
Another limitation of this study is that the fluid intake and other supportive treatments were not included in the development of the model. Treatment might affect the VEGF levels. For example, during blood transfusion or dialysis, the VEGF levels might be reduced. Similarly, the fluid therapy administered parenterally could also have diluted the biomarker in the plasma. However the analysis, particularly for predicting severe dengue, only included samples that have not been treated parenterally. This should not have impacted greatly on the prediction model.
The prediction model developed in this study was based on a single blood sample from each patient one day prior to the development of severe dengue. Though high VEGF levels may indicate that plasma leakage has already occurred, it may still be useful as a predictor because clinical evidence of plasma leakage can only be detected a day later.
In conclusion, VEGF may be used in combination with other clinical parameters to predict the severity of the disease. As a single biomarker, it may be used as an adjunct investigation to support the diagnosis of severe dengue. PTX-3 was not able to differentiate severe dengue from non-severe dengue.
Appendix. Appendix A
The ELISA procedure
The ELISA plates of 96 wells were coated with 100 μl capture antibody. The capture antibody is the respective PTX-3 and VEGF monoclonal antibody purchased commercially. It was in powder form which has to be reconstituted. The capture antibody was diluted in 50 mM carbonate buffer with pH 9.6. The plate was then sealed with a plastic film and incubated overnight for about 16–17 hours at 4°C. The wells were washed with 350 μl washing buffer on a shaker for 30 seconds. The process of washing was repeated for at least three times. After the plate was washed, it was blotted dry. Three hundred microlitres of blocking buffer (1% bovine serum albumin) were then pipetted into each well. Blocking buffer was used to block non-specific binding sites. The plate was incubated for an hour at room temperature. The plate was then washed with 350 μl washing buffer on a shaker for 30 seconds. The process of washing was repeated for three times and blotted dry after the final wash. The plate was added with 300 μl of 2% sucrose solution into each well and incubated for seven minutes at room temperature. The sucrose solution was removed and air dried at room temperature for two hours. The plate was stored at 4°C with desiccant in a sealed plastic bag until plasma samples were tested. The plate can be stored up to a week before using it. When the ELISA plate was ready for testing, 100 μl of each standard (recombinant antibody), plasma samples, control was pipetted into the wells in duplicates. The plate was sealed and incubated for 30 minutes on a shaker at room temperature. Inadequate samples can be diluted up to 1:1 ratio. After 30 minutes, the plate was washed with 350 μl, washing buffer for 30 seconds on a shaker for three times. After the final wash, the plate was blotted dry. 100 μl biotinylated detection antibody was subsequently added to each well. The plate was incubated for 15 minutes on a shaker at room temperature. A 100 μl of Streptavidin-HRP was added for another 15 minutes’ incubation on a shaker at room temperature. The plate was washed after 15 minutes with 350 μl of washing buffer for 30 seconds on a shaker for three times. After the final wash, the plate was blotted dry. TMB solution is the substrate solution which was added to produce a blue colour. A 100 μl of the substrate solution was added to each well to incubate for 4–5 minutes, at room temperature and in the dark. (PTX3 was incubated for four minutes and 30 seconds and VEGF was incubated for five minutes. The substrate solution is sensitive to light. If the solution is exposed to light, the colour will change rapidly to blue and thus, it has to be incubated in the dark. Stop solution (50 μl sulfuric acid) was then added which turns the blue colour into yellow colour. The plate was then analysed immediately (within 30 minutes). The setting of the optical density (OD) reader for reference wavelength was 540 nm and the measurement wavelength was 450 nm. Samples that were diluted with 1:1 ratio, must multiply the OD reading by a factor of two. All of the antibodies (capture, detection and standard antibodies) were purchased from R&D Systems (Minneapolis, MN).
The data for the validation between commercial and optimised ELISA kits
| Pentraxin-3(ng/ml) |
Vascular endothelial Growth Factor(pg/ml) |
|||
|---|---|---|---|---|
| Sample number | Commercial kit | ‘In-house’ kit | Commercial kit | ‘In-house’ kit |
| 1 | 0 | 1 | 1370 | 1314.4 |
| 2 | 6 | 19 | 209 | 587 |
| 3 | 8 | 10 | 342 | 112 |
| 4 | 6 | 5 | 1500 | 1897 |
| 5 | 6 | 2 | 227 | 210 |
| 6 | 5 | 4 | 607 | 1800 |
| 7 | 14 | 13 | 430 | 698 |
| 8 | 18 | 20 | 765 | 1500 |
| 9 | 17 | 16 | 1042 | 1671 |
| 10 | 6 | 2 | 427 | 789 |
Appendix. Appendix B
The mean and standard deviation of the biomarkers in severe dengue and non-severe dengue was obtained. In SPSS Version 20 (Statistical Package for Social Science), a simulated data was created to produce a normal distribution of biomarker values by using the mean difference (the difference in mean between severe dengue and non-severe dengue group). The mean difference was adjusted three fold lesser to produce a higher number of sample size. In this simulated data, 200 samples were assigned (100 sample for DF and 100 for DHF). The number of samples decided for the simulated data is arbitrary, but should be large enough to ensure that the biomarker levels follow a normal distribution.
Using this simulated data, the standard error (SE) of the area under the curve (AUC) was generated. Therefore, this SE was labeled as alternative hypothesis (SEA). Sample size (n) was computed in the following formula:
The same method was used with the null hypothesis (SEO) in which the mean difference is zero. This produced a 95% CI of AUC which includes 0.5. The standard errors of both null and alternative hypotheses were then used to calculate the sample size (n) and power of study (Z) with the following formulas:
The power of the sample size calculated could be obtained from the Z score. With a power of 80%, the sample size for VEGF and PTX-3 were 45 and 20 per group respectively. The highest calculated sample size was used in this study: a total of 90 patients.
Funding Statement
This study was supported by the Universiti Tunku Abdul Rahman Strategic Research Fund (UTARSRF) programme [2014-C1/009].
Acknowledgments
We would like to thank the Director General of Health Malaysia for his permission to publish this article. Dr. Tok Zhen Yu and Dr. Kong Su-Lynn for the data collection. Ms. Ho Shu Cheow for handling the blood samples. Thank you Dr. Katherine Faull (Torrens University Australia) for proofreading the manuscript.
Disclosure statement
There is no conflict of interest to be declared by all authors.
Data availability statement
The data that support the findings of this study are available from the corresponding author, GKK Low, upon reasonable request.
References
- [1]. Bhatt S, Gething PW, Brady OJ, et al. The global distribution and burden of dengue. Nature. 2013;496:504–507. [DOI] [PMC free article] [PubMed] [Google Scholar]
- [2]. World Health Organization Dengue and severe dengue [Internet]. 2016. [cited 2017 March27] Available from: http://www.who.int/mediacentre/factsheets/fs117/en/.
- [3]. Ministry of Health Clinical practice guidelines: management of dengue infection in adults. rev 2nd ed. Putrajaya: CPG Secretariat, Health Technology Assessment Section, Medical Development Division, Ministry of Health Malaysia; 2010. [Google Scholar]
- [4]. World Health Organization Dengue guidelines for diagnosis, treatment, prevention and control. New ed. Geneva, Switzerland: WHO Press; 2009. [PubMed] [Google Scholar]
- [5]. Leo Y-S, Gan VC, Ng E-L, et al. Utility of warning signs in guiding admission and predicting severe disease in adult dengue. BMC Infect Dis. 2013;13:498. [DOI] [PMC free article] [PubMed] [Google Scholar]
- [6]. Thein T-L, Gan VC, Lye DC, et al. Utilities and limitations of the World Health Organization 2009 warning signs for adult dengue severity. PLoS Negl Trop Dis. 2013;7:e2023. [DOI] [PMC free article] [PubMed] [Google Scholar]
- [7]. Low GKK, Gan SC, Ho SC.. Biomarkers in differentiating clinical dengue cases: A prospective cohort study. J Coast Life Med. 2015;3:967–970. [Google Scholar]
- [8]. Rathakrishnan A, Wang SM, Hu Y, et al. Cytokine expression profile of dengue patients at different phases of illness. PLoS One. 2012;7:e52215. [DOI] [PMC free article] [PubMed] [Google Scholar]
- [9]. Kumar Y, Liang C, Bo Z, et al. Serum proteome and cytokine analysis in a longitudinal cohort of adults with primary dengue infection reveals predictive markers of DHF. PLoS Negl Trop Dis. 2012;6:e1887. [DOI] [PMC free article] [PubMed] [Google Scholar]
- [10]. Mantovani A, Garlanda C, Pentraxin BB. 3, a non-redundant soluble pattern recognition receptor involved in innate immunity. Vaccine. 2003;21:S43–S47. [DOI] [PubMed] [Google Scholar]
- [11]. Bethell DB, Flobbe K, Xuan C, et al. Pathophysiologic and prognostic role of cytokines in dengue hemorrhagic fever. J Infect Dis. 1998;177:778–782. [DOI] [PubMed] [Google Scholar]
- [12]. Mairuhu ATA, Peri G, Setiati TE, et al. Elevated plasma levels of the long pentraxin, pentraxin 3, in severe dengue virus infections. J Med Virol. 2005;76:547–552. [DOI] [PubMed] [Google Scholar]
- [13]. Srikiatkhachorn A, Ajariyakhajorn C, Endy TP, et al. Virus-induced decline in soluble vascular endothelial growth receptor 2 is associated with plasma leakage in dengue hemorrhagic fever. J Virol. 2007;81:1592–1600. [DOI] [PMC free article] [PubMed] [Google Scholar]
- [14]. Furuta T, Murao LA, Lan NTP, et al. Association of mast cell-derived VEGF and proteases in Dengue shock syndrome. PLoS Negl Trop Dis. 2012;6:e1505. [DOI] [PMC free article] [PubMed] [Google Scholar]
- [15]. Tseng C, Lo H, Teng H, et al. Elevated levels of plasma VEGF in patients with dengue hemorrhagic fever. FEMS Immunol Med Microbiol. 2005;43:99–102. [DOI] [PubMed] [Google Scholar]
- [16]. Pal S, Dauner AL, Mitra I, et al. Evaluation of dengue NS1 Antigen rapid tests and ELISA kits using clinical samples. PLoS One. 2014;9:e113411. [DOI] [PMC free article] [PubMed] [Google Scholar]
- [17]. Bradley AP, Longstaff ID. Sample size estimation using the receiver operating characteristic curve. Proc 17th Int Conf Pattern Recognition; 2004. August 26; Cambridge, UK: IEEE; p. 428–431. [Google Scholar]
- [18]. Ferrara N, Gerber H-P LJ. The biology of VEGF and its receptors. Nat Med. 2003;9:669–676. [DOI] [PubMed] [Google Scholar]
- [19]. Malavige GN, Ogg GS. Pathogenesis of vascular leak in dengue virus infection. Immunology. 2017;151:261–269. [DOI] [PMC free article] [PubMed] [Google Scholar]
- [20]. Uk M, Kalita J, Ap S. Role of Vascular Endothelial Growth Factor (VEGF) in the neurological manifestations of dengue: A preliminary study. Inflammation. 2014;37:611–614. [DOI] [PubMed] [Google Scholar]
- [21]. Yong YK, Tan HY, Jen SH, et al. Aberrant monocyte responses predict and characterize dengue virus infection in individuals with severe disease. J Transl Med. 2017;15:121. [DOI] [PMC free article] [PubMed] [Google Scholar]
- [22]. Thakur P, Chakravarti A, Aggarwal S, et al. Elevated levels of vascular endothelial growth factor in adults with severe dengue infection. VirusDisease. 2016;27:48–54. [DOI] [PMC free article] [PubMed] [Google Scholar]
- [23]. Soundravally R, Agieshkumar B, Daisy M, et al. Ferritin levels predict severe dengue. Infection. 2015;43:13–19. [DOI] [PubMed] [Google Scholar]
- [24]. Potts JA, Gibbons RV, Rothman AL, et al. Prediction of dengue disease severity among pediatric thai patients using early clinical laboratory indicators. PLoS Negl Trop Dis. 2010;4:e769. [DOI] [PMC free article] [PubMed] [Google Scholar]
- [25]. Tanner L, Schreiber M, Low JGH, et al. Decision tree algorithms predict the diagnosis and outcome of dengue fever in the early phase of illness. PLoS Negl Trop Dis. 2008;2:e196. [DOI] [PMC free article] [PubMed] [Google Scholar]
- [26]. Horstick O, Jaenisch T, Martinez E, et al. Comparing the usefulness of the 1997 and 2009 WHO dengue case classification: A systematic literature review. Am J Trop Med Hyg. 2014;91:621–634. [DOI] [PMC free article] [PubMed] [Google Scholar]
Associated Data
This section collects any data citations, data availability statements, or supplementary materials included in this article.
Data Availability Statement
The data that support the findings of this study are available from the corresponding author, GKK Low, upon reasonable request.