Abstract.
The purpose of our study is to develop and evaluate a method for radiopaque 3-D printing (R3P) of soft tissue computed tomography (CT) phantoms with office laser printers. Five laser printers from different vendors are tested for toner CT attenuation. A liver phantom is created by printing CT images of a patient liver on office paper. One thousand eight hundred sixty paper sheets are printed with three repeated prints per page, resulting in a stack of 18.6 cm. The phantom is examined with 12 tube current settings. Images are reconstructed using filtered back projection (FBP) and iterative reconstruction [adaptive iterative dose reduction 3D (AIDR 3D)]. Seven radiologists rated image quality of all acquisitions. Toner attenuation of all investigated printers increased linearly with the print template grayscale. The liver phantom reproduced anatomic detail and attenuation values of the patient ( HU difference ). Image quality scores increased with dose but did not vary significantly above a threshold dose for AIDR 3D. Overall, AIDR 3D reconstructed images are rated superior to FBP reconstructions (). In conclusion, R3P with standard office laser printers can generate soft tissue CT phantoms without hardware manipulations but with limited flexibility regarding attenuation properties of the printed toner material.
Keywords: printing, three-dimensional, phantoms, imaging, tomography, x-ray computed
1. Introduction
Computed tomography (CT) protocol optimization is a key factor in reducing radiation dose with regard to increasing population exposure from CT examinations.1 Despite efforts to establish diagnostic reference levels,2 there is substantial variability of protocol-related dose exposure across and within institutions.3 This is in large part due to challenges in reviewing and implementing revised protocols at the level of individual facilities.
CT protocols can be revised in the context of supervised programs4,5 or by individual facilities in the clinical routine on patients. Associated limitations are that patients do not allow repeated acquisitions and may be put at risk by unnecessary dose exposure or insufficient diagnostic image quality, when protocols are modified in the clinical workflow. It would therefore be desirable to have a realistic phantom test setup that provides clinical images and allows systematic CT testing.
Radiopaque 3-D printing (R3P) was recently demonstrated to generate realistic phantoms of individual patients for such purposes.6,7 Patient CT images are printed on paper with inkjet technology and ink containing potassium iodide solutions. Stacking of the printed papers results in three-dimensional (3-D) objects with similar CT attenuation properties as the patient. While the method allows to generate phantoms that provide realistic clinical images, it requires manipulation of the inkjet printing equipment and may not easily be established in facilities with limited time and capacities to set up a R3P laboratory.
In contrast to inkjet printers, laser printers deposit solid toner particles and not inkjet solutions on paper. Laser printer toner may thereby achieve stronger CT attenuation than printer ink in its unmodified state. For example, iron oxide containing toner was previously used to generate geometric x-ray phantoms by superimposing laser printed sheets.8 The hypothesis of this work was that repeated prints with laser toner result in sufficient CT contrast to generate soft tissue CT phantoms with patient equivalent Hounsfield units (HU) that can be used for dose and image quality analysis. Ideally, such a method would make use of standard office laser printers without any modification and thereby be easily accessible in most CT facilities. The aim of this study was therefore to develop and evaluate such a method for R3P of soft tissue CT phantoms with office laser printers.
2. Methods
2.1. Study Design
The institutional ethics committee approved the study and waived informed consent. In the first step, five office laser printers were investigated for toner CT attenuation. Based on these results, a full-size liver phantom was printed from a patient dataset. In the second step, the phantom was scanned with 24 different dose and reconstruction settings, and image quality was rated by seven radiologists. A Canon Aquilion Prime CT scanner (Canon Medical Systems, Otawara, Japan) was used for model analysis.
2.2. Printer Comparison
Toner attenuation properties of five different laser printers were investigated: HP P3005X (Hewlett Packard, Palo Alto, California), Kyocera M 3540idn (Kyocera Corporation, Kyoto, Japan), Ricoh Pro 8100S (Ricoh Company, Tokyo, Japan), Samsung ML-2525W (Samsung Electronics, Suwon, South Korea), and Xerox Phaser 4600 (Xerox Corporation, Norwalk, Connecticut). Table 1 provides a summary of the toner compositions as provided by the manufacturers. A print template was designed, consisting of 20 squares ( per square) with grayscales ranging from 0% (white) to 100% (black). The template was printed on 100 sheets of standard office paper (A4 size, ) with every printer. The resulting stacks were compressed between two flat plates held together with four threaded polyamide rods of 1-cm diameter and scanned with the paper sheets aligned parallel to the plane (tube voltage 120 kV, tube current 400 mA, and reconstructed slice thickness 0.5 mm). Regions of interest (ROIs) of were placed in all grayscale squares and analyzed in 14 consecutive slices.
Table 1.
Toner ingredients of the investigated laser printers from five different vendors.
| Ingredients | Concentration (%) | ||||
|---|---|---|---|---|---|
| HP P3005X | Kyocera M 3540idn | Ricoh Pro 8100S | Samsung ML-2525W | Xerox Phaser 4600 | |
| Polymer resin | 40 to 50 | 75 to 85 | |||
| Carbon black | — | — | 1 to 6 | ||
| Iron oxide | 35 to 45 | — | — | — | |
| Wax | — | 1 to 5 | 1 to 5 | ||
| Silica | 1 to 10 | 1 to 3 | |||
| Titan oxide | — | 0.1 to 1 | — | 1 to 3 | |
2.3. Multilayer Printing
The HP P3005X printer achieved the highest attenuation values and was therefore selected for all consecutive experiments. A print template with a single full black square of was used to print three stacks of 100 paper sheets. For the first stack one print per page, for the second stack two repeated prints per page, and for the third stack three repeated prints per page were performed. CT attenuation of the models was analyzed with a ROI of in 14 consecutive slices as described earlier.
2.4. Soft Tissue Liver Phantom
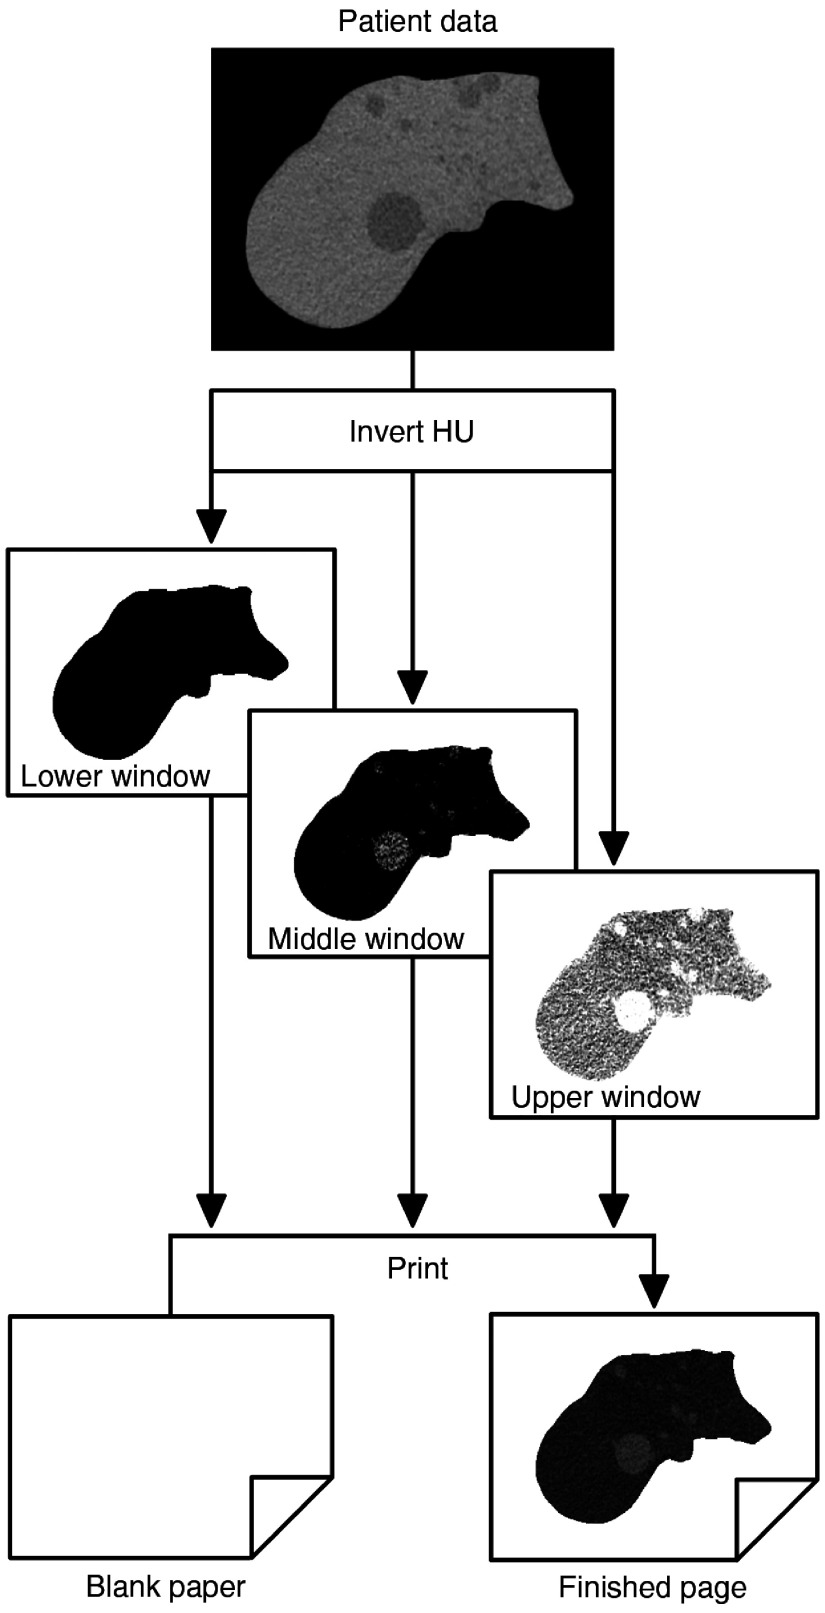
A patient abdomen CT dataset with multiple hepatic cysts was retrospectively selected from the clinical database (acquisition on a Canon Aquilion Prime CT scanner, noncontrast scan, acquisition parameters 120 kV, automated tube current modulation, reconstructed slice thickness 1 mm, standard soft tissue kernel). A liver phantom was selected to fit the soft tissue phantom to A4 paper size. Liver tissue was displayed on 186 consecutive images. The liver was manually segmented on each slice and all areas outside of the liver were assigned an HU value of . Based on the range of HU values for one, two, and three repeated prints from the previous experiment, three print template datasets of the liver were generated with corresponding window level (WL) and window width (WW) settings: (1) WL and WW of and 134, (2) WL and WW of and 99, and (3) WL and WW of 69.5 and 73. All images were inverted and exported as TIFF files (Fig. 1). One thousand eight hundred sixty paper sheets were printed with three repeated prints per page (one print per template dataset). The phantom was scanned with the same acquisition and reconstruction parameters as the patient. Phantom HU values were compared with patient HU values.
Fig. 1.
Three template datasets were created from the patient CT data with window settings adjusted to the toner cartridge calibration. Three repeated prints per page were performed with one print per template dataset.
2.5. Dose and Image Quality
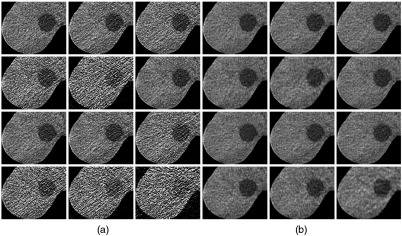
In a sample application of the liver phantom, a dose and image quality evaluation study was performed. The phantom was scanned with a tube voltage of 120 kV and an abdomen protocol. Fixed tube currents and automated tube current modulation (ATCM) were used (fixed: 200, 150, 100, 50, 30, 20, and 10 mA; ATCM: SD values of 7.5, 9.5, 12, 15, and 25). All acquisitions were reconstructed with adaptive iterative dose reduction 3D (AIDR 3D) and filtered back projection (FBP). An axial slice of the same liver cross section was exported from all 24 acquisitions as TIFF file (WL 40 and WW 350). The 24 exported images were rated by seven radiologists in a two alternative force choice experiment. Images were displayed in pairs and the participants were asked to select the image with superior diagnostic quality. All images were compared with each other, resulting in 23 pairs per image and a total of 276 pairs for 24 acquisitions (Fig. 2). The resulting score corresponded to the number of wins per image (possible range: 0 to 23).
Fig. 2.
Comparison of 24 CT acquisitions of the liver phantom (displayed at WL 40, WW 350): (a) 12 FBP images and (b) 12 AIDR 3D images. Tube currents: first row ATCM SD 7.5, ATCM SD 9.5, and ATCM SD 12. Second row ATCM SD 15, ATCM SD 25, and 200 mA. Third row 150, 100, and 50 mA. Fourth row 30, 20, and 10 mA.
2.6. Data and Statistical Analysis
Correlation was analyzed using Pearson correlation. Estimates are given in correlation coefficient and 95% confidence intervals (CI). For curve fittings, linear regression was used. Image quality rating scores were compared using two-way analysis of variance of dose and reconstruction method. Differences were interpreted as significant when .
3. Results
3.1. Printer Comparison
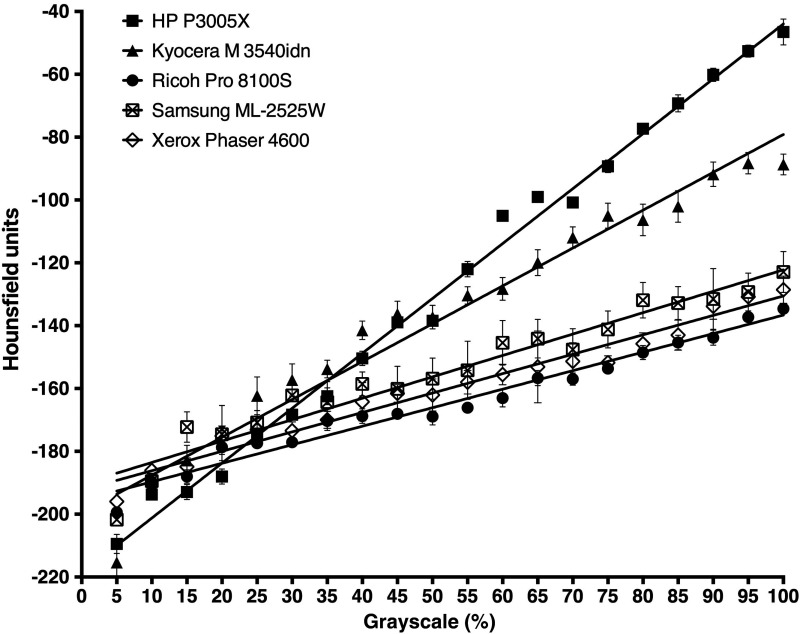
A linear correlation between grayscales and HU values was found for all investigated printers (Fig. 3). Pearson correlation coefficients and 95% CI were: HP P3005X (; 95% CI: 0.9922, 0.9988), Kyocera M 3540idn (; 95% CI: 0.9510, 0.9925), Ricoh Pro 8100S (; 95% CI: 0.9637, 0.9945), Samsung ML-2525W (; 95% CI: 0.9221, 0.9880), and Xerox Phaser 4600 (; 95% CI: 0.9634, 0.9944). The maximum achievable CT attenuation () with 100% grayscale (full black) was lowest for the Ricoh Pro 8100S ( HU) and highest for the HP 3005X printer ( HU).
Fig. 3.
Linear correlation between grayscale values and HU of five laser printers from different vendors. values of 14 ROIs are displayed.
3.2. Multilayer Printing
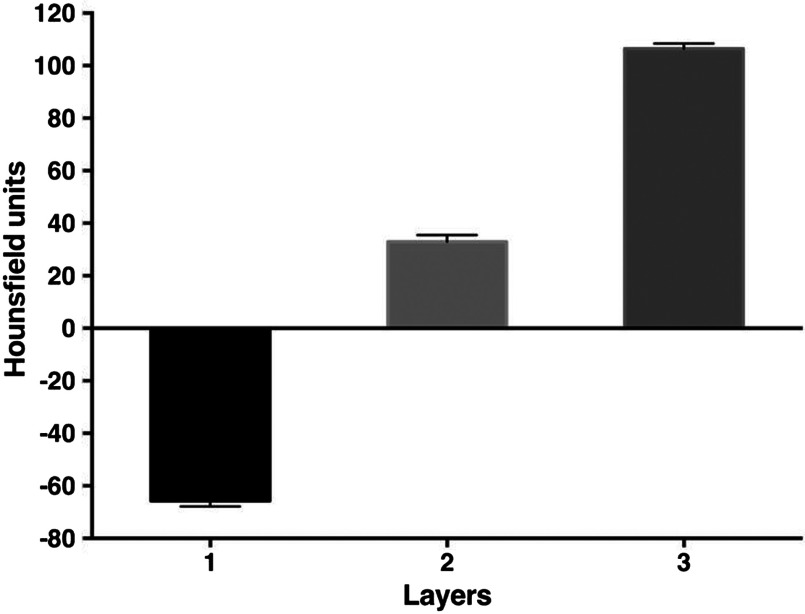
HU () of the models printed with the full black (100%) template were with one print, with two repeated prints, and with three repeated prints. There was a linear correlation between the number of repeated prints with 100% grayscale and HU values () (Fig. 4).
Fig. 4.
Number of printed toner layers and HU. Repeated prints per page resulted in increasing HU. values of 14 ROIs are displayed.
3.3. Soft Tissue Liver Phantom
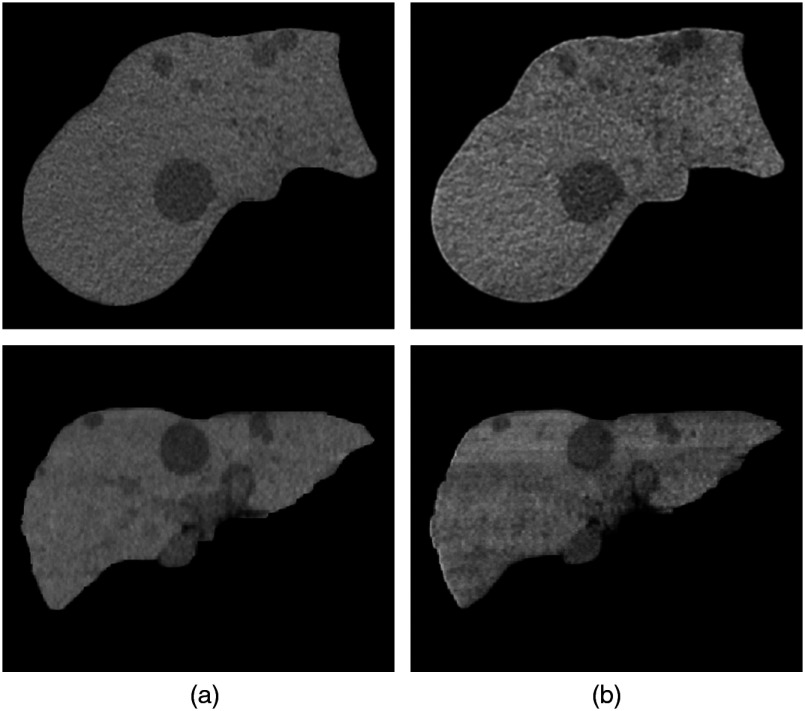
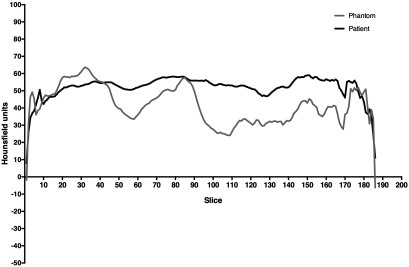
Figure 5 shows CT images of the phantom and images of the patient liver that was used as template. Streaks in the phantom images represent HU variations most likely caused by variations of toner deposition and possibly also composition. Patient and phantom HU over all slices are plotted in Fig. 6. HU and 95% CI of the mean were for the phantom (95% CI 39.93, 43.2) and for the patient (95% CI 50.8, 52.85). In a slice-by-slice comparison, the difference between patient and phantom HU ranged from to 13.4, the absolute difference was (95% CI 11.56, 13.8).
Fig. 5.
CT images of the (a) patient liver and the (b) liver phantom. HU were for the patient and for the phantom.
Fig. 6.
Slice-by-slice comparison of the patient and the phantom liver. The HU absolute difference between patient and phantom was (95% CI 11.56, 13.8).
3.4. Dose and Image Quality
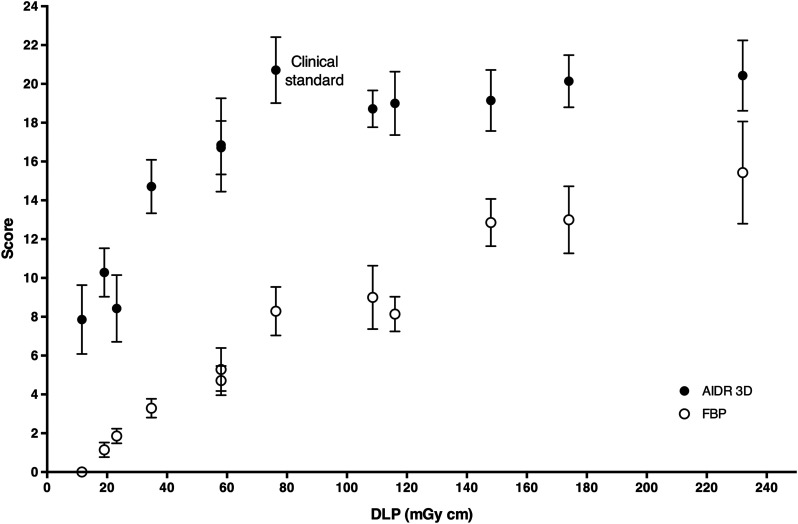
The DLP of all 24 acquisitions ranged from 11.6 (120 kV, fixed 10 mA) to 232 mGy cm (120 kV, fixed 200 mA). The results of the image rating experiment are shown in Fig. 7. Images reconstructed with AIDR 3D were systematically rated superior to images reconstructed with FBP (). There was a linear correlation between dose and image quality scores for FBP reconstructed images (; 95% CI: 0.9029, 0.9926). Rating of AIDR 3D reconstructed images increased up to a threshold dose of 76.3 mGy cm (120 kV, ATCM with SD value of 12, corresponding to our clinical standard abdomen protocol), with no further increase for higher doses.
Fig. 7.
Results of the image rating experiment ( values of seven rating scores per data point).
4. Discussion
The results show that laser printers can be used to create anthropomorphic soft tissue CT phantoms from patient CT datasets. All printers investigated in this study were commercially available office laser printers. The sample application study demonstrated applicability for systematic CT protocol testing.
Laser printing represents a simplified approach to the previously published method for R3P of anthropomorphic CT phantoms with inkjet technology.6 In contrast to this previous work, calibration was limited to adjusting window settings to the HU capacities of the toner cartridges without additional grayscale correction of the print templates. Also, phantom printing was feasible without hardware manipulations as the printers deposited and stacked sufficient toner particles to generate a detectable CT contrast. However, phantom attenuation was consequently also dependent on the toner composition as provided by the manufacturers.
Iron-oxide-containing toners exhibited significantly higher attenuation in this study and were therefore used for the liver model. While this allowed to limit the number of print cycles to three repeated prints per page, additional print cycles may achieve soft tissue HU values also with lower attenuating toners. Extrapolation suggests that large numbers of print cycles could even yield bone equivalent HU. However, this may be limited by the resulting stress on the material. As toner is not absorbed by the paper, repeated mechanical stress from passing through the printer potentially damages toner layers from previous prints. This may also have contributed to the HU variations observed in the soft tissue liver model. In addition, there may be variability of cartridge toner deposition and also toner composition that contributed to the observed HU variations. Particular attention should therefore be paid to the replacement of empty cartridges and to the cartridge calibration. Depending on their composition, color toners may exhibit similar attenuation properties as some of the toners investigated in this work and therefore alternatively be used.
The developed method presents an easily accessible approach to generate anthropomorphic phantoms with standard office equipment. This is in contrast to previous studies using commercial 3-D printers9 that are associated with considerably higher costs and more limited availability. Also, manipulation of build material attenuation properties of commercial 3-D printers is challenging,10 whereas phantom attenuation was adjusted to patient HU values with simple window settings in this study. Printing of patient CT images allowed to transfer detailed patient anatomy into a liver phantom. This may be extended to other nonuniform soft tissue models and larger phantom sizes (e.g., using A3 laser printers). Such phantoms may be used to simulate clinical patient imaging and assess CT techniques11,12 and provide an opportunity for researchers and CT facilities to test and optimize CT protocols without exposing patients.
With this regard, the sample application study demonstrated dose dependency of overall image quality as was expected from previous work.13 Also, similar to previous studies, AIDR 3D achieved noninferior image quality ratings at lower doses.14–16 Remarkably, the threshold dose for AIDR 3D reconstructed images, above which image quality scores did not further increase, corresponded to the clinical standard protocol used at our department. This indicates both that potential improvements were too marginal to be perceived and that the participants tended to prefer familiar image attributes from their clinical practice. A comparison with readers that are not unanimously biased by their clinical experience would therefore be of interest in future work.
The limitations of this work are that only soft tissues were simulated. The method was used to create one liver phantom, but reproducible printing of anthropomorphic phantoms was not demonstrated. Phantom consistency over time was not investigated in this work. Dose and image quality were assessed on the phantom, but not directly compared with clinical patient images. Also, overall image quality was assessed for a global phantom evaluation in this work, but evaluation was not performed for specific tasks.13,17
In conclusion, off-the-shelf office laser printers can generate anthropomorphic soft tissue phantoms for CT. The developed method presents a simplified approach for R3P of CT phantoms without hardware manipulations of the printing equipment, but also with less flexibility regarding attenuation properties of the printed toner material.
Acknowledgments
This study received funding from the Bundesministerium für Wirtschaft und Energie (DE) under Grant No. 03EFHBE093.
Biography
Biographies of the authors are not available.
Disclosures
Patent applications for the 3-D printing method were filed by Paul Jahnke and Michael Scheel: DE202015104282U1, EP000003135199A1, and US020170042501A1.
References
- 1.Smith-Bindman R., et al. , “Use of diagnostic imaging studies and associated radiation exposure for patients enrolled in large integrated health care systems, 1996–2010,” J. Am. Med. Assoc. 307(22), 2400–2409 (2012). 10.1001/jama.2012.5960 [DOI] [PMC free article] [PubMed] [Google Scholar]
- 2.Kanal K. M., et al. , “U.S. diagnostic reference levels and achievable doses for 10 adult CT examinations,” Radiology 284(1), 120–133 (2017). 10.1148/radiol.2017161911 [DOI] [PubMed] [Google Scholar]
- 3.Smith-Bindman R., et al. , “Predictors of CT radiation dose and their effect on patient care: a comprehensive analysis using automated data,” Radiology 282(1), 182–193 (2017). 10.1148/radiol.2016151391 [DOI] [PMC free article] [PubMed] [Google Scholar]
- 4.Demb J., et al. , “Optimizing radiation doses for computed tomography across institutions: dose auditing and best practices,” JAMA Intern. Med. 177(6), 810–817 (2017). 10.1001/jamainternmed.2017.0445 [DOI] [PMC free article] [PubMed] [Google Scholar]
- 5.Goenka A. H., et al. , “CT radiation dose optimization and tracking program at a large quaternary-care health care system,” J. Am. Coll. Radiol. 12(7), 703–710 (2015). 10.1016/j.jacr.2015.03.037 [DOI] [PubMed] [Google Scholar]
- 6.Jahnke P., et al. , “Radiopaque three-dimensional printing: a method to create realistic CT phantoms,” Radiology 282(2), 569–575 (2017). 10.1148/radiol.2016152710 [DOI] [PubMed] [Google Scholar]
- 7.Ikejimba L. C., et al. , “A novel physical anthropomorphic breast phantom for 2D and 3D x-ray imaging,” Med. Phys. 44(2), 407–416 (2017). 10.1002/mp.12062 [DOI] [PubMed] [Google Scholar]
- 8.Kotre C. J., Porter D. J., “Short communication: a printed image quality test phantom for mammography,” Br. J. Radiol. 78(932), 746–748 (2005). 10.1259/bjr/11930472 [DOI] [PubMed] [Google Scholar]
- 9.Leng S., et al. , “Construction of realistic phantoms from patient images and a commercial three-dimensional printer,” J. Med. Imaging 3(3), 033501 (2016). 10.1117/1.JMI.3.3.033501 [DOI] [PMC free article] [PubMed] [Google Scholar]
- 10.Leary M., et al. , “Additive manufacture of custom radiation dosimetry phantoms: an automated method compatible with commercial polymer 3D printers,” Mater. Des. 86, 487–499 (2015). 10.1016/j.matdes.2015.07.052 [DOI] [Google Scholar]
- 11.Solomon J., Wilson J., Samei E., “Characteristic image quality of a third generation dual-source MDCT scanner: noise, resolution, and detectability,” Med. Phys. 42(8), 4941–4953 (2015). 10.1118/1.4923172 [DOI] [PubMed] [Google Scholar]
- 12.Solomon J., et al. , “Comparison of low-contrast detectability between two CT reconstruction algorithms using voxel-based 3D printed textured phantoms,” Med. Phys. 43(12), 6497–6506 (2016). 10.1118/1.4967478 [DOI] [PubMed] [Google Scholar]
- 13.Schindera S. T., et al. , “Iterative reconstruction algorithm for CT: can radiation dose be decreased while low-contrast detectability is preserved?” Radiology 269(2), 511–518 (2013). 10.1148/radiol.13122349 [DOI] [PubMed] [Google Scholar]
- 14.Mello-Amoedo C. D., et al. , “Comparison of radiation dose and image quality of abdominopelvic CT using iterative (AIDR 3D) and conventional reconstructions,” AJR Am. J. Roentgenol. 210(1), 127–133 (2018). 10.2214/AJR.17.18025 [DOI] [PubMed] [Google Scholar]
- 15.Gervaise A., et al. , “Standard dose versus low-dose abdominal and pelvic CT: comparison between filtered back projection versus adaptive iterative dose reduction 3D,” Diagn. Interv. Imaging 95(1), 47–53 (2014). 10.1016/j.diii.2013.05.005 [DOI] [PubMed] [Google Scholar]
- 16.Matsuki M., et al. , “Impact of adaptive iterative dose reduction (AIDR) 3D on low-dose abdominal CT: comparison with routine-dose CT using filtered back projection,” Acta Radiol. 54(8), 869–875 (2013). 10.1177/0284185113488576 [DOI] [PubMed] [Google Scholar]
- 17.Yoon J. H., et al. , “Influence of the adaptive iterative dose reduction 3D algorithm on the detectability of low-contrast lesions and radiation dose repeatability in abdominal computed tomography: a phantom study,” Abdom. Imaging 40(6), 1843–1852 (2015). 10.1007/s00261-014-0333-4 [DOI] [PubMed] [Google Scholar]


