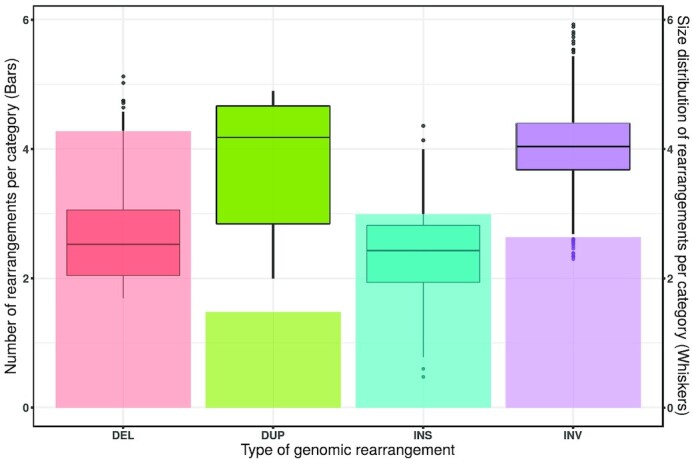
Figure 2:

Total counts and length ranges (in bp) of genomic rearrangements of SVs between L. viridis and L. bilineata. The counts are represented by bars and length ranges by whiskers (y-axis is log10-scaled). The rearrangements plotted are categorized into deletions (DEL), duplications (DUP), insertions (INS), and inversions (INV).
