

Summary
Cancer progression to an aggressive phenotype often co-opts aspects of stem cell biology. Here, we developed gene signatures for normal human stem cell populations to understand the relationship between epithelial cancers and stem cell transcriptional programs. Using a pan-cancer approach, we reveal that aggressive epithelial cancers are enriched for a transcriptional signature shared by epithelial adult stem cells. The adult stem cell signature selected for epithelial cancers with worse overall survival and alterations of oncogenic drivers. Lethal small cell neuroendocrine lung, prostate, and bladder cancers transcriptionally converged onto the adult stem cell signature and not other stem cell signatures tested. We found that DNA methyltransferase expression correlated with adult stem cell signature status and was enriched in small cell neuroendocrine cancers. DNA methylation analysis uncovered a shared epigenetic profile between small cell neuroendocrine cancers. These pan-cancer findings establish a molecular link between human adult stem cells and aggressive epithelial cancers.
Keywords: stem cell signature, pan-cancer, neuroendocrine prostate cancer, small cell lung cancer, adult stem cells
Introduction
Cancer shares a number of parallels with normal human development. Processes that underlie normal differentiation are often altered during the initiation and/or progression of epithelial cancers (Clevers, 2006; Turner and Grose, 2010). Microenvironmental cues and cellular cross-talk are vital for stem cell self-renewal and functionality (Jones and Wagers, 2008). Further, defects in these cell-cell communications activate signaling pathways that drive neoplastic growth and invasiveness. Cellular plasticity enables embryonic and cancer epithelial cells to migrate to and settle into distant anatomical sites in order to form new organs or tumors (Nieto, 2013). Disruption in the epigenetic machinery that guides normal lineage commitment can produce impaired differentiation states and epigenome reprogramming characteristic of malignant tumors (Feinberg et al., 2016).
Molecular profiling of stem and cancer cells has increased our understanding of the links between these cell populations. For multiple epithelial cancers, the cell-of-origin can be a stem/progenitor cell that resides within the tissue (White and Lowry, 2015). Certain epithelial cancers are known to revert to a molecular state reminiscent of their tissue stem cell as they become more aggressive (Merlos-Suarez et al., 2011; Pece et al., 2010; Smith et al., 2015). Histologically poorly differentiated tumors can possess gene sets and transcription factors enriched in human embryonic stem cells (hESCs) (Ben-Porath et al., 2008; Wong et al., 2008). Recent evidence supports that ESCs can reside in alternative states of pluripotency: naive and primed. In the mouse, naive embryonic stem cells are derived from the pre-implantation inner cell membrane, while the primed ESC represents a more developmentally advanced pluripotent state. Conventional hESCs are believed to represent a primed state due to their molecular and functional similarities with the mouse postimplantation epiblast (Nichols and Smith, 2009). Specific culture conditions can convert hESCs to a naive state that transcriptionally corresponds to an earlier developmental stage than primed hESCs (Theunissen et al., 2016). It is unclear how these alternative pluripotent states relate to human epithelial cancers.
Pan-cancer efforts by The Cancer Genome Atlas (TCGA) and others have shown that cancers originating from different tissues share similar genomic signatures (Bailey et al., 2018; Hoadley et al., 2018). Certain breast and bladder cancers display a basal-like molecular profile characterized by p63 activation and the expression of specific basal cell cytokeratins (Damrauer et al., 2014). Further, basal-like breast cancers share numerous molecular features including actionable targets with high-grade serous ovarian cancer (The Cancer Genome Atlas Research Network, 2012a). Copy number alteration patterns were found to be common in breast, ovarian, lung, and uterine samples and were predictive of glycolytic phenotypes (Graham et al., 2017). Squamous cell carcinomas from different anatomical sites share frequent alterations in TP53, PIK3CA, CDKN2A, SOX2, and CCND1 compared to other cancer phenotypes (Schwaederle et al., 2015).
Almost every epithelial tissue can develop a highly aggressive cancer phenotype characterized in part by expression of neuroendocrine differentiation markers (Frazier et al., 2007). These neuroendocrine cancers encompass a spectrum of different histological phenotypes including small cell, large cell, adenocarcinoma with neuroendocrine differentiation, and others. However, they often exhibit similar clinical features including rapid metastasis and resistance to currently approved therapeutic strategies. These cancers almost universally have loss-of-function alterations in RB1 and TP53 and often include amplifications in the MYC family of genes and altered expression of epigenetic regulators (Beltran et al., 2011; Beltran et al., 2016; George et al., 2015; Poirier et al.,2015). Further, conversion to a neuroendocrine phenotype has emerged as a mechanism of treatment resistance in prostate and lung cancers (Davies et al, 2018; Oser et al., 2015). Transcriptional profiling of primary human prostate epithelial populations revealed that advanced prostate cancer subtypes vary in their enrichment of a prostate basal stem cell signature with small cell neuroendocrine prostate cancer (SCNPC) being the most stem-like. SCNPC and the normal prostate basal stem cell shared a transcriptional program associated with E2F targets and specific transcription factors such as SOX2 (Smith et al., 2015). The observed phenotypic plasticity along with overexpression of known stem cell associated transcriptional regulators implies that small cell neuroendocrine (SCN) cancers from different epithelial tissues may share a stem-like molecular component.
Here, we used a pan-stem cell, pan-cancer approach to interrogate the relationship between epithelial cancers and normal stem cell-associated expression networks. We show that a number of epithelial cancers become enriched for a human epithelial adult stem cell (ASC) signature during progression to an advanced, aggressive state. The human ASC signature provided prognostic information and was associated with genomic alterations that influence cancer aggressiveness and lineage differentiation. In this analysis, we simplified the nomenclature for histologically defined neuroendocrine cancers and defined all epithelial derived-neuroendocrine cancer subtypes as small cell neuroendocrine to prevent confusion when alternating between tissue types. Using multiple gene expression datasets composed of clinical samples, we found that aggressive small cell neuroendocrine cancers derived from different tissues have higher adult stem cell signature scores than non-small cell neuroendocrine phenotypes. Further, we provide evidence that SCN cancers share a core set of methylation regulated genes that are linked to their ASC-associated expression programs.
Results
Development of gene signatures for human stem cell populations.
Previous stem cell signatures have been developed by comparing ESCs to multiple cell types, and/or by applying logical, but somewhat ad-hoc combinations of criteria (Ben-Porath et al., 2008; Wong et al., 2008; Wong et al., 2008). Recent identification of human adult stem cell populations allows for the definition of stem cell signatures from tissues sorted for cells with or without stem cell markers, providing a more direct comparison of stem-associated gene expression. To investigate stem cell related signaling across multiple different epithelial cancers, we developed gene signatures for human epithelial adult stem cells. As a comparison, we included signatures from naive hESCs and primed hESCs. For the human epithelial adult stem cell signature, we compiled datasets that included primary Trop2+CD49fHi sorted prostate basal stem cells, Lin-CD49fHiEpCAM- mammary stem cells, EphB2 sorted intestinal stem cells, and their differentiated counterparts (Jung et al., 2011; Lim et al., 2009; Smith et al., 2015). For the naive and primed hESC signatures, we utilized two datasets from two different laboratories that profiled these cell populations (Takashima et al., 2014; Theunissen et al., 2014). To evaluate and combine the signatures, we applied a rank-rank hypergeometric overlap (RRHO) algorithm, which enables identification of significantly concordant transcriptional profiles from independent RNA profiling experiments regardless of sequencing platform or other variables (Plaisier et al., 2010) (Figure 1A). RRHO was applied to three possible combinations of human adult stem cells revealing high overlap between the transcriptional profiles of the epithelial stem populations (Figure 1B). A similar comparison between primary human epithelial stem cells and hematopoietic stem cells did not show the same level of overlap, highlighting the similarity between the epithelial stem cell populations (Eppert et al., 2011) (Figure S1). RRHO analysis of naive and primed hESCs indicated that the respective hESC sub-populations from each dataset were highly related at the gene expression level (Figure 1B). Signatures consisted of the top 50-genes associated with either the adult stem cell, naive hESC, or primed hESC population, with no gene overlap between the three stem cell signatures (Table S1). Gene signatures of this size are amenable to PCR or Nanostring-based clinical assays as exemplified by the PAM50 signature for identifying breast cancer subtypes (Wallden et al., 2015). Applying the signatures to independent datasets further validated that our stem cell signatures selected for the appropriate cell populations (Figure 1C).
Figure 1. Generation of human stem cell molecular signatures.
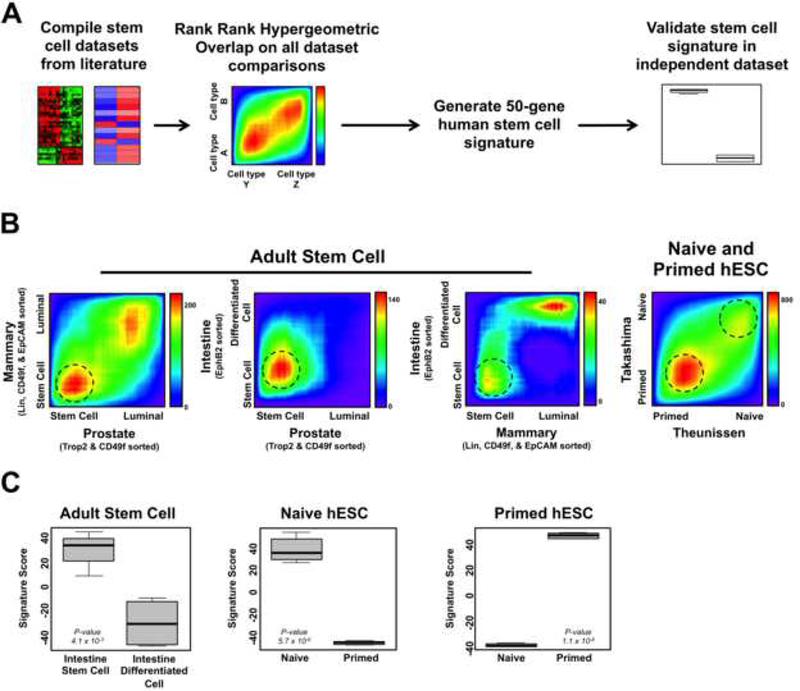
(A) Schematic for generating human stem cell gene expression signatures. (B) Rank-rank hypergeometric overlap heatmap plots for normal human epithelial cell dataset comparisons used to generate stem cell signatures. Dotted circles indicate regions where genes were derived from to generate the signatures. Heatmap scale bars = -log10 p-value. (C) Human stem cell signature scores in validation datasets. Intestine stem cell: n = 4, Intestine differentiated cell: n = 4, Naive: n = 6, Primed: n = 5. Mean ± SD. See also Figure S1 and Table S1.
The human adult stem cell signature is associated with advanced epithelial cancers and a poor clinical outcome.
We utilized gene expression datasets from The Cancer Genome Atlas to determine if pan-tissue epithelial cancers activate transcriptional programs defined by specific human stem cell populations as they progress to an advanced state. In addition to the adult stem cell rank-based signature that we developed, we included the rank-based naive and primed hESC signatures and published gene set based human ESC and ESC-like transcriptional signatures (Ben-Porath et al., 2008; Wong et al., 2008). Unsupervised clustering based on stem cell signatures showed that most epithelial cancers become enriched for the adult stem cell signature as they progress from early stage disease (Stage 1) to advanced localized/metastatic disease (Stage 3–4). Some cancer types exhibited a similar trend with the other stem cell signatures though not to the extent as with the ASC signature (Figure 2A and S2A). Applying the stem cell signatures to TCGA specimens organized by tumor grade revealed a similar trend with the high grade, undifferentiated tumors having higher ASC signature scores compared to lower grade tumors (Figure S2B). The ASC signature performed better than other stem cell signatures tested in separating low grade from high grade tumors (Figure 2B). Further, the adult stem cell signature was significantly enriched in the high Gleason score and tumor stage organ-confined prostate cancers, though we observed other stem cell signatures to be significantly associated with high Gleason score tumors (Figure S2C-S2E). Interestingly, we found that the ASC signature significantly improved determination of prostate cancer stage beyond Gleason score alone (p-value = 9.0 × 10⁻⁴).
Figure 2. The human adult stem cell signature selects for aggressive epithelial cancer phenotypes.
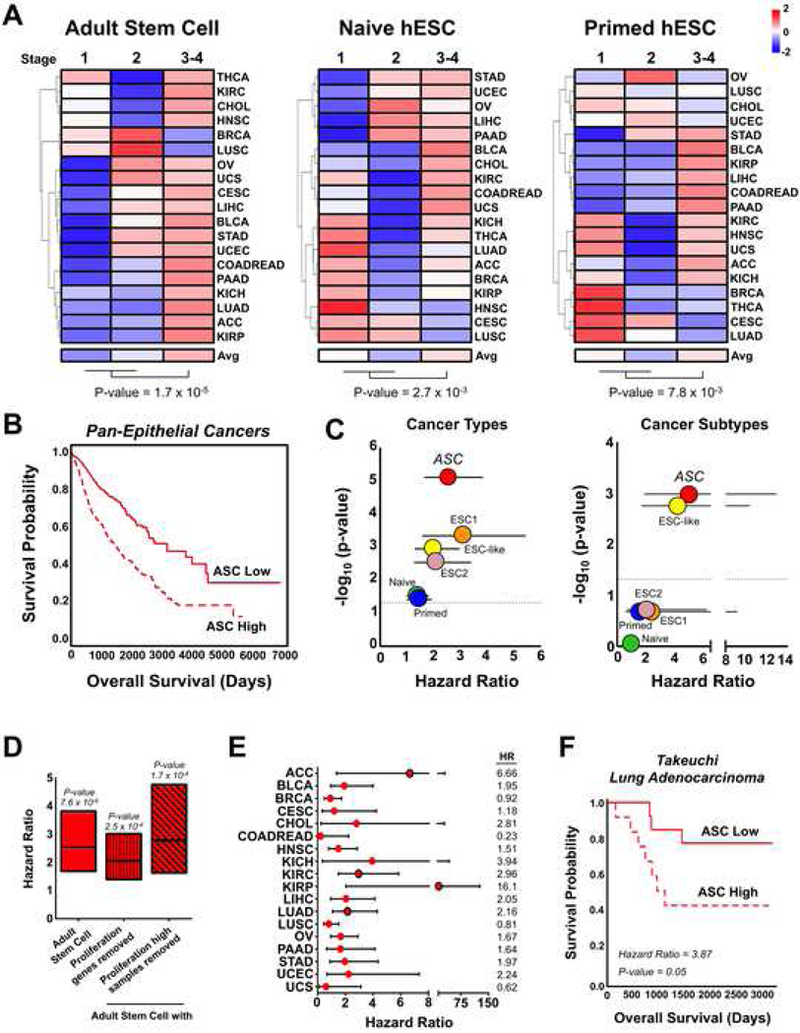
(A) Unsupervised clustering of TCGA epithelial cancers according to average stem cell signature scores for cancer stages. Scale color key is based on z-scores. (B) Overall survival of ASC signature associated samples in TCGA epithelial cancers. ASC High: n = 1097, ASC Low: n = 923. (C) P-values and hazard ratios for human stem cell signatures in the pan-epithelial cancer dataset after controlling for covariates including cancer types or cancer molecular subtypes. Mean ± 95% CI. Dotted line indicates a p-value = 0.05. (D) Hazard ratios for the ASC signature with and without removal of proliferation associated signals. Min and max bars represent the 95% CI. (E) Hazard ratios for ASC signature enriched samples according to cancer lineage. Red circles outlined in black indicate a p-value < 0.05. Min and max bars represent the 95% CI. (F) Overall survival of ASC signature stratified lung adenocarcinoma samples from Takeuchi et al., 2006. ASC High: n = 12, ASC Low: n = 13. See also Figure S2.
To determine if the stem cell signatures provided pan-cancer prognostic information, we combined all TCGA epithelial cancer samples together and then stratified the samples into High and Low groups according to their stem cell signature scores. After controlling for tissue-of-origin or molecular subtypes along with other clinical features, the adult stem cell signature was most significantly associated with poor survival (Figure 2C). To control for cell cycle and proliferation, we developed a proliferation signature that either 1) removed common genes from the adult stem cell signature or 2) removed samples that were classified as high for both the adult stem cell and proliferation signatures. The adult stem cell signature proved to be significantly predictive of a poor prognosis even after controlling for proliferation (Figure 2D). Evaluating each epithelial cancer independently further supported that the ASC signature is enriched in samples with lower overall survival (Figure 2E). Lung adenocarcinoma is the one of the leading causes of cancer related deaths worldwide. Looking at the TCGA and an independent dataset, lung adenocarcinomas enriched for the ASC signature had a significantly worse survival than samples with low signature scores (Figures 2E and 2F). Our results indicate that aggressive epithelial cancers activate a transcriptional program common to human epithelial adult stem cells.
The adult stem cell signature is associated with specific genomic alterations.
To gain insight into genomic alterations associated with the stem cell signatures, we performed a hypergeometric test between stem cell signature status (High and Low) and genomic alteration. We found ASC signature status to be associated with broad, high-level gene amplifications in chromosomes 3q, 5p, and 8q when analyzed across our compendium of epithelial cancers. (Figure 3A). These alterations were not associated with either ASC Low designated samples or samples not classified as ASC High (Figure S3A). We observed that the ASC High samples were highly represented by head and neck (22%) and lung squamous carcinomas (24%). Removing these samples from our analysis slightly decreased the alteration frequency in chromosome 3q; however, genes in this genomic location remained significantly associated with ASC status (Figure S3B). The naive and primed hESC signatures were less associated with high-level amplifications than the ASC signature, though the naive hESC and ASC signatures were correlated with a number of amplifications in chromosomes 3q and 5p (Figure S3C). However, the ASC signature exhibited a noticeably higher frequency of alterations in these chromosomes than the naive hESC signature.
Figure 3. The ASC signature is associated with epithelial cancers exhibiting genomic alterations in developmental regulators and small cell neuroendocrine lung cancers.
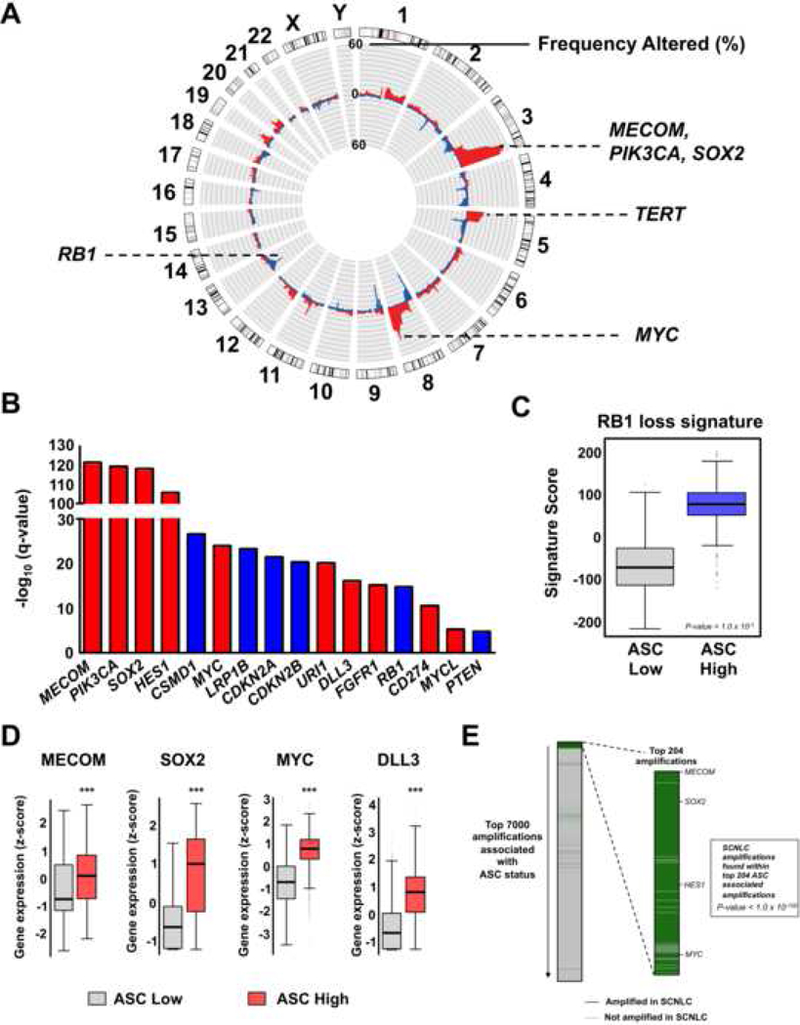
(A) Copy number amplifications (red) and deletions (blue) associated with the ASC signature. Alterations are plotted according to the frequency in ASC-associated samples. (B) Notable genes significantly associated with ASC signature status. Red denotes genes that are significantly amplified and blue bars indicate genes that are significantly deleted. (C) RB1 loss-of-function signature in ASC stratified samples. Mean ± SD. (D) Expression of notable genes in ASC signature High and Low samples. Mean ± SD. ***P-value < 1.0 × 10⁻³. (E) Small cell neuroendocrine lung cancer (SCNLC) amplifications that are associated with ASC status. All SCNLC amplifications encoding protein-coding genes (Rudin et al., 2012) were found within the top 7000 amplifications associated with ASC status as ordered according to amplification frequency. Of the 290 common protein-coding gene amplifications found in SCNLC and associated with ASC, 181 were within the top 204 amplifications associated with ASC status (p-value < 1.0 × 10−100). See also Figure S3, Table S2, Table S3, and Table S4.
For the ASC signature, high-level amplifications occurred in known oncogenes (TERT, PIK3CA), developmental genes (MECOM, SOX2, FGFR1), MYC family members (MYC, MYCL), and immunomodulators (CD274) (Figure 3B and Table S2). Further, ASC signature was significantly associated with deletions of tumor suppressors including CSMD1 (33%), CDKN2A (29%), CDKN2B (28%), RB1 (16%), PTEN (8%) (Escudero-Esparza et al. 2016) (Figure 3B and Table S3). The naive hESC signature was less associated with deep deletions than either the ASC or primed hESC signatures; however, it did specifically select for deletions in chromosome 18q. The primed hESC was enriched in chromosome 3p deletions (Figure S3C). As an alternative method for evaluating RB1 functional status, we applied a RB1 loss signature composed of 120 genes that are positively correlated with RB1 loss in breast cancer (Ertel et al., 2010). ASC High samples exhibited significantly higher RB1 loss signature scores than ASC Low samples implying that the ASC signature selects for cancers with RB1 loss-of-function alterations (Figure 3C).
Interrogation of mutation data revealed that TP53 mutations and NOTCH1 mutations were highly associated with the ASC and naive hESC signatures (Table S4). The adult stem cell signature was specifically connected with FBXW7 mutations, which occurred in approximately 10% of ASC enriched epithelial cancers. FBXW7 is a tumor suppressor that controls differentiation decisions in certain stem cell populations (Wang et al., 2012). The naive hESC signature was correlated with PRDM9 and OR4A5 mutations, while the primed hESC signature selected for cancers containing VHL mutations. PRDM9 is a histone methyltransferase that plays a major role in specifying meiotic recombination hotspots in mammals (Baudat et al., 2010). VHL is part of the E3 ubiquitin-protein ligase complex, which is involved in the ubiquitination and degradation of hypoxia inducible factors. Mutations leading to VHL loss-of-function are a major driver of clear-cell renal cell carcinomas (Gossage et al., 2015).
We confirmed that DNA amplified genes associated with developmental pathways and lineage decisions were also overexpressed at the transcript level in ASC signature enriched samples (Figure 3D). Interestingly, genes commonly overexpressed in aggressive, small cell neuroendocrine cancers such as SOX2, DLL3, and MYC family members were also amplified and overexpressed in ASC High epithelial cancers. RB1 loss and TP53 and NOTCH1 mutations, as discussed above, are also characteristic of SCN tumors. Further, over 60% of amplified protein coding genes in small cell neuroendocrine lung cancers (SCNLC) were found within the top 204 most frequently amplified genes correlated with ASC status (p-value < 1.0 × 10−100, hypergeometric test) (Rudin et al., 2012) (Figure 3E). These results support that the ASC signature selects for genomic alterations inherent to lethal epithelial cancer variants.
The adult stem cell signature is enriched in aggressive small cell neuroendocrine cancers from multiple epithelial tissues.
Given that the ASC signature selected for tumors with alterations linked to small cell neuroendocrine cancers, we further investigated this aggressive cancer subtype. Recent publications have molecularly profiled large cohorts of these tumors, thus we mined multiple gene expression datasets composed of human SCN prostate and lung cancers and their non-SCN counterparts (Beltran et al., 2011; Beltran et al., 2016; Clinical Lung Cancer Genome Project and Network Genomic Medicine, 2013; Takeuchi et al., 2006). In both prostate and lung cancers, the SCN phenotype was associated with significantly higher ASC signature scores than the non-SCN variant (Figure 4A). Other stem cell signatures, specifically those previously connected to hESCs, were activated in SCN cancers; however, only the ASC signature was significantly enriched in the SCN phenotype in all datasets (Figure 4B). Within human prostate cancer, ASC signature scores followed clinical progression with organ-confined adenocarcinomas having the lowest ASC scores, followed by metastatic castration-resistant adenocarcinoma, and with the metastatic castration-resistant SCN phenotype having the highest ASC score (Figure S4A). Applying the signature to prostate cancer mouse models revealed similar results with the ASC signature most strongly activated in the most aggressive, SCNPC phenotype (Figure S4B). A combined dataset of over 1,100 lung cancer samples further validated the preferential expression of the ASC signature in SCN cancers (Figure S4C).
Figure 4. Small cell neuroendocrine cancers are enriched for the ASC signature.
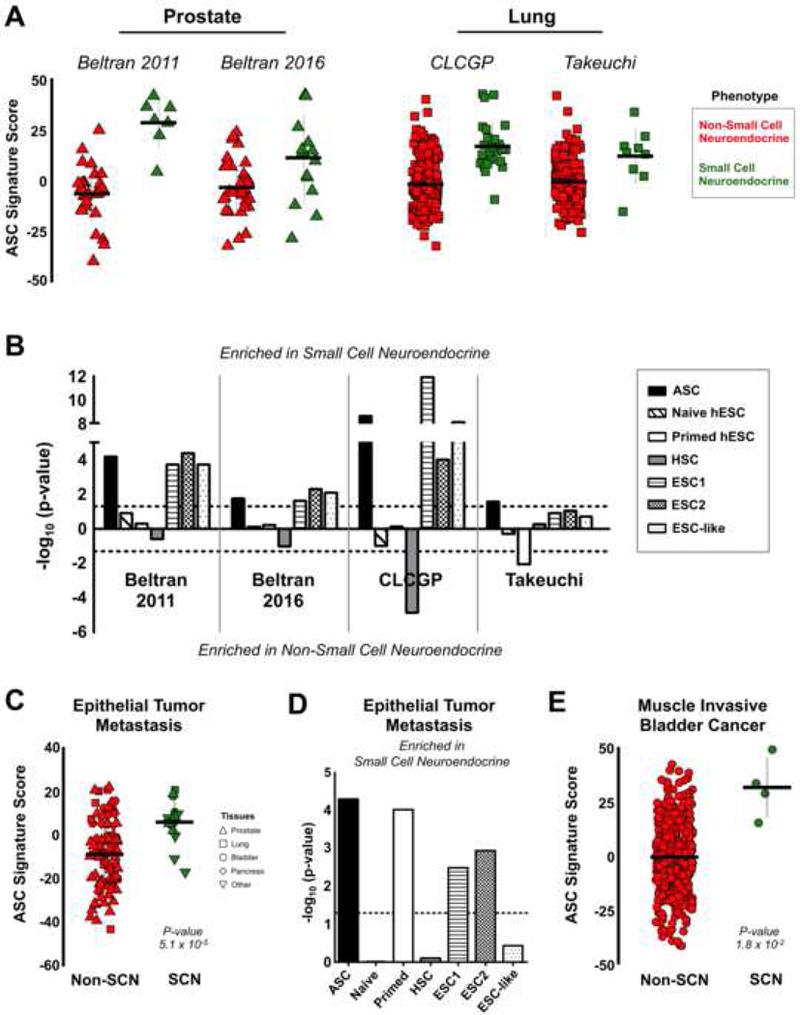
(A) ASC signature in non-small cell neuroendocrine (red) and small cell neuroendocrine (green) samples from prostate and lung cancer datasets. Takeuchi: SCNLC n = 9, Non-SCNLC n = 149. CLCGP: SCNLC n = 28, Non-SCNLC n = 233. Beltran 2016: SCNPC n = 15, Non-SCNPC n = 34. Beltran 2011: SCNPC n = 7, Non-SCNPC n = 30. Mean ± SD. (B) Statistical significance of human stem cell signatures in prostate and lung cancer datasets. Dotted line indicates the signed log10 value for a p-value = 0.05. HSC: hematopoietic stem cell signature from Eppert et al., 2011. (C) ASC signature scores in metastatic small cell neuroendocrine (n = 15) and non-small cell neuroendocrine (n = 90) cancer samples from Robinson et al., 2017. Mean ± SD. (D) Enrichment of human stem cell signatures in the metastatic cancer dataset from C. Dotted line indicates the signed log10 value for a p-value = 0.05. (E) ASC signature scores in SCN bladder cancer (n = 4) and non-SCN bladder cancer (n = 402) clinical samples from Robertson et al., 2017. Mean ± SD. See also Figure S4.
We further examined whether the ASC transcriptional signature was activated in small cell neuroendocrine cancers from additional epithelial tissues. We analyzed a dataset of metastatic cancers biopsied from over 22 organs, which included a number of epithelial derived-SCN and poorly differentiated neuroendocrine tumors (Robinson et al., 2017). Metastatic SCN tumors showed a significant enrichment in the adult stem cell signature compared to non-small cell neuroendocrine tumors from similar epithelial tissues (Figure 4C). Notably, the ASC signature performed better than other stem cell signatures tested (Figure 4D). A recent characterization of muscle invasive bladder cancers included a minor fraction of samples (~ 1%) histologically defined as small cell neuroendocrine or a mixed phenotype with a small cell neuroendocrine component (Robertson et al., 2017). Comparing the ASC signature scores between the SCN and non-SCN bladder cancers revealed that the SCN bladder cancers were significantly more adult stem cell-like (Figure 4E). Interestingly, the SCN bladder cancer sample with the lowest ASC score was the only SCN sample with a mixed phenotype. This observation was consistent with the Beltran 2011 prostate cancer dataset with the mixed SCN phenotypes having lower ASC scores than the pure SCN phenotypes. Further, the original publication described a series of gene expression-based subtypes within this same collection of bladder cancer including a poor survival neuronal subtype that contained both SCN and non-SCN histologically defined variants. This aggressive neuronal subtype exhibited the highest ASC signature score compared to the other muscle invasive bladder cancers expression subtypes (Figure S4D and S4E). In sum, these results highlight that small cell neuroendocrine cancers from multiple epithelial tissues share a transcriptional program common to human epithelial adult stem cells.
The adult stem cell signature’s association with small cell neuroendocrine cancers is not significantly influenced by other molecular signatures.
MYC signaling is prevalent in many cancers and stem cell populations thus we sought to determine if the human adult stem cell signature was substantially a MYC signature (Kim et al., 2010). Even after removing MYC and MYC target genes, the adult stem cell signature remained significantly associated with the SCNPC and SCNLC phenotypes (Figure 5A). We also examined the influence of cell cycle/proliferation genes in the adult stem cell signature. Removing the cell cycle/proliferation genes from the ASC signature did not change the general trend that epithelial derived SCN cancers were enriched in the ASC signature (Figure 5A). We removed genes that were in common between the human adult stem cell signature and ESC signatures. Again, removing these genes did not change the enrichment for the adult stem cell signature in the prostate and lung small cell neuroendocrine phenotypes though they did affect the overall significance (Figure 5A). Performing a permutation analysis with 10,000 random 50-gene signatures showed that the ASC signature exhibited a greater difference between SCN and Non-SCN samples compared to random signatures with permutation p-value ≤ 3.3 × 10⁻³ (Figure 5B). The above analyses indicate that while the ASC signature does contain some shared content with other molecular signatures, it generally remains strongly related to small cell neuroendocrine cancer subtypes even when these other signatures are accounted for.
Figure 5. Other molecular signatures do not significantly influence the ASC signature’s enrichment in small cell neuroendocrine cancers.
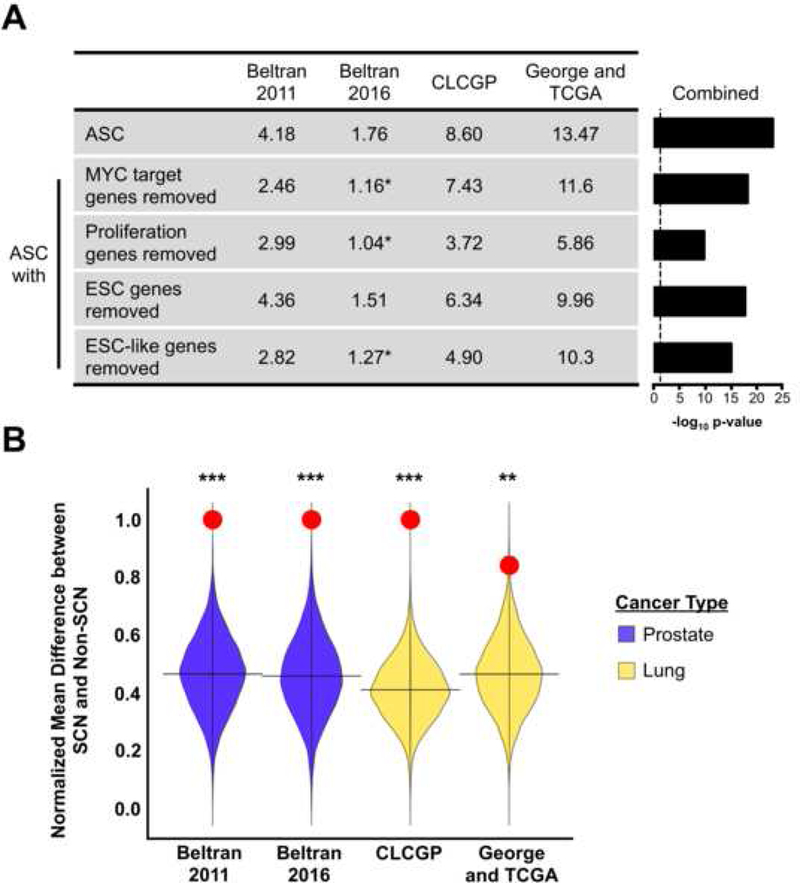
(A) Summary of gene signature enrichment in the small cell neuroendocrine phenotype for each dataset. Values represent-log10 p-values. indicates signatures that did not reach a p-value < 0.05 in the respective dataset. Dotted line represents the-log10 p-value for p = 0.05. (B) Permutation analysis comparing ASC signature (red circle) to random 50-gene signature scores in the indicated prostate and lung cancer datasets. ***Permutation p-value < 1.0 × 10⁻⁴, **P-value = 3.3 × 10⁻³.
Small cell neuroendocrine cancers from the lung and prostate share a methylation profile.
DNA methylation is a vital epigenetic modification, impacting numerous biological processes including transcription, cell fate decisions, and development (Jaenisch, 1997). The DNA methyltransferase DNMT1 was part of the adult stem cell signature (Table S1). Furthermore, we observed that ASC signature scores were highly correlated with gene expression of DNA methytransferase family members (DNMT1, DNMT3A, DNMT3B) within the human prostate and lung cancer datasets. (Figures 6A). DNMT transcripts were overexpressed in SCN prostate and lung cancer compared to the non-SCN phenotype (Figure 6B). We further examined the protein expression of DNMT1 in malignant prostate and lung tissues since 1) DNMT1 was within the ASC signature, 2) DNMT1 was the most significantly overexpressed in the SCN phenotype, and 3) DNMT1 was the most correlated DNMT with the ASC signature score (after removing DNMT1 from the signature). Consistent with results observed in clinical samples, DNMT1 was overexpressed in the SCNPC cell line and SCNPC patient derived xenografts (Figure 6C). Using prostate xenograft tissues, DNMT 1 immunohistochemistry displayed stronger staining in the small cell neuroendocrine tissues than the non-SCN (Figure 6D). DNMT 1 immunostaining of lung cancer tissue microarrays showed similar results with the SCN phenotype having the highest DNMT1 levels (Figures 6E and 6F).
Figure 6. DNMT1 is overexpressed in small cell neuroendocrine prostate and lung cancers.
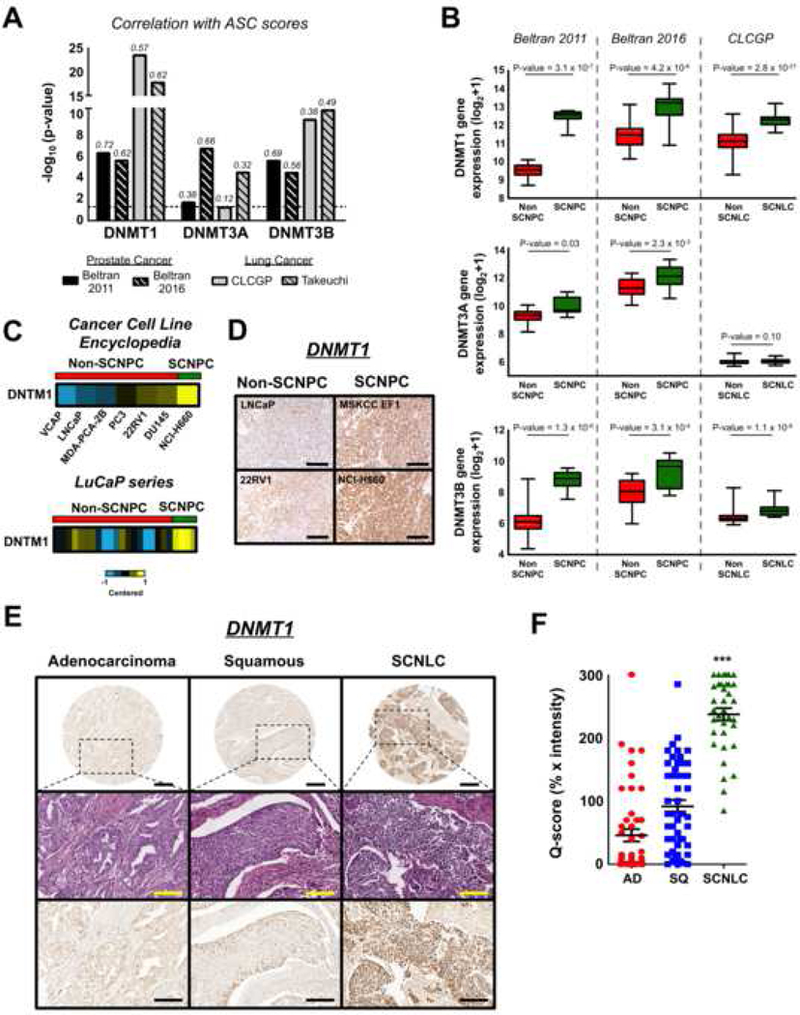
(A) Correlation of DNMT expression with ASC signature scores in prostate and lung cancer cohorts. Correlation values are shown above the individual bars. (B) DNMT gene expression in prostate and lung cancer phenotypes. Mean ± SEM. ***P-value < 0.001. (C) DNMT1 expression in prostate cancer cell lines (top, from Cancer Cell Line Encyclopedia), and patient derived xenografts (bottom, LuCaP series). LuCaP xenografts: SCNPC n = 4, Non-SCPC n = 20. (D) DNMT 1 immunostaining of prostate cancer xenograft tissue. Scale bar = 100 μm. (E) DNMT1 immunohistochemistry of lung cancer clinical samples. Top row images: scale bar = 500 μm; middle and bottom row images: scale bar = 200 μm. (F) DNMT1 immunohistochemical staining scores for the lung cancer clinical samples. AD: adenocarcinoma (n = 48), SQ: squamous cell carcinoma (n = 49), SCNLC: n = 35. Mean ± SEM. ***P-value < 1.0 × 10⁻⁵.
Given the overexpression of DNMTs in small cell neuroendocrine cancers, we were interested in defining potential methylation regulated genes shared between lung and prostate SCN cancers. To identify common differentially methylated genes between SCN and Non-SCN cancers, we first established which gene transcripts were significantly anti-correlated with their methylation status in both the human prostate cancer and lung cancer cell line datasets (Beltran et al., 2016; Iorio et al.,2016). Filtering from these 571 genes (p = 0.04, Fischer’s exact test) for genes that were either differentially hypomethylated or hypermethylated in both SCN prostate and lung cancers, we were left with 124 genes including known regulators of cell fate decisions (ASCL1, HES6, etc.) (Figure 7A and Table S5). Further, we identified a number of hypermethylated genes related to apoptotic processes including CASP8, CFLAR, and TNFRSF1A, which is consistent with previous observations (Shivapurkar et al., 2002). Functional enrichment analysis of the 124 genes revealed overrepresentation of gene sets related to neural developmental and signal transduction (Figure 7B).
Figure 7. Small cell neuroendocrine prostate and lung cancers share a core set of differentially methylated and activated genes.
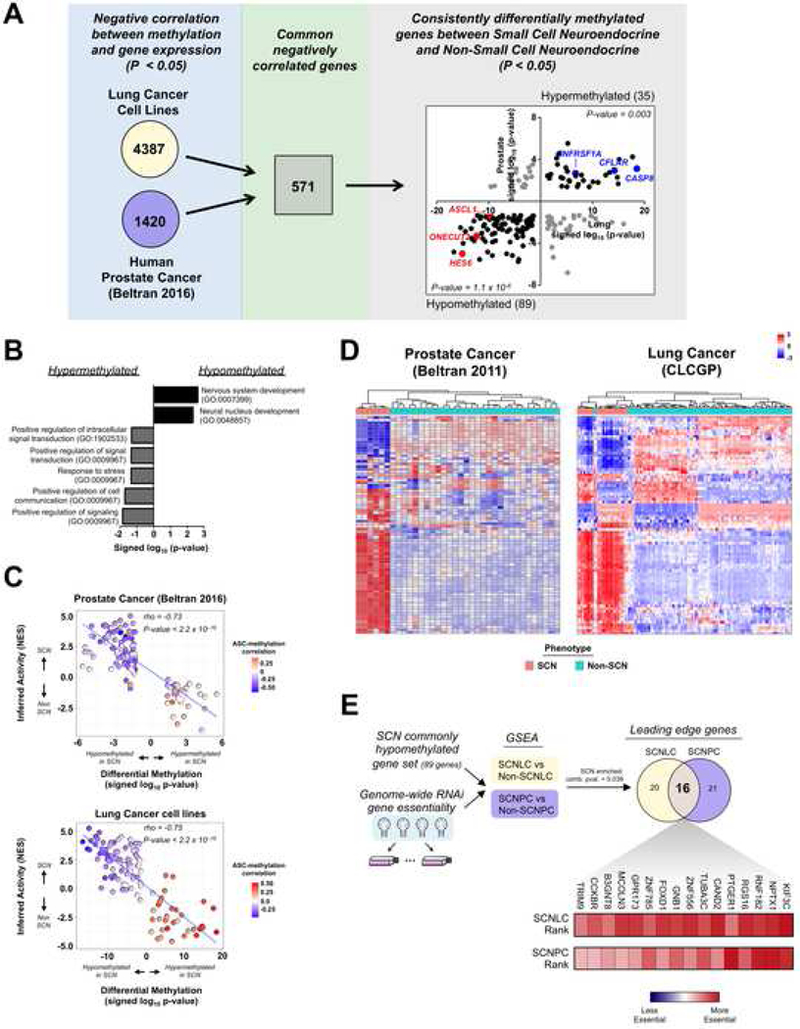
(A) Schematic for identifying common negatively correlated and differentially methylated genes in prostate cancer and lung cancer datasets. From the 571 common negatively correlated genes, 180 were differentially methylated in both datasets (shown in far right panel). Of these, 89 were hypomethylated in both datasets (p-value = 1.1 × 10⁻⁶) and 35 were hypermethylated in both datasets (p-value = 0.003). The number of genes associated with either hypermethylation or hypomethylation is in parentheses. (B) Functional categories associated with common negatively correlated and differentially methylated genes. (C) Correlation of inferred protein activation and signed log10 p-values for differentially methylated genes in the human prostate cancer (top) and lung cancer cell line (bottom) datasets. Inferred protein activation was calculated using VIPER. Inset heatmap represents the rho correlation value of each gene’s methylation status with the ASC signature score. (D) Unsupervised clustering of human prostate cancer (Beltran 2011) and lung cancer (CLCGP) datasets using the inferred activation scores of the differentially methylated genes. Scale bar represents the z-score. (E) Experimental flow-through (top) to identify commonly hypomethylated genes that are essential for SCN cancers. The heatmap reflects each gene’s essentiality ranking relative to approximately 17,000 total genes (scale bar). The combined p-value (comb. pval.) was calculated using the Stouffer’s combined method. See also Figure S5 and Table S5.
To gain insight into the activation of the differentially methylated genes in small cell neuroendocrine cancers, we generated a transcription program-based interactome using the ARACNe algorithm and gene expression data from the human prostate cancer or lung cancer cell line cohorts (Lachmann et al., 2016). We then utilized the Virtual Inference of Protein-activity by Enriched Regulon analysis (VIPER) algorithm, which infers protein activity (e.g. transcription factors, epigenetic factors, etc.) based on measurements of the transcript targets they regulate (Alvarez et al., 2016). The VIPER analysis revealed that the inferred activities of the differentially methylated genes were significantly anti-correlated with their methylation status in prostate and lung cancer datasets (Figure 7C). Further, ASC signature scores were significantly anti-correlated with methylation status and positively correlated with gene expression in the same datasets (Figure S5A). Unsupervised clustering of the human prostate cancer and lung cancer cell line datasets using the VIPER-inferred activities of the common negatively correlated and differentially methylated genes showed good separation of the SCN and non-SCN tumors (Figure S5B). Applying this same activity-based clustering to independent datasets of human prostate and lung cancer clinical samples further confirmed that the differentially methylated genes generally separate samples into their respective histological phenotypes (Figure 7D). Thus, these results support that small cell neuroendocrine cancers differentially methylate and activate a core group of genes, independent of tissue-of-origin.
To interrogate the functional essentiality of methylation regulated genes to small cell neuroendocrine biology, we mined a large-scale RNAi (shRNA) loss-of-function dataset that includes SCN and non-SCN phenotypes for both lung and prostate cancer cell lines (Tsherniak et al., 2017). We focused our analysis on the pan-tissue shared epigenetically regulated genes. Using enrichment analysis, we found that the shared hypomethylated genes (lower left quadrant of right panel in Figure 7A) were more essential for SCN cancers compared to their non-SCN counterpart. Gene set enrichment analysis enables identification of a core set of genes termed leading edge genes, which account for the enrichment signal in a given phenotype and thus represent biologically important candidates (Subramanian et al., 2005). This lung and prostate enrichment analysis resulted in an overlapping set of 16 leading edge genes that have shared essentiality in the SCN cancer phenotype (Figure 7E). This core essential gene set included genes known to control neural lineage specification (NPTX1), cell programming processes (FOXD1), and genes encoding multi-pass cell surface associated proteins (CCKBR, MCOLN3, etc.) (Boles et al., 2014; Koga et al., 2014). Though not identified as a shared leading edge gene, ASCL1 was more essential for SCN than non-SCN cancers, which is aligned with published work in neuroendocrine lung cancers (Augustyn et al., 2014) (Figure S5C). Our observations support that a core set of epigenetically regulated genes are more essential for SCN cancers and represent potential targets for the treatment of this stem-like, highly lethal phenotype.
Discussion
Advancing our understanding of the molecular underpinnings of aggressive malignancies is critical for discovering new therapeutic strategies, prognostic signatures, and biomarkers. Our pan-cancer, adult stem cell-directed approach was established to explore a relationship between human stem cell transcriptional programs and aggressive epithelial cancers independent of tissue of origin. We leveraged three human adult stem cell populations, sorted from three different epithelial tissue types, to define a pan-epithelial adult stem cell signature. Through interrogating the TCGA collection of epithelial cancers, we found that as epithelial cancers progress to an advanced, aggressive state, they activate a transcriptional program common to human epithelial adult stem cells. Furthermore, highly lethal, small cell neuroendocrine cancers arising in multiple epithelial tissues converge, in part, onto the adult stem cell signature. Taken together, our results support a molecular link between human adult stem cells and aggressive cancers from multiple epithelial tissues. The ASC molecular phenotype is particularly strong in small cell neuroendocrine cancers and results to an extent from epigenetic reprogramming.
The observed parallels between stem cells and cancers have led other groups to investigate their shared molecular programs. These studies have largely focused on identifying molecular commonalities between human embryonic stem cells and human cancers. Both expression gene set- and gene module-based analyses have provided evidence that poorly differentiated cancers from different tissues activate gene programs found in human embryonic stem cells (Ben-Porath et al., 2008; Wong et al., 2008). Indeed, our analyses revealed similar results using these published hESC signatures. Unlike the previous studies, our approach benefits from the inclusion of a human pantissue adult stem cell comparator. Our rank-based pan-tissue signature generation approach enabled us to define a pan-epithelial adult stem cell transcriptional fingerprint shared in sorted adult stem cell populations from three human tissue types. We found that approximately 20–25% of the genes in the ASC signature were in common with previously described ESC or ESC-like gene expression signatures. This overlap is anticipated since adult stem cells share a number of features with embryonic stem cells including self-renewal. Removing these common hESC and adult stem genes from the ASC signature did not substantially influence our results (Figure 5A). Overall, the adult stem cell-defined signature generally outperformed embryonic stem cell-defined signatures in identifying aggressive tumors with poor survival. Taken together, our findings support that genes specific for human epithelial adult stem cells are reflecting an underlying biology in aggressive epithelial cancers from a variety of tissue types.
Epithelial tissues derived from different developmental lineages can develop malignancies exhibiting neuroendocrine differentiation either de novo or in some cases as a treatment-resistance mechanism. Strikingly, our TCGA pan-epithelial cancer dataset contained only a handful of histologically defined small cell neuroendocrine cancers, yet the adult stem cell signature was significantly associated with genetic alterations common to this highly lethal phenotype. The ASC signature was consistently enriched in SCN cancers independent of whether they emerged de novo or as an adaptive response to treatment implying that this underlying stemness component is independent of the cancer’s evolutionary route (Figure 4). Cancer cells-of-origin can prime tumors towards specific phenotypes and molecular features of the cancer-initiating cell can be co-opted by the corresponding tumor (Latil et al., 2017; Visvader, 2011). This combined with evidence that multiple epithelial tissues develop biphenotypic SCN and non-SCN tumors with nearly identical genomic alterations supports an epithelial stem-like cell as a potential cell-of-origin for human epithelial derived neuroendocrine cancers (Calvalcanti et al., 2017; Cheng et al., 2005; Williamson et al., 2011). Indeed, genetically engineered and in vivo regeneration mouse models have provided evidence that epithelial cells can be the cells-of-origin for neuroendocrine prostate and lung cancers (Lee et al., 2016; Sutherland et al., 2011; Zhou et al., 2007).
For both adult stem cells and SCN cancers, there is an appreciated epigenetic component that dictates lineage decisions. The presence of DNMT1 in our adult stem cell signature led us to observe that SCN prostate and lung cancers generally overexpressed DNA methyltransferase family members with DNMT1 being the most overexpressed (Figure 6). While our work focused on DNA methyltransferases, we did observe upregulation of genes encoding PcG proteins including EZH2 in the small cell neuroendocrine cancers, which has been described by others (Beltran et al., 2016; Byers et al., 2012). The relationship between EZH2 and DNMTs is well established in other cellular contexts and warrants additional investigation in SCN cancers and human adult stem cells. Given the aforementioned molecular links between adult stem cells and SCN cancers, it’s possible that cancers with an inherently high adult stem cell signature are primed to develop into the small cell neuroendocrine phenotype following treatment. With the increasing longitudinal sampling and molecular profiling of treated tumors in the clinic, it will be informative to 1) interrogate the utility of the ASC signature to predict tumors that will become small cell neuroendocrine following treatment and 2) further understand the common molecular mechanisms regulating these lethal cancer variants.
Our work further uncovered a shared DNA methylation link between small cell neuroendocrine cancers from different epithelial tissues. We found that small cell neuroendocrine cancers from different epithelial tissues 1) have a highly stem-like phenotype and 2) exhibit common epigenetic alterations. Combined DNA methylation and signaling activation analyses provided insight into the preferential hypomethylation and activation of neural developmental regulators in SCN cancers. Notably, genome-wide functional screening data support that a number of these genes may be important for SCN biology. Interestingly, we found components of cell death processes as hypermethylated and down regulated in the small cell neuroendocrine phenotype (Figure 7A). Pre-clinical studies have provided evidence that combination treatment with DNMT inhibitors can sensitize SCNLC cells to programmed cell death partially through restoration of caspase-8 expression (Sabari et al., 2017). These results further support targeting epigenetic-based tumor lineage commitment to a more differentiated state as a potential treatment strategy, analogous to all-trans retinoic acid based differentiation therapy in acute promyelocytic leukemia. Indeed, reversing cell differentiation states through the use of epigenetic modifiers has shown success in restoring sensitivity to anti-androgen therapy in a pre-clinical model of SCNPC (Ku et al., 2017).
In conclusion, our results demonstrate a molecular connection between normal human adult stem cells and aggressive epithelial cancers. Disrupting pathways or signaling hubs vital for maintaining stem-like attributes is an attractive strategy for controlling tumor growth in numerous cancers (Kreso et al., 2014; Takebe et al., 2015). The advancement of targeted cancer therapies has resulted in an increased prevalence of therapy-resistant small cell neuroendocrine cancer variants that we find are notably enriched for adult stem cell attributes. Thus, our pan-cancer analysis establishes an adult stem cell-based transcriptional and epigenetic foundation for identifying additional therapeutic targets for the treatment of aggressive epithelial malignancies from multiple tissue types.
STAR Methods
Contact for Reagent and Resource Sharing
Further information and requests for resources and reagents should be directed to and will be fulfilled by the Lead Contact, Thomas G. Graeber (tgraeber@mednet.ucla.edu).
Experimental Model and Subject Details
Cell Lines
LNCaP and 22Rv1 prostate cancer cell lines were grown in RPMI-1640 media supplemented with 10% fetal bovine serum and penicillin/streptomycin. The MSKCC EF1 small cell neuroendocrine prostate cancer cell line was grown in RPMI-1640 media supplemented with 10% fetal bovine serum and penicillin/streptomycin (Lee et al., 2018). NCI-H660 small cell neuroendocrine prostate cancer cell line was grown in advanced DMEM/F12 media supplemented with EGF (PeproTech Inc., 10 ng/mL final concentration), FGF basic (PeproTech Inc., 10 ng/mL final concentration) and Glutamax (Gibco, 1X).
Prostate Cancer Xenografts for Immunohistochemistry
Immunocompromised male mice (strain: NOD.Cg-PRKDCscid Il2rgtm1Wjl/SzJ; 6–8 weeks old) were subcutaneously injected with 1.0 × 10⁶ prostate cancer cells from either the LNCaP, 22Rv1, MSKCC EF1, or NCI-H660 cell line. Tumor tissue was collected after 1 month and fixed in 10% buffered formalin (in PBS) overnight. Tissues were then paraffin-embedded, sectioned to 4 μm thickness, and mounted on Superfrost glass slides (Fisher Scientific, Cat#12–550-12).
Method Details
Data Acquisition and Processing
We downloaded level 3 RNA-seq data from The Cancer Genome Atlas using the TCGA-assembler tool (Zhu et al., 2014). For the complete pan-TCGA epithelial cancer dataset, raw counts from each cancer dataset were combined, quantile normalized, and log2 (x+1) transformed. A list of the cancers and their abbreviations in the complete pan-epithelial cancer dataset has been included in Table S6. For analyses involving individual TCGA cancers, raw counts were upper quartile normalized then log2 (x+1) transformed. We collected mutation events from MAF files that were downloaded for each individual TCGA epithelial cancer from Firebrowse (www.firebrowse.org). GISTIC copy number calls for each epithelial cancer were downloaded from Firebrowse and combined to make the pan- epithelial cancer dataset.
Stem cell associated RNA-seq and microarray gene expression datasets were downloaded from GSE31257 (Jung et al., 2011), GSE16997 (Lim et al., 2009), GSE68340 (Jung et al., 2015), GSE30377 (Eppert et al., 2011), GSE59435 (Theunissen et al., 2014), E-MTAB-2857 (Takashima et al., 2014), and GSE76970 (Pastor et al., 2016). The human ESC1 and ESC2 gene set-based signatures were acquired from Ben-Porath et al., 2008, and the ESC-like gene set-based signature was from Wong et al., 2008. Processing of the human prostate stem cell and non-stem cell and the Beltran et al. 2011 and 2016 human prostate cancer gene expression datasets have been described previously (Lee et al. 2016; Smith et al., 2015). The CLCGP et al. and Takeuchi et al. lung cancer gene expression datasets were downloaded from www.uni-koeln.de/med-fak/clcgp and GSE11969, respectively. For the combined small cell neuroendocrine lung cancer, lung adenocarcinoma, and lung squamous cell carcinoma dataset shown in Figure S4C and Figure 5B, raw counts data was downloaded from EGAS00001000925 (SCNLC; George et al., 2015) and Firebrowe for the TCGA LUAD and LUSC datasets (The Cancer Genome Atlas Research Network, 2012b; The Cancer Genome Atlas Research Network, 2014), upper quartile normalized then combined. LuCaP prostate cancer patient derived xenograft (PDX) gene expression data was downloaded from GSE66187 (Zhang et al., 2015). The prostate cancer mouse model dataset was downloaded from GSE90891 (Ku et al., 2017), and the prostate cancer PDX dataset was downloaded from GSE59986 (Akamatsu et al., 2015). Metastatic cancer gene expression data from Robinson et al., 2015 (phs000915.v1.p1) and Robinson et al., 2017 (phs000673.v2.p1) was obtained from the Database of Genotypes and Phenotypes (dbGaP) as FASTQs then processed through the TOIL pipeline with default settings. Raw reads were upper quartile normalized then log2 (x+1) transformed.
Immunohistochemistry
For DNMT1 immunostaining, unstained sections of prostate xenograft tumor tissue or human lung cancer tissue microarrays (purchased from US Biomax, Derwood, MD) were deparaffinized, hydrated, and subjected to heat-induced antigen retrieval using 40 mM sodium citrate buffer (pH 6.0). Staining was performed using an anti-DNMT1 mouse monoclonal antibody (1:450, Abcam) at 4 °C overnight. Slides were then stained with a peroxidase polymer anti-mouse Ig reagent (Vector Labs, Cat#MP-7402) for 60 minutes. Liquid DAB + substrate reagent (Dako, K346b) was added to the slides to enable chromogenic detection.
Quantification and Statistical Analysis
Generation of Stem Cell Signatures
To generate the human stem cell signatures, gene naming was standardized across the different sequencing platforms and stem cell datasets using the org.HS.eg.db package in R. Differential expression analysis was performed on a dichotomy (stem cell vs non-stem cell for epithelial cell comparisons or naive vs primed) within each dataset. For the human epithelial cell datasets, we classified the Lin-CD49fHiEpCAM- mammary stem cell (n = 3), the human prostate Trop2+CD49fHi (n = 10), and the human intestinal EphB2Hi/Med (n = 6) populations as adult stem cells. The human Lin- CD49f-EpCAM+ mammary luminal (n = 3), human prostate Trop2+CD49fLo (n = 10), and human intestinal EphB2Lo/Neg cell (n = 5) populations were classified as non-stem cells. The EphB2Hi and EphB2Med populations and the EphB2Lo and EphB2Neg populations were combined to increase sample numbers for the stem cell and non-stem cell group in the analysis. For microarray data, we used limma to create a linear model of the log2 transformed data to moderate standard error. For the comparison, a ranked signature was generated using the signed log p-values from limma. Ranked signatures were intersected to find common genes then compared using the rank-rank hypergeometric test (Plaisier et al, 2010). Sets were considered correlated if they had a maximum rank-rank log p-value > 80. The top 50 averaged ranked genes were included into the signature for the specific human stem cell population. The list of genes for each generated stem cell signature is included in Table S1.
Stem Cell Signature Scoring
To calculate signature scores for each sample, the gene expression z-score for each gene within the signature was summed in the respective dataset (e.g. cancer dataset, stem cell validation dataset, etc.). The adult stem cell signature was validated in an independent dataset of human intestinal cells sorted on the surface marker PTK7 in Figure 1C (PTK7Hi/Med = intestine stem cell, n = 4; PTK7Lo/Neg = intestine differentiated cell, n = 4) (Jung et al., 2015). The naive and primed hESC signatures were validated in an independent dataset from Pastor et al., 2016, which is RNA-seq based. For the Pastor et al., 2016 dataset, raw counts were normalized using the estimateSizeFactors function in the DESeq2 package and then converted to z-scores (Love et al., 2014). P-values were calculated using a student’s t-test for stem cell signature validation analyses and analyses comparing stem cell signature enrichment in small cell neuroendocrine and non-small cell neuroendocrine cancer samples.
For analyses involving tumor staging and grading data, a summary stem signature score was calculated using the average stem score across all it constituent tumors. These values were then clustered using Euclidean distance and complete linkage using the pheatmap package in R. P-values for staging and grading were calculated using a t-test across all the individual cancers between stages 1 and 2 versus stages 3 and 4 or grades 1 and 2 versus grades 3 and 4. Results can be found in Figures 2A, S2A, S2B. For prostate cancer gleason score and staging analyses, p-values were calculated using ANOVA.
To remove MYC associated genes from the adult stem cell signature, we identified genes within the 50-gene adult stem cell signature that were also in common with one of the following MYC related gene signatures from the Molecular Signatures Database (MSigDB) (Hallmarks MYC Targets V1, Hallmarks MYC Targets V2, Dang MYC Targets Up, Ben-Porath MYC MAX Targets, and Ben-Porath MYC Targets with EBox) or the human MYC module from Kim et al., 2010. After removing these genes from the signature, the signature scores were calculated using the expression z-scores for each remaining gene in the signature and then summed together. To remove cell cycle and proliferation associated genes from the adult stem cell signature, we identified genes within the 50-gene adult stem cell signature that were also in common with one of the following cell cycle or proliferation related databases or gene signatures from MSigDB: Cyclebase (Santos et al., 2015), Ben-Porath Proliferation, Ben-Porath Cycling Genes, KEGG cell cycle. To remove ESC associated signature genes from the ASC signature, we identified genes within the 50-gene adult stem cell signature that were also in common with the Ben-Porath ES_1 signature (for ESC genes) or Wong Embryonic Stem Cell Core signature (for ESC-like genes) from MSigDB (Ben-Porath et al., 2008, Wong et al., 2008). The signature scores were calculated using the remaining genes with the same method as described for the MYC removed stem cell signatures. P-values were calculated using student’s t-test. P-values for independent datasets were combined using the Fischer method with a chi-squared statistic. Results can be found in Figure 5A.
To assess the robustness of signature scores, we designed a permutation test of random 50-gene signatures (10,000 permutations) using the mean difference between the small cell neuroendocrine and non-small cell neuroendocrine phenotypes in the indicated prostate or lung cancer datasets in Figure 5B. Permutation p-values are the percentage of normalized mean difference (NMD) scores using random 50-gene signatures at or more extreme than the observed NMD score using the adult stem cell signature. Results are presented in Figure 5B. The George and TCGA combined lung cancer dataset described and shown in Figure S4C and Figure 5 are the same dataset.
Prostate Cancer Staging Prediction
Using ordinal logistic regression two models based on “gleason score” alone or “gleason plus ASC score” were compared. The p-value was derived using a likelihood ratio test between the full and restricted model (Hoadley et al., 2014). Ordinal logistic regressions were performed using polr in the MASS package in R. Gleason was ordered via (6, 7, 8, 9, 10) and stage (T2a, T2b, T2c, T3a, T3b, T4).
Survival Analysis
We used the pan-epithelial cancer gene expression dataset and stratified samples into High signature score and Low signature score groups based on +/− 1 standard deviation from the mean signature score. We used the R package survival and p-values were calculated using Cox regression with covariates as cancer type, age, and gender for “Cancer Types” or molecular subtypes (52 subtypes defined from the compendium of TCGA publications; e.g. PAM50 subtypes in breast cancer, mRNA subtypes in bladder cancer, etc.), age, and gene for “Cancer Subtypes.” Results from these analyses are presented in Figures 2B and 2C.
To control for cell cycle and proliferation, we developed a proliferation signature using genes found in one of the following databases or gene signatures from Cyclebase or MSigDB: Ben-Porath Proliferation, Ben-Porath Cycling Genes, KEGG cell cycle. We then removed genes from the adult stem cell signature that were in common with our proliferation signature, calculated the signature score as described in the Stem Cell Signature Scoring section (in Methods), stratified samples into High and Low, and performed the survival analysis. The results from this analysis are shown as “Proliferation genes removed” in Figure 2D. We also removed samples that were classified as both adult stem cell signature High and proliferation signature High and performed the survival analysis using the remaining adult stem cell signature High samples. The results from this analysis are shown as “Proliferation high samples removed” in Figure 2D. To calculate adult stem cell signature associated survival within individual cancers, samples were stratified into High and Low groups based on +/− 1 standard deviation from the mean signature score within that respective cancer dataset. Hazard ratios and log ranked p-values were calculated using the R package survival.
Stem Cell Signature Associated Genomic Alterations
To identify mutations associated with the stem cell signature, we created 2×2 contingency tables with mutational status (mutated vs non mutated) and stem signature status (samples +/− 1 standard deviation of the mean score in the pan-epithelial cancer gene express dataset) and performed a 2-way hypergeometric test for each gene. Genes were considered mutated if the mutation was non-synonymous (all mutations not classified as “SILENT” or “RNA”). An analogous analysis was performed using copy number alterations and stem cell signature status. We compared high-level amplifications (GISTIC = 2) to diploid, shallow, and deep deletions (GISTIC of 0, −1, −2) for each gene. For copy number deletions, we compared deep deletions (GISTIC = −2) to diploid, shallow, and high-level amplifications (GISTIC of 0, 1, 2) for each gene. P-values were corrected for multiple hypotheses using the Benjamini-Hochberg method.
To estimate the significance of common amplifications found in small cell neuroendocrine lung cancers that are also associated with ASC status, we performed a hypergeometric test using a list of SCNLC amplifications from Rudin et al., 2012. Among the population of all coding genes (~18,000), 290 SCNLC protein-coding gene amplifications were found within the list of amplifications associated with ASC status. Of those 290 protein-coding genes, 181 were within the top 204 amplifications associated with ASC status, as ordered by amplification frequency. We chose the cutoff at the top 204 amplifications since this is where we observed the largest change in ASC associated amplification frequency between two successive SCNLC associated amplifications.
DNMT1 Expression Analysis
DNMT isoform expression was obtained from the indicated datasets in Figure 6 and as described in Data Acquisition and Processing (in Methods). P-values associated with differential DNMT isoform expression were calculated using student’s t-test for prostate and lung cancer datasets. DNMT 1 immunostained lung tissue microarrays were scored by a trained pathologist. DNMT1 immunostain scoring (Q-score) was calculated by multiplying the intensity of the staining (1–3) by the percentage of cells stained. The number of samples scored for each lung cancer phenotype is indicated in the legend for Figure 6. The maximum Q-score is 300 and tissue microarray cores that were negative for DNMT1 staining were given a Q-score of 0. ANOVA analysis was performed using Graphpad Prism 5.
DNA Methylation Analysis
Lung cell line 450K array data was obtained in processed format from GSE68379 (Iorio et al., 2016). Prostate cancer reduced representation bisulfite sequencing (RRBS) data was obtained from dbGaP (phs000909.v1.p1; Beltran et al., 2016) and aligned to hg38 using bwa-meth (Pedersen et al., 2014). Methylation levels were expressed as β-values, indicating the overall proportion of methylation at each particular site [methylated/(methylated+unmethylated)]. For downstream analysis, site-level data was averaged to gene-level methylation data, using either the IlluminaHumanMethylation450k.db package to provide mappings between probe IDs and genes, or using track files from the UCSC table browser to map CpG sites to gene locations. All subsequent analyses were performed in R. To compare the relationship between methylation and expression at different genomic locations, site-based measurements were averaged to gene level for various gene regions including locations 0 – 1500 bp upstream of the transcription start site (TSS1500, promoter region), TSS1500 and 1st exon, 1st exon alone, and gene body alone. Spearman’s correlation was calculated between methylation and expression data for each gene using the R function cor.test and samples where both types of data were available. Methylation measurements covering TSS1500 and 1st exon were used for further analysis because it yielded measurements for more genes than other genomic locations tested and had a high proportion of genes with negative methylation-expression correlation, as previously appreciated and reported (Brenet et al., 2011; Schultz et al., 2015). Spearman’s rank correlation test was used to filter for genes with significant negative correlation (p-value < 0.05). Using this filtering criteria, we were left with 4387 genes for the lung cancer cell lines dataset and 1420 genes for the human prostate cancer dataset. The overlap of these two sets resulted in 571 commonly negatively correlated genes.
To calculate differentially methylated genes, Wilcoxon rank-sum test was performed for each gene. Differentially methylated genes were called for p-value < 0.05. Genes were classified into hypermethylated and hypomethylated using the Hodges-Lehman estimator, which is a nonparametric measure of the location parameter. To calculate the direction of the shift in ranks between the two groups for each gene, all the possible differences between the samples classified as small cell neuroendocrine and samples classified as non-small cell neuroendocrine were calculated. The sign of the median of all the pairwise differences was used to determine the direction of the location shift. This was implemented using the R function wilcox.test. From the 571 common negatively correlated genes, 180 were consistently differentially methylated in the prostate and lung cancer datasets. Of these, 89 were hypomethylated and 35 were hypermethylated in the small cell neuroendocrine phenotype (Table S5).
To identify overrepresented gene sets associated with negatively correlated and consistently differentially methylated genes in the small cell neuroendocrine phenotype, we utilized the list of 124 consistently differentially methylated genes identified by the Wilcoxon rank-sum test. Hypomethylated or hypermethylated genes were input into the PANTHER overrepresentation test (release 4–13-17, Bonferroni correction applied) (Mi et al., 2013).
VIPER Analysis
ARACNe-AP, a computationally tractable version of the original ARACNe framework, was used to reconstruct gene regulatory networks (Lachmann et al., 2016). For each individual prostate and lung cancer dataset, networks were built using the RNA-seq data from the 124 genes whose expression was negatively correlated with methylation status and were consistently differentially methylated between small cell neuroendocrine and non-small cell neuroendocrine phenotypes. The 124 genes are included in Table S5. ARACNe reconstructs networks using multiple bootstraps and an information-theoretic framework that calculates the mutual information (MI) between all pairs of features. For each bootstrap, interactions are pruned if they do not exceed a MI threshold dependent on the number of samples, or if they are considered indirect via a first order data processing inequality based filter. Using a poisson distribution based significance calculation on the number of times an interaction is detected across the multiple bootstraps, a consensus network is built. The algorithm was run using 100 bootstraps, a threshold p-value of 1.0 × 10⁻⁸, and bonferroni corrected q-values of 0.05 for the consolidation step.
Normalized enrichment scores (NES) for creation of ASC correlations were created using multi-sample VIPER with the 124-gene regulon on the small cell neuroendocrine to non-small cell neuroendocrine dichotomy, including only genes with ten or more targets. For each regulator-target gene interaction, the regulon consists of two terms: 1) the likelihood of a given regulator-target mode of regulation (MoR) is determined using a 3 Gaussian mixture model (positive, negative, or no regulation) from the distribution of regulator-target spearman correlations across the whole network and 2) the regulator-target interaction confidence term which is the mutual information value from ARACNe. A rank based enrichment test on the dichotomy takes into account the MoR, the interaction confidence term, and was compared to a sample-shuffled null model.
For clustering, computational inference of upstream regulator activity was performed using a single sample version of VIPER on the 124 gene networks from ARACNe. Only those genes that were shared across the Beltran et al. 2011, Beltran et al. 2016, CLCGP et al., 2013, and the lung cancer cell lines (Iorio et al., 2016) datasets, and included ten or more targets were used, which left 80 gene activities. Unsupervised clustering (correlation, complete linkage) was performed using the z-normalized activities of these 80 genes.
To detect likely mischaracterized samples in the Beltran et al. 2016 dataset, a linear discriminant analysis (LDA) was performed using the integrated neuroendocrine scores and androgen receptor scores from Beltran et al., 2016. Leave one out cross validation was used to predict each sample using the remaining data. Two samples NEPC samples WCMC7520 and WCMC192 were classified as non-small cell neuroendocrine by LDA and removed from the ARACNe and VIPER analyses. WCMC7520 was also removed from ARACNe and VIPER analyses involving the Beltran et al., 2011 prostate cancer dataset.
Small Cell Neuroendocrine Cancer Gene Essentiality
We downloaded genome-wide, shRNA loss-of-function screening data from Project Achilles (v2.20.2; https://portals.broadinstitute.org/achilles) to determine which commonly methylated regulated genes that small cell neuroendocrine cancers would have preferential dependency for. The differential essentiality of each gene for lung small cell neuroendocrine vs non-small cell neuroendocrine was calculated using a directionally signed log t-test p-value. Since prostate only has one SCN cell line, the differential gene essentiality was determined by calculating the mean and standard deviation for each gene in the non-small cell neuroendocrine prostate cell lines (n = 6) then z-normalizing the small cell neuroendocrine cell line, by gene, using these values. All genes (Approximately 17,000) were ranked according to their essentiality for small cell neuroendocrine cancers compared to the all samples in each dataset. GSEA was performed in classic mode using the commonly hypomethylated SCN genes described in (89 genes; Table S5) with the differential gene essentiality list for prostate and lung cancer cell lines. Overlapping lung and prostate cancer leading edge genes, which were outputted from the GSEA analysis, were identified and shown in Figure 7E. We chose to focus on leading edge genes since these genes contribute the most to a given gene set’s enrichment and thus represent biologically important candidates.
Supplementary Material
Table S2. Copy number amplifications significantly associated with human stem cell signatures (q-value < 0.05), Related to Figure 3.
Table S3. Copy number deletions significantly associated with human stem cell signatures (q-value < 0.05), Related to Figure 3.
Table S5. Common negatively correlated and differentially methylated genes in small cell neuroendocrine prostate and lung cancers, Related to Figure 7.
Key Resources Table.
| REAGENT or RESOURCE | SOURCE | IDENTIFIER |
|---|---|---|
| Antibodies | ||
| Mouse anti-human DNMT1 | Abcam | Cat#ab13537;RRID:AB_300438 |
| Biological Samples | ||
| Human lung cancer tissue microarrays | US Biomax | Cat#HLug-NSCLC150PT-01;Cat#BC04002a;Cat#LC1009 |
| Chemicals, Peptides, and Recombinant Proteins | ||
| Anti-mouse Ig reagent | Vector Laboratories | Cat#MP-7402;RRID:AB_23336528 |
| Dako Liquid DAB+ substrate chromagen system | Agilent | Cat#K3468 |
| FisherBrand Superfrost Plus Microscope Slides | Thermo Fisher Scientific | Cat#12-550-15 |
| Gibco Advanced DMEM/F12 | Thermo Fisher Scientific | Cat#12634010 |
| Gibco RPMI Medium 1640 | Thermo Fisher Scientific | Cat#11879020 |
| Penicillin/Streptomycin | Omega Scientific | Cat#PS-20 |
| Fetal Bovine Serum | Omega Scientific | Cat#FB-06 |
| Human FGF Basic | PeproTech | Cat#10018B |
| Human EGF | PeproTech | Cat#AF-100-15 |
| Gibco Glutamax | Thermo Fisher Scientific | Cat#35050061 |
| Experimental Models: Cell Lines | ||
| LNCaP | ATCC | RRID:CVCL_1379 |
| 22Rv1 | ATCC | RRID:CVCL_1576 |
| NCI-H660 | ATCC | RRID:CVCL_1576 |
| MSKCC EF1 | Lee et al., 2018 | N/A |
| Experimental Models: Organisms/Strains | ||
| Mouse: NOD.Cg-PRKDCscid II2rgtm1WjI/SzJ | Jackson Laboratory | JAX:005557 |
| Software and Algorithms | ||
| TCGA-assembler | Zhu et al., 2014 | PMID:24874569 |
| org.HS.eg.db | N/A | http://bioconductor.org/packages/org.Hs.eg.db/ |
| BWA-meth | Pedersen et al., 2014 | N/A |
| ARACNe-AP | Lachmann et al., 2016 | PMID:27153652 |
| VIPER | Alvarez et al., 2016 | PMID:27322546 |
| PANTHER | NA | http://www.pantherdb.org/;RRID:SCR_004869 |
| pheatmap | N/A | https://cran.rproject.org/web/packages/pheatmap/ |
| limma | N/A | RRID:SCR_010943 |
| DESeq2 | Love et al., 2014 | RRID:SCR_015687 |
| Rank-rank hypergeomtric overlap | Plaisier et al., 2011 | http://systems.crump.ucla.edu/rankrank/rankranksimple.php;RRID:SCR_014024 |
| Survival analysis-Survival | N/A | https://cran.rproject.org/web/packages/survival/index.html |
| R statistical package | N/A | http://www.rproject.org/;RRID:SCR_001905 |
| Prism 5 | Graphpad software | https://www.graphpad.com/scientificsoftware/prism/;RRID:SCR_001905 |
| Gene Set Enrichment Analysis | Subramanian et al., 2005 | RRID:SCR_003199 |
| IlluminaHumanMethylation450k.db | N/A | http://bioconductor.org/packages/IlluminaHumanMethylation450k.db/ |
Acknowledgements
We thank Josh Stuart and members of the O.N.W. and T.G.G. laboratories for helpful comments and discussion on the manuscript. We thank the UCLA Tissue Procurement Core Laboratory for assistance on processing and H&E staining of cancer tissue. B.A.S. is supported by a Prostate Cancer Foundation Young Investigator Award. J. W. P. is supported a National Institutes of Health K99/R00 Pathway to Independence award (K99CA218731). K.M.S. is supported by the UCLA Medical Scientist Training Program (NIH NIGMS training grant GM08042). J.H. is supported by the National Institutes of Health (1R01CA181242, 1R01CA172603, 1R01CA205001, 1U54CA217297, 1R01CA212403, 1R01CA200853), the Department of Defense Prostate Cancer Research Program (PC150382), and the Prostate Cancer Foundation. O.N.W. is supported by the National Institutes of Health (U01 CA164188–01A), a Prostate Cancer Foundation Challenge Award, and partially supported by the Eli and Edythe Broad Center of Regenerative Medicine and Stem Cell Research. O.N.W. is an investigator of the Parker Institute for Cancer Immunotherapy, and this research was supported by funds from the Parker Institute for Cancer Immunotherapy, grant number 20163828. T.G.G. is supported by the National Institutes of Health (P01 CA168585), an American Cancer Society Research Scholar Award (RSG-12–257-01-TBE), and the National Center for Advancing Translational Sciences UCLA CTSI grant UL1TR000124. O.N.W. and T.G.G. are supported by the UCLA Prostate SPORE (NIH P50CA092131), the Eli and Edythe Broad Center of Regenerative Medicine and Stem Cell Research-Hal Gaba Director’s Fund for Cancer Stem Cell Research Award, and the W.M. Keck Foundation.
Footnotes
Declaration of Interests
The authors declare no competing interests.
References
- Akamatsu S, Wyatt AW, Lin D, Lysakowski S, Zhang F, Kim S, Tse C, Wang K, Mo F, Haegert A, et al. (2015). The placental gene PEG10 promotes progression of neuroendocrine prostate cancer. Cell Rep. 12, 922–936. [DOI] [PubMed] [Google Scholar]
- Alvarez MJ, Shen Y, Giorgi FM, Lachmann A, Ding BB, Ye BH, and Califano A (2016). Functional characterization of somatic mutations in cancer using network-based inference of protein activity. Nat. Genet. 48, 838–847. [DOI] [PMC free article] [PubMed] [Google Scholar]
- Augustyn A, Morromeo M, Wang T, Fujimoto J, Shao C, Dospoy PD, Lee V, Tan C, Sullivan JP, Larsen JP, et al. (2014). ASCL1 is a lineage oncogene providing therapeutic targets for high-grade neuroendocrine lung cancers. Proc. Natl. Acad. Sci. USA 111, 14788–14793. [DOI] [PMC free article] [PubMed] [Google Scholar]
- Bailey MH, Tokheim C, Porta-Pardo E, Sengupta S, Bertrand D, Weerasinghe A, Colaprico A, Wendl MC, Kim J, Reardon B, et al. (2018). Comprehensive characterization of cancer driver genes and mutations. Cell 173, 371–385. [DOI] [PMC free article] [PubMed] [Google Scholar]
- Baudat F, Buard J, Grey C, Fledel-Alon A, Ober C, Przeworski M, Coop G, and de Massy B (2010). PRDM9 is a major determinant of meiotic recombination hotspots in humans and mice. Science 327, 836–840. [DOI] [PMC free article] [PubMed] [Google Scholar]
- Beltran H, Rickman DS, Park K, Chae SS, Sboner A, MacDonald TY, Wang Y, Sheikh KL, Terry S, Tagawa ST, et al. (2011). Molecular characterization of neuroendocrine prostate cancer and identification of new drug targets. Cancer Discov. 1, 487–495. [DOI] [PMC free article] [PubMed] [Google Scholar]
- Beltran H, Prandi D, Mosquera JM, Benelli M, Puca L, Cyrta J, Marotz C, Giannopoulou E, Chakravarthi BVSK, Varambally S, et al. (2016). Divergent clonal evolution of castration- resistant neuroendocrine prostate cancer. Nat. Med. 22, 298–305. [DOI] [PMC free article] [PubMed] [Google Scholar]
- Ben-Porath I, Thomson MW, Carey VJ, Ge R, Bell GW, Regev A, and Weinberg RA (2008). An embryonic stem cell-like gene expression signature in poorly differentiated aggressive human tumors. Nat. Genet. 40, 499–507. [DOI] [PMC free article] [PubMed] [Google Scholar]
- Boles NC, Hirsch SE, Le S, Corneo B, Najm F, Minotti AP, Wang Q, Lotz S, Tesar PJ, and Fasano CA (2014). NPTX1 regulates neural lineage specification from human pluripotent stem cells. Cell Rep. 6, 724–736. [DOI] [PubMed] [Google Scholar]
- Brenet F, Moh M, Funk P, Feierstein E, Viale AJ, Socci ND, and Scandura JM (2011). DNA methylation of the first exon is tightly linked to transcriptional silencing. PLoS One 6, e14524. [DOI] [PMC free article] [PubMed] [Google Scholar]
- Byers LA, Wang J, Nilsson MB, Fujimoto J, Saintigny P, Yordy J, Giri U, Peyton M, Fan YH, Diao L, et al. (2012). Proteomic profiling identifies dysregulated pathways in small cell lung cancer and novel therapeutic targets including PARP1. Cancer Discov. 2, 798–811. [DOI] [PMC free article] [PubMed] [Google Scholar]
- Calvalcanti MS, Schultheis AM, Ho C, Wang L, DeLair DF, Weigelt B, Gardner G, Lichtman SM, Hameed M, and Park KJ (2017). Mixed mesonephric adenocarcinoma and high-grade neuroendocrine carcinoma of the uterine cervix: case description of a previously unreported entity with insights into its molecular pathogenesis. Int. J. Gyn. Path. 36, 76–89. [DOI] [PMC free article] [PubMed] [Google Scholar]
- Cheng L, Jones TD, McCarthy RP, Eble JN, Wang M, MacLennan GT, Lopez-Beltran A, Yang XJ, Koch MO, Zhang S, et al. (2005). Molecular genetic evidence for a common clonal origin of urinary bladder small-cell carcinoma and coexisting urinary carcinoma. Am. J. Pathol. 166, 1533–1539. [DOI] [PMC free article] [PubMed] [Google Scholar]
- Clevers H (2006). Wnt/p-Catenin signaling in development and disease. Cell 127, 469–480. [DOI] [PubMed] [Google Scholar]
- Clinical Lung Cancer Genome Project, and Network Genomic Medicine. (2013). A genomics-based classification of human lung tumors. Sci. Transl. Med. 5, 209ra153. [DOI] [PMC free article] [PubMed] [Google Scholar]
- Damrauer JS, Hoadley KA, Chism DD, Fan C, Tiganelli CJ, Wobker SE, Yeh JJ, Milowsky MI, Iyer G, Parker JS, et al. (2014). Intrinsic subtypes of high-grade bladder cancer reflect the hallmarks of breast cancer biology. Proc. Natl. Acad. Sci. USA 111, 3110–3115. [DOI] [PMC free article] [PubMed] [Google Scholar]
- Davies AH, Beltran H, and Zoubeidi A (2018). Cellular plasticity and the neuroendocrine phenotype in prostate cancer. Nat. Rev. Urol. 15, 271–286. [DOI] [PubMed] [Google Scholar]
- Eppert K, Takenaka K, Lechman ER, Waldron L, Nilsson B, van Galen P, Metzeler KH, Poeppl A, Ling V, Beyene J, et al. (2011). Stem cell gene expression programs influence clinical outcome in human leukemia. Nat. Med. 17, 1086–1093. [DOI] [PubMed] [Google Scholar]
- Ertel A, Dean JL, Rui H, Liu C, Witkiewicz AK, Knudsen KE, and Knudsen ES (2010). RB-pathway disruption in breast cancer: differential association with disease subtypes, disease- specific prognosis and therapeutic response. Cell Cycle 9, 4153–4163. [DOI] [PMC free article] [PubMed] [Google Scholar]
- Escudero-Esparaza A, Bartoschek M, Gialeli C, Okroj M, Owen S, Jirstrom K, Orimo A, Jiang WG, Pietras K, and Blom AM (2016). Complement inhibitor CSMD1 acts as a tumor suppressor in human breast cancer. Oncotarget 7, 76920–76933. [DOI] [PMC free article] [PubMed] [Google Scholar]
- Feinberg AP, Koldobskiy MA, and Gondor A (2016). Epigenetic modulators, modifiers and mediators in cancer aetiology and progression. Nat. Rev. Genet. 17, 284–299. [DOI] [PMC free article] [PubMed] [Google Scholar]
- Frazier SR, Kaplan PA, and Loy TS (2007). The pathology of extrapulmonary small cell carcinoma. Semin. Oncol. 34, 30–38. [DOI] [PubMed] [Google Scholar]
- George J, Lim JS, Jang SJ, Cun Y, Ozretic L, Kong G, Leenders F, Lu X, Fernandez-Cuesta L, Bosco G, et al. (2015). Comprehensive genomic profiles of small cell lung cancer. Nature 524, 47–53. [DOI] [PMC free article] [PubMed] [Google Scholar]
- Gossage L, Eisen T, and Maher ER (2015). VHL, the story of a tumour suppressor gene. Nat. Rev. Cancer 15, 55–64. [DOI] [PubMed] [Google Scholar]
- Graham NA, Minasyan A, Lomova A, Cass A, Balanis NG, Friedman M, Chan S, Zhao S, Delgado A, Go J, et al. (2017). Recurrent patterns of DNA copy number alterations in tumors reflect metabolic selection pressures. Mol. Syst. Biol. 13, 914. [DOI] [PMC free article] [PubMed] [Google Scholar]
- Hoadley KA, Yau C, Wolf DM, Cherniack AD, Tamborero D, Ng S, Leiserson MDM, Niu B, McLellan MD, Uzunangelov V, et al. (2014). Multiplatform analysis of 12 cancer types reveals molecular classification within and across tissues of origin. Cell 158, 929–944. [DOI] [PMC free article] [PubMed] [Google Scholar]
- Hoadley KA, Yau C, Hinoue T, Wolf DM, Lazar AJ, Drill E, Shen R, Taylor AM, Cherniack AD, Thorsson V, et al. (2018). Cell-of-origin patterns dominate the molecular classification of 10,000 tumors from 33 types of cancer. Cell 173, 291–304. [DOI] [PMC free article] [PubMed] [Google Scholar]
- Iorio F, Knijnenburg TA, Vis DJ, Bignell GR, Menden MP, Schubert M, Aben N, Gon?alves E, Barthorpe S, Lightfoot H, Cokelaer T, et al. (2016). A landscape of pharmacogenomic interactions in cancer. Cell 166, 740–754. [DOI] [PMC free article] [PubMed] [Google Scholar]
- Jaenisch R (1997). DNA methylation and imprinting: Why bother? Trends Genet. 13, 323–329. [DOI] [PubMed] [Google Scholar]
- Jones DL, and Wagers AJ (2008). No place like home: anatomy and function of the stem cell niche. Nat. Rev. Mol. Cell Biol. 9, 11–21. [DOI] [PubMed] [Google Scholar]
- Jung P, Sato T, Merlos-Suarez A, Barriga FM, Iglesias M, Rossell D, Auer H, Gallardo M, Blasco MA, Sancho E, et al. (2011). Isolation and in vitro expansion of human colonic stem cells. Nat. Med. 17, 1225–1227. [DOI] [PubMed] [Google Scholar]
- Jung P, Sommer C, Barriga FM, Buczacki SJ, Hernando-Momblona X, Sevillano M, Duran-Frigola M, Aloy P, Selbach M, Winton DJ, et al. (2015). Isolation of human colon stem cells using surface expression of PTK7. Stem Cell Reports 5, 979–987. [DOI] [PMC free article] [PubMed] [Google Scholar]
- Koga M, Matsuda M, Kawamura T, Sogo T, Shigeno A, Nishida E, and Ebisuya M (2014). Foxd1 is a mediator and indicator of the cell programming process. Nat. Commun. 5, 3197. [DOI] [PubMed] [Google Scholar]
- Kim J, Woo AJ, Chu J, Snow JW, Fujiwara Y, Kim CG, Cantor AB, and Orkin SH (2010). A Myc network accounts for similarities between embryonic stem and cancer cell transcription programs. Cell 143, 313–324. [DOI] [PMC free article] [PubMed] [Google Scholar]
- Kreso A, van Galen P, Pedley NM, Lima-Fernandes E, Frelin C, Davis T, Cao L, Baiazitov R, Du W, Sydorenko N, et al. (2014). Self-renewal as a therapeutic target in human colorectal cancer. Nat. Med. 20, 29–36. [DOI] [PubMed] [Google Scholar]
- Ku SY, Rosario S, Wang Y, Mu P, Seshadri M, Goodrich ZW, Goodrich MM, Labbe DP, Gomez EC, Wang J, et al. (2017). Rb1 and Trp53 cooperate to suppress prostate cancer lineage plasticity, metastasis, and antiandrogen resistance. Science 355, 78–83. [DOI] [PMC free article] [PubMed] [Google Scholar]
- Lachmann A, Giorgi FM, Lopez G, and Califano A (2016). ARACNe-AP: gene network reverse engineering through adaptive partitioning inference of mutual information. Bioinformatics 32, 2233–2235. [DOI] [PMC free article] [PubMed] [Google Scholar]
- Latil M, Nassar D, Beck B, Boumahdi S, Wang L, Brisbarre A, Dubois C, Nkusi E, Lenglez S, Checinska A, et al. (2017). Cell-type-specific chromatin states differentially prime squamous cell carcinoma tumor-initiating cells for epithelial to mesenchymal transition. Cell Stem Cell 20, 191–204. [DOI] [PMC free article] [PubMed] [Google Scholar]
- Lee JK, Phillips JW, Smith BA, Park JW, Stoyanova T, McCaffrey EF, Baertsch R, Sokolov A, Meyerowitz JG, Mathis C, et al. (2016). N-Myc drives neuroendocrine prostate cancer initiated from human prostate epithelial cells. Cancer Cell 29, 536–547. [DOI] [PMC free article] [PubMed] [Google Scholar]
- Lee JK, Bangayan NJ, Chai T, Smith BA, Pariva TE, Yun S, Vashisht A, Zhang Q, Park JW, Corey E, et al. (2018). Systemic surfaceome profiling identifies target antigens for immune-based therapy in subtypes of advanced prostate cancer. Proc. Natl. Acad. Sci. USA 115, E4473–E4482. [DOI] [PMC free article] [PubMed] [Google Scholar]
- Lim E, Vaillant F, Wu D, Forrest NC, Pal B, Hart AH, Asselin-Labat ML, Gyorki DE, Ward T, Partanen A, et al. (2009). Aberrant luminal progenitors as the candidate target population for basal tumor development in BRCA1 mutation carriers. Nat. Med. 15, 907–913. [DOI] [PubMed] [Google Scholar]
- Love MI, Huber W, and Anders S (2014). Moderated estimation of fold change and dispersion for RNA-seq data with DESeq2. Genome Biol. 15, 550. [DOI] [PMC free article] [PubMed] [Google Scholar]
- Merlos-Suárez A, Barriga FM, Jung P, Iglesias M, Céspesdes MV, Rossell D, Sevillano M, Hernando-Momblona X, da Silva-Diz V, Muñoz P, et al. (2011). The intestinal stem cell signature identifies colorectal cancer stem cells and predicts disease relapse. Cell Stem Cell 8, 511–524. [DOI] [PubMed] [Google Scholar]
- Mi H, Muruganujan A, Casagrande JT, and Thomas PD (2013). Large-scale gene function analysis with the PANTHER classification system. Nat. Protoc. 8, 1551–1566. [DOI] [PMC free article] [PubMed] [Google Scholar]
- Nichols J, and Smith A (2009). Naive and primed pluripotent states. Cell Stem Cell 4, 487–492. [DOI] [PubMed] [Google Scholar]
- Nieto MA (2013). Epithelial plasticity: a common theme in embryonic and cancer cells. Science 342, 1234850. [DOI] [PubMed] [Google Scholar]
- Oser MG, Niederst MJ, Sequist LV, and Engelman JA (2015). Transformation from non-small cell lung cancer to small cell lung cancer: molecular drivers and cells of origin. Lancet Oncol. 16, e165–e172. [DOI] [PMC free article] [PubMed] [Google Scholar]
- Pastor WA, Chen D, Liu W, Kim R, Sahakyan A, Lukianchikov A, Plath K, Jacobsen SE, and Clark AT (2016). Naive human pluripotent cells feature a methylation landscape devoid of blastocyst or germline memory. Cell Stem Cell 18, 323–329. [DOI] [PMC free article] [PubMed] [Google Scholar]
- Pece S, Tosoni D, Confalonieri S, Mazzarol G, Vecchi M, Ronzoni S, Bernard L, Viale G, and Pelicci PG (2010). Biological and molecular heterogeneity of breast cancers correlates with their cancer stem cell content. Cell 140, 62–73. [DOI] [PubMed] [Google Scholar]
- Pedersen BS, Eyring K, De S, Yang IV, and Schwartz DA (2014). Fast and accurate alignment of long bisulfite-seq reads. arXiv 14011129. [Google Scholar]
- Plaisier SB, Taschereau R, Wong JA, and Graber TG (2010). Rank-rank hypergeometric overlap: identification of statistically significant overlap between gene-expression signatures. Nucleic Acids Res. 38, e169. [DOI] [PMC free article] [PubMed] [Google Scholar]
- Poirier JT, Gardner EE, Connis N, Moreira AL, de Stanchina E, Hann CL, and Rudin CM (2015). DNA methylation in small cell lung cancer defines distinct disease subtypes and correlates with high expression of EZH2. Oncogene 34, 5869–5878. [DOI] [PMC free article] [PubMed] [Google Scholar]
- Robertson GA, Kim J, Al-Ahmadie H, Bellmunt J, Guo G, Cherniack AD, Hinoue T, Laird PW, Hoadley KA, Akbani R, et al. (2017). Comprehensive molecular characterization of muscle-invasive bladder cancer. Cell 171, 540–556. [DOI] [PMC free article] [PubMed] [Google Scholar]
- Robinson D, Van Allen EM, Wu YM, Schultz N, Lonigro RJ, Mosquera JM, Montgomery B, Taplin ME, Pritchard CC, Attard G, et al. (2015). Integrative clinical genomics of advanced prostate cancer. Cell 161, 1215–1228. [DOI] [PMC free article] [PubMed] [Google Scholar]
- Robinson DR, Wu YM, Lonigro RJ, Vats P, Cobain E, Everett J, Cao X, Rabban E, Kumar-Sinha C, Raymond V, et al. (2017). Integrative clinical genomics of metastatic cancer. Nature 584, 297–303. [DOI] [PMC free article] [PubMed] [Google Scholar]
- Rudin CM, Durinck S, Stawiski EW, Poirier JT, Modrusan Z, Shames DS, Bergbower EA, Guan Y, Shin J, Guillory J, et al. (2012). Comprehensive genomic analysis identifies SOX2 as a frequently amplified gene in small-cell lung cancer. Nat. Genet. 44, 1111–1116. [DOI] [PMC free article] [PubMed] [Google Scholar]
- Sabari JK, Lok BH, Laird JH, Poirier JT, and Rudin CM (2017). Unraveling the biology of SCLC: implications for therapy. Nat. Rev. Clin. Oncol. 14, 549–561. [DOI] [PMC free article] [PubMed] [Google Scholar]
- Santos A, Wernersson R, and Jensen LJ (2015). Cyclebase 3.0: a mult-organism database on cell-cycle regulation and phenotypes. Nucleic Acids Res. 43, D1140–1144. [DOI] [PMC free article] [PubMed] [Google Scholar]
- Schultz MD, He Y, Whitaker JW, Hariharan M, Mukamel EA, Leung D, Rajagopal N, Nery JR, Urich MA, Chen H, et al. (2015). Human body epigenome maps reveal noncanonical DNA methylation variation. Nature 523, 212–216. [DOI] [PMC free article] [PubMed] [Google Scholar]
- Schwaederle M, Elkin SK, Tomson BN, Carter JL, and Kurzrock R (2015). Squamousness: next-generation sequencing reveals shared molecular features across squamous tumor types. Cell Cycle 14, 2355–2361. [DOI] [PMC free article] [PubMed] [Google Scholar]
- Shivapurkar N, Toyooka S, Eby MT, Huang CX, Sathyanarayana UG, Cunningham HT, Reddy JL, Brambilla E, Takahashi T, Minna JD, et al. (2002). Differential inactivation of caspase-8 in lung cancers. Cancer Biol. Ther. 1, 65–69. [DOI] [PubMed] [Google Scholar]
- Smith BA, Sokolov A, Uzunangelov V, Baertsch R, Newton Y, Graim K, Mathis C, Cheng D, Stuart JM, and Witte ON (2015). A basal stem cell signature identifies aggressive prostate cancer phenotypes. Proc. Natl. Acad. Sci. USA 112, E6544–E6552. [DOI] [PMC free article] [PubMed] [Google Scholar]
- Subramanian A, Tamayo P, Mootha VK, Mukherjee S, Ebert BL, Gillette MA, Paulovich A, Pomeroy SL, Golub TR, Lander ES, et al. (2005). Gene set enrichment analysis: a knowledge-based approach for interpreting genome-wide expression profiles. Proc. Natl. Acad. Sci. USA 102, 15545–15550. [DOI] [PMC free article] [PubMed] [Google Scholar]
- Sutherland KD, Proost N, Brouns I, Adriaensen D, Song JY, and Berns A (2011). Cell of origin of small cell lung cancer: inactivation of Trp53 and Rb1 in distinct cell types of adult mouse lung. Cancer Cell 19, 754–764. [DOI] [PubMed] [Google Scholar]
- Takashima Y, Guo G, Loos R, Nichols J, Ficz G, Krueger F, Oxley D, Santos F, Clarke J, Mansfield W, et al. (2014). Resetting transcription factor control circuitry toward ground-state pluripotency in human. Cell 158, 1254–1269. [DOI] [PMC free article] [PubMed] [Google Scholar]
- Takebe N, Miele L, Harris PJ, Jeong W, Bando H, Kahn M, Yang SX, and Ivy SP (2015). Targeting Notch, Hedgehog, and Wnt pathways in cancer stem cells: clinical update. Nat. Rev. Clin. Oncol. 12, 445–464. [DOI] [PMC free article] [PubMed] [Google Scholar]
- Takeuchi T, Tomida S, Yatabe Y, Kosaka T, Osada H, Yanagisawa K, Mitsudomi T, and Takahashi T (2006). Expression profile-defined classification of lung adenocarcinoma shows close relationship with underlying major genetic changes and clinicopathologic behaviors. J. Clin. Oncol. 24, 1679–1688. [DOI] [PubMed] [Google Scholar]
- The Cancer Genome Atlas Research Network (2012a). Comprehensive molecular portraits of human breast tumours. Nature 490, 61–70. [DOI] [PMC free article] [PubMed] [Google Scholar]
- The Cancer Genome Atlas Research Network (2012b). Comprehensive genomic characterization of squamous cell lung cancers. Nature 489, 519–525. [DOI] [PMC free article] [PubMed] [Google Scholar]
- The Cancer Genome Atlas Research Network (2014). Comprehensive molecular profiling of lung adenocarcinoma. Nature 511, 543–550. [DOI] [PMC free article] [PubMed] [Google Scholar]
- The Cancer Genome Atlas Research Network (2015). The molecular taxonomy of primary prostate cancer. Cell 163, 1011–1025. [DOI] [PMC free article] [PubMed] [Google Scholar]
- Theunissen TW, Powell BE, Wang H, Mitalipova M, Faddah DA, Reddy J, Fan ZP, Maetzel D, Ganz K, Shi L, et al. (2014). Systematic identification of culture conditions for induction and maintenance of naive human pluripotency. Cell Stem Cell 15, 471–487. [DOI] [PMC free article] [PubMed] [Google Scholar]
- Theunissen TW, Friedli M, He Y, Planet E, O’Neil RC, Markoulaki S, Pontis J, Wang H, louranova A, Imbeault M, et al. (2016). Molecular criteria for defining the naive human pluripotent state. Cell Stem Cell 19, 502–515. [DOI] [PMC free article] [PubMed] [Google Scholar]
- Tsherniak A, Vazquez F, Montgomery PG, Weir BA, Kryukov G, Cowley GS, Gill S, Harrington WF, Pantel S, Krill-Burger JM, et al. (2017). Defining a cancer dependency map. Cell 170, 564–576. [DOI] [PMC free article] [PubMed] [Google Scholar]
- Turner N, and Grose R (2010). Fibroblast growth factor signaling: from development to cancer. Nat. Rev. Cancer 10, 116–129. [DOI] [PubMed] [Google Scholar]
- Visvader JE (2011). Cells of origin in cancer. Nature 469, 314–322. [DOI] [PubMed] [Google Scholar]
- Wallden B, Storhoff J, Nielsen T, Dowidar N, Schaper C, Ferree S, Liu S, Leung S, Geiss G, Snider J, et al. (2015). Development and verification of the PAM50-based Prosigna breast cancer gene signature assay. BMC Med. Genomics 8, 54. [DOI] [PMC free article] [PubMed] [Google Scholar]
- Wang Z, Inuzuka H, Fukushima H, Wan L, Gao D, Shaik S, Sarkar FH, and Wei W (2012). Emerging roles of the FBW7 tumour suppressor in stem cell differentiation. EMBO Rep. 13, 36–43. [DOI] [PMC free article] [PubMed] [Google Scholar]
- Williamson SR, Zhang S, Yao JL, Huang J, Lopez-Beltran A, Shen S, Osunkoya AO, MacLennan GT, Montironi R, and Cheng L (2011). ERG-TMPRSS2 rearrangement is shared by concurrent prostatic adenocarcinoma and prostatic small cell carcinoma and absent in small cell carcinoma of the urinary bladder: evidence supporting monoclonal origin. Mod. Pathol. 24, 1120–1127. [DOI] [PMC free article] [PubMed] [Google Scholar]
- Wong DJ, Liu H, Ridky TW, Cassarino D, Segal E, and Chang HY (2008). Module map of stem cell genes guides creation of epithelial cancer stem cells. Cell Stem Cell 2, 333–344. [DOI] [PMC free article] [PubMed] [Google Scholar]
- White AC, and Lowry WE (2015). Refining the role for adult stem cells as cancer cells of origin. Trends Cell Biol. 25, 11–20. [DOI] [PMC free article] [PubMed] [Google Scholar]
- Zhang X, Coleman IM, Brown LG, True LD, Kollath L, Lucas JM, Lam HM, Dumpit R, Corey E, Chery L, et al. (2015). SRRM4 expression and the loss of REST activity may promote the emergence of the neuroendocrine phenotype in castration-resistant prostate cancer. Clin. Cancer Res. 21, 4698–4708. [DOI] [PMC free article] [PubMed] [Google Scholar]
- Zhou Z, Flesken-Nikitin A, and Nikitin AY (2007). Prostate cancer associated with p53 and Rb deficiency arises from the stem/progenitor cell-enriched proximal region of prostatic ducts. Cancer Res. 67, 5683–5690. [DOI] [PubMed] [Google Scholar]
- Zhu Y, Qiu P, and Ji Y (2014). TCGA-Assembler: open-source software for retrieving and processing TCGA data. Nat. Methods 11, 599–600. [DOI] [PMC free article] [PubMed] [Google Scholar]
Associated Data
This section collects any data citations, data availability statements, or supplementary materials included in this article.
Supplementary Materials
Table S2. Copy number amplifications significantly associated with human stem cell signatures (q-value < 0.05), Related to Figure 3.
Table S3. Copy number deletions significantly associated with human stem cell signatures (q-value < 0.05), Related to Figure 3.
Table S5. Common negatively correlated and differentially methylated genes in small cell neuroendocrine prostate and lung cancers, Related to Figure 7.