Abstract
With the rapid development and proliferation of mobile devices with powerful computing power and the ability of integrating sensors into mobile devices, the potential impact of mobile health (mHealth) diagnostics on the public health is drawing researchers’ attention. We developed a Smartphone Octo-channel Spectrometer (SOS) as a mHealth diagnostic tool. The SOS has nanoscale wavelength resolution, is self-illuminated from the smartphone itself, and is ultra-low cost (less than $20). A user interface controls the optical sensing parameters and precise alignment. After calibrating and testing the SOS by quantifying protein concentrations, we clinically validated the SOS by comparing the diagnostic performance of our device with that of a clinical spectrophotometer. 180 serum samples from de-identified patients with 4 types of autoantibodies were blindly read the ELISA results. The accuracy of the SOS achieved 100 % across the clinical reportable range compared with the FDA-approved instrument. Furthermore, the self-illuminated SOS only requires about half of the light intensity of the FDA-approved instrument to achieve clinical-level sensitivity. The low-energy-consumption and low-cost SOS enables point-of-care spectrophotometric sensing in low-resource areas, and can be integrated into point-of-care diagnostic systems for rapid multiplex readout and analysis at patient bedside or at home.
Keywords: Smartphone optosensor, mobile health, multichannel spectrometer, autoantibody tests
1. Introduction
Mobile health (mHealth) is defined as “medical and public health practice supported by mobile devices, such as mobile phones, patient monitoring devices, personal digital assistants and other wireless devices” by the Global Observatory for e-health of World Health Organization (WHO) [1]. With high prevalence of mobile devices and the aid of cloud computing, data sharing and storage, mHealth technologies are developing very rapidly [2]. Mobile sensors, systems and software are integrated and applied in rural or low-resource areas [3]. Mobile technology based devices are being developed today to decentralize lab tests and to assist the public in monitoring physical activity. MHealth technology is transforming healthcare delivery and promoting health equity [4, 5]. Most mHealth diagnostic devices are testing one sample at one time. Few devices can provide high-throughput laboratory quality-level results for large daily volume of tests. Currently, two types of high-throughput mHealth diagnostic devices have been developed for reading out large samples at one time. The first type is smartphone-based colorimetric microplate readers which have been tested for different antigens of infectious diseases [6, 7,8] and for antimicrobial resistance [9]. The other type is multichannel smartphone spectrometer accessed by testing cancer biomarkers and proteins [10]. Although these high-throughput clinical-level mHealth diagnostic devices are applicable now, today, clinical samples from community or rural hospitals are still sent out to a central laboratory for testing. This leads to prolonged turnaround time (days to weeks) and delayed clinical diagnosis and/or treatment. It is because that community/rural hospitals have testing needs for small to medium daily volume of samples. The automated instruments equipped in the central laboratory are not economically justifiable in these rural hospitals due to its high cost. The high-throughput mHealth devices are over-requirement for these low volume hospitals/clinics.
Here, we developed a smartphone octo-channel spectrometer (SOS) as a mHealth diagnostic device for low-volume lab tests in rural hospitals/clinics. The major benefit of the SOS is to enable the data acquisition and analysis of assays based on spectrophotometric readout, including but not limited to many immunoassays. Most importantly, this is achieved for small numbers of samples at a low cost. These features enable rural hospitals or hospitals in low-resources settings to bring lab tests closer to patients’ bedside.
Autoimmune diseases, one of the most prevalent disease types in the United States, are one of frequently ordered tests [11]. Compared to cancers affecting up to 14 million people worldwide [12], 23.5 million Americans in the United States are afflicted with an autoimmune disease [13, 14]. 78.8% or 6.7 million of them are women [15, 16, 17]. In autoimmune disorders, an unknown trigger causes the immune system to begin producing antibodies that attack the body’s own cells or tissues, and can cross the placenta to cause problems in the fetus [18, 19, 20]. Some well-known autoimmune diseases include type I diabetes, Systemic Lupus Erythematosus (SLE), Rheumatoid Arthritis, connective tissue diseases, and inflammatory bowel diseases [21]. To evaluate patients for suspected autoimmune disorders, identification of anti-nuclear antibodies (ANA) is an important primary diagnostic tool for the assessment of systemic and organ specific autoimmune diseases as well as drug-induced autoimmune conditions [22]–[25]. ANA are unusual antibodies reacting with constituents of cell nuclei, including DNA, RNA, ribonucleic proteins, etc, and damaging cells and tissues, such as anti-double stranded DNA (anti-dsDNA) antibodies [26]–[28], Sjögren’s syndrome (SS) [29] antibodies A and B (Anti-SSA and anti-SSB) [30], and anti-Scl-70 [31, 32, 33].
Today, all auto-antibody tests for autoimmune diseases are only performed in well-equipped central laboratories [34, 35]. We validated the diagnostic performance of the SOS by comparing to a FDA-approved instrument. In the validation, enzyme-linked immunosorbent assay (ELISA) results of 4 types of autoantibodies (anti-dsDNA, anti-SSA, anti-SSB, and anti-Scl-70 autoantibodies) of a total of 180 de-identified patient samples were read in parallel using the FDA-approved instrument and the SOS. The degree of readout correlation is assessed. The diagnostic performance of the SOS demonstrates the clinical feasibility of this mHealth diagnostic technology.
2. Material and methods
2.1. Design and fabrication of the smartphone octo-channel spectrometer (SOS)
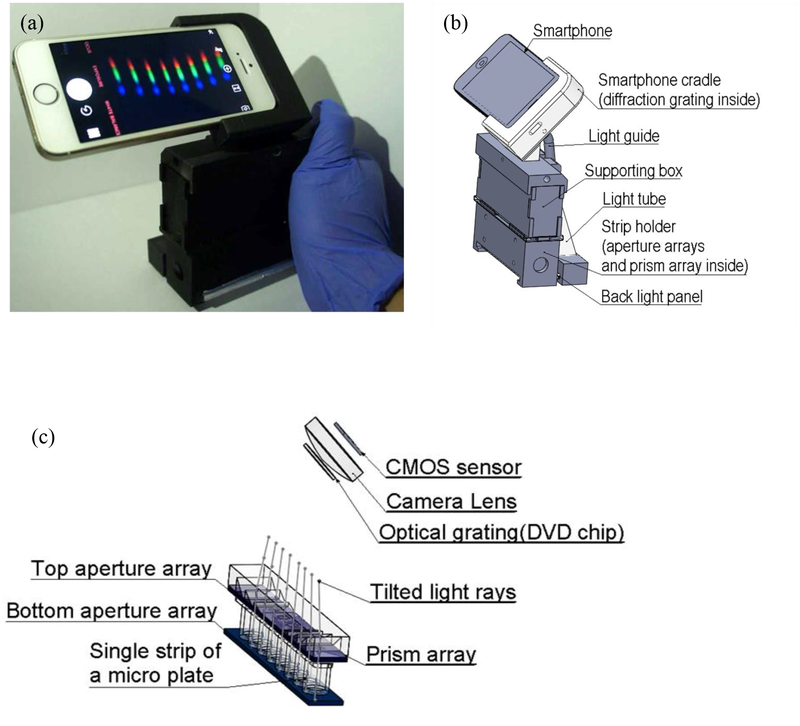
The SOS is designed for sensing 8 samples at one time reflecting in 8 channels, individually, schematically shown in Fig. 1(b). Each time, we applied a single plastic strip with 8 wells in to the SOS, and 8-channel spectra are shown simultaneously (Fig. 1(a)). Inside the SOS in Fig. 1(c), two micro-aperture arrays were applied above and below a single strip. The micro-aperture arrays were laser cut from an acrylic board (1/16 inch thick) and allowed light to only vertically travel through each well from bottom and passed the top micro-apertures. All other stray light was blocked which increased the accuracy of the SOS. After light passing the top micro-aperture array, a microprism array was used to deviate 8 individual channels of light to fit the viewing angle of the smartphone camera. The design theory and manufacturing details in the microprism array are described in the previous publication [10]. Instead of using an external light source and batteries, the back side flashlight of the smartphone was used as the illumination light source. This design of self-guided light can further reduce the cost and the size of the SOS. A universal dental LED curing light guide rod tip was used to guide the flash light. The dental LED curing light guide tip with a diameter of 8 mm is about the same size of the flashlight of a smartphone, and thus can maximize the light intensity. A home-build light tube was then used to expand the illumination light beam to the width of a single-strip. The light tube was made by gluing laser-cut Acrylic mirrors into a rectangular-based Pyramid shape. A back light panel was utilized to generate uniform illumination light to each sample.
Fig. 1.
(a) The assembled setup and (b) the 3D schematic model of the SOS. (c) The 3D model of the light path in the strip wells.
In advance, we split and diffracted light from each channel into spectrum using a piece of a digital versatile disc (DVD) with a grating period of 710 nm [36]. The DVD grating was placed right in front of the camera lens of the smartphone. The grating and the smartphone were assembled in a 3D printed cradle with a 45˚ angle in the major optical path to see the first-order diffraction. The smartphone cradle and the single-stripe holder were 3D printed by an uPrint SE Plus printer (Stratasys, Eden Prairie, MN, USA) using acrylonitrile-butadiene-styrene (ABSplus-P430, Stratasys, Eden Prairie, MN, USA) as the printing material. A supporting box connecting the smartphone cradle and the sample holder was used for a stable support and to block ambient light. This supporting box was assembled from laser cutting acrylic board (1/16 inch thick). The total cost of the SOS is less than $20. The size is 150 mm by 110 mm by 60 mm and fit an adult’s palm.
2.2. Multichannel spectrum optical setting, calibration, and image analysis
To obtain consistent optical signals directly from reflex by the analytes, a developed Application (Yamera, AppMadang) was applied to take pictures with manual control over the flashlight and all other optical parameters, such as focus, ISO number, exposure time, and white balance. After many trial-and-error tests on an iPhone SE (Apple Inc, Cupertino, California, U.S.), we found optimized optical parameters setting as follows: Focus set 1; ISO Number set 1840; Exposure Time set 1/10 second; Temp set 3605, and Tint set 0. In this work, including the clinical validation, we kept these optical parameters fixed by using the iPhone SE for proof-of-concept. The different optical parameter settings with different types of smartphone can be further tested in the future.
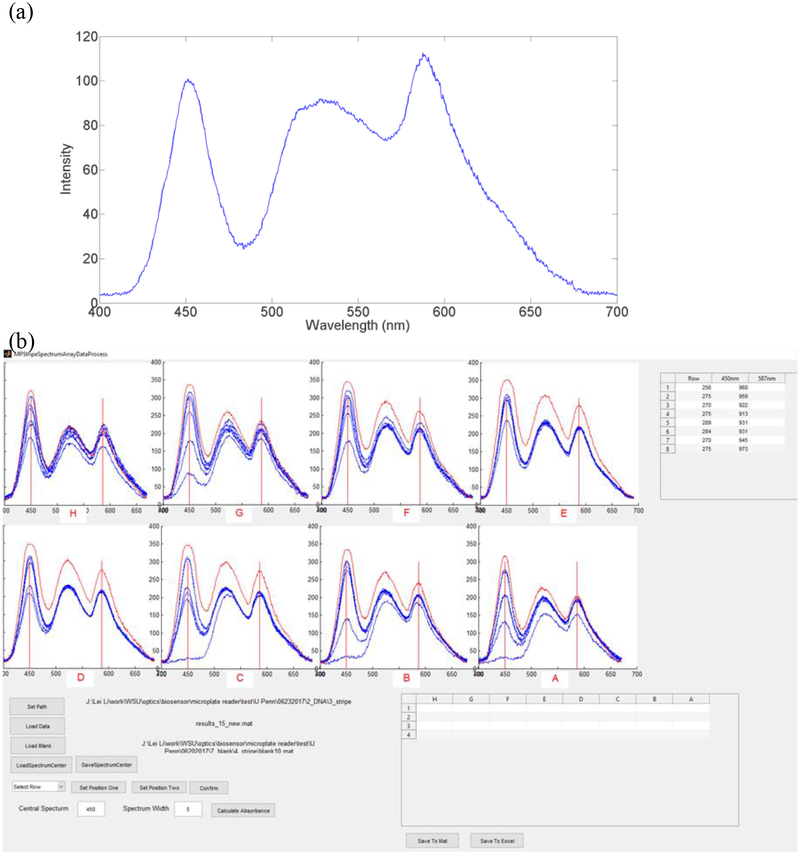
To map the relationship between the pixel and the wavelength, we first calibrated the optical spectrum of the iPhone SE flashlight by using three laser pointers with wavelengths of 405, 532, and 650 nm. The optical spectrum of the iPhone SE flashlight shown in Fig. 2(a) was used as the reference to calibrate multichannel spectra obtained in the SOS. In details, we used the calibrated iPhone SE flashlight spectrum to compare with the blank spectrum of each channel. Then we identified the wavelength-pixel relationship for each channel. The blank spectrum of each channel was used as reference to calculate absorbance for each channel. In each test, 5 images were captured and imported to self-coded MATLAB graphical user interface (GUI) program (Mathworks, Natick, MA, USA). The multichannel transmittance spectra demonstrated in Fig. 2(b) were then analysed and converted to the absorbance (A) by Equation (1).
| (1) |
where T is the light intensity of the sample and T0 is the light intensity of the blank.
Fig. 2.
(a) Calibrated optical spectrum of an iPhone SE flashlight. (b) The MATLAB GUI program for analyzing multichannel spectra.
2.3. Preparation of protein assays
We tested the prototype of the SOS by analyzing two sets of serially diluted bovine serum albumin (BSA) standards in phosphate buffered solution (0.01 M PBS, pH 7.4) with blank samples (0 mg/mL BSA in PBS). One set was high concentration protein ranging from 0.125 mg/mL to 1.5 mg/mL. The other set was low concentration protein ranging from 2.5 μg/mL to 25 μg/mL. Each condition was prepared two replicates. Bradford assays (Thermo Scientific, Waltham, MA, USA) were utilized to determine protein concentrations. In Bradford assays, Coomassie Brilliant Blue G-250 colloidal dye reacted to protein and formed a protein-dye complex. The protein-dye complex contributed to a spectral shift from brown (absorbance maximum at 465 nm wavelength) to blue (absorbance maximum at 595 nm wavelength). Assaying high concentrations of BSA, 10 μL of each standard was added into the strip wells. 300 μL of G-520 colloidal dye was then mixed with each serial diluted standard. In the low-concentration set, 150 μL of each serial diluted standard was mixed with 150 μL of G-520 dye in each strip well. After gentle tapping the single strip for 30 seconds, the assay was developed for 10 minutes in dark. Then, the single strip was read by both the SOS and the laboratory instrument (Tecan Safire2, Männedorf, Switzerland).
2.4. Clinical validation study design
We validated our SOS via the autoantibody tests at the Hospital of the University of Pennsylvania (HUP), a CLIA certified laboratory. In this study, ELISA plates for anti-dsDNA, anti-SSA, anti-SSB, and anti-Scl-70 autoantibodies were analyzed in parallel by the SOS and the FDA-approved laboratory instrument (DSX ELISA, Dynex) in the Immunology Laboratory at HUP. All tests were ordered for clinical testing and de-identified before being placed on the SOS. All patient samples and in-house controls were 1:201 diluted in sample buffers. ELISAs were performed according to the standard operating procedure in the Immunology Laboratory at HUP (details in supplementary materials). All ELISA plates incorporated calibrator/standards, positive, negative and in-house controls prepared from patient sera, and read spectrophotometrically at 450 nm by both the SOS and DSX. The calibrated standards values were utilized for the standard curve to calculate patient results. For every assay, an expert diagnostician inspected the wells and assured the quality control values, which was used as our gold standard as well. A total of 234 clinical samples, including 180 de-identified patient serum samples and 54 controls/calibrators, were tested. This study was exempted from Institutional Review Board (IRB) review at University of Pennsylvania.
3. Results and discussion
3.1. Evaluation of the SOS by quantifying protein concentrations
The multichannel absorption spectra of BSA in the high (0.125 mg/mL ~ 1.5 mg/mL) and low (2.5 μg/mL ~ 25 μg/mL) concentration range are shown in Fig. S1. The isosbestic point is the indicator in clinical chemistry to verify the accuracy in the wavelength of the spectrometer as the quality assurance method. At 525 nm wavelength, an isosbestic point in spectra was read by the SOS and the lab instrument, respectively. The ability of reading out the isobestic point indicated the high accuracy of pixel-wavelength mapping of the SOS.
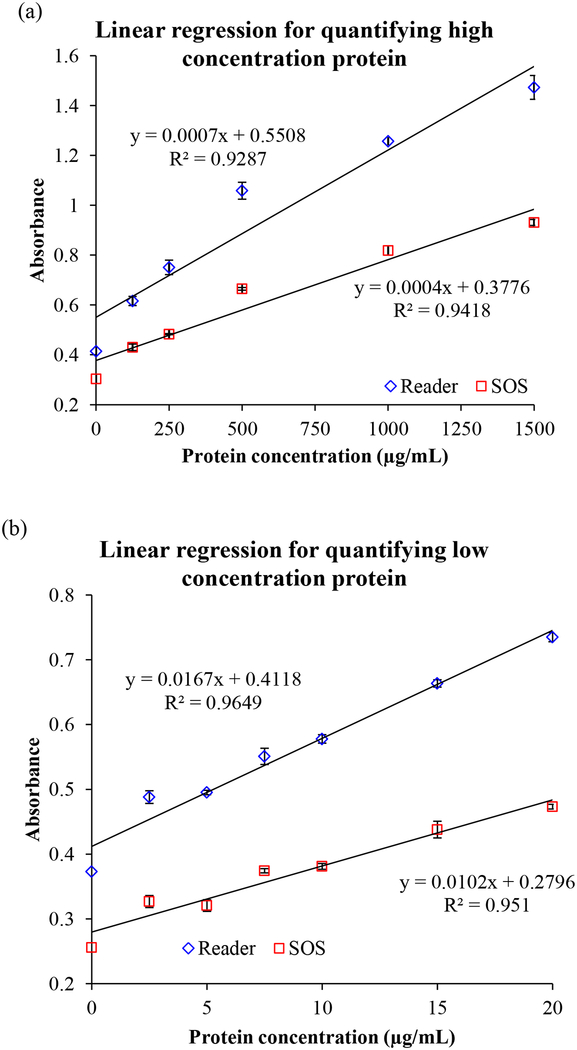
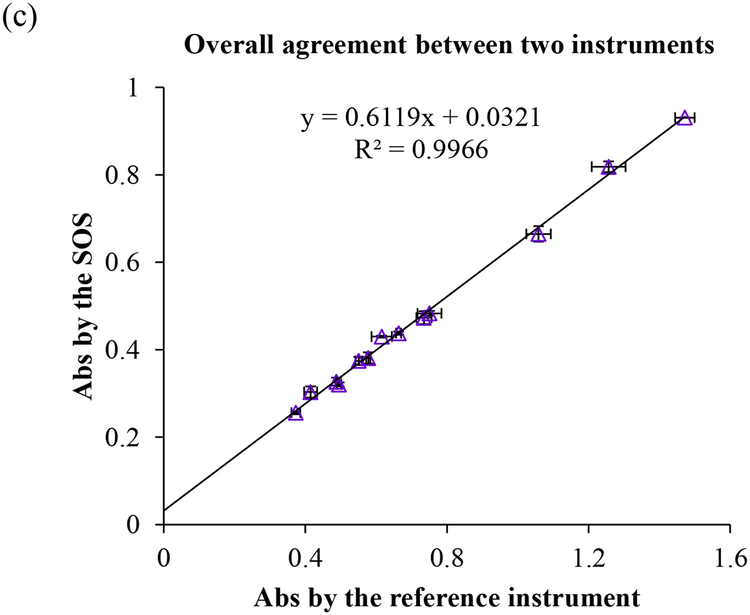
The quantifying ability and the detectable range of the SOS was evaluated by analyzing the linear regression of absorbance vs. the concentrations of BSA at 595 nm wavelength shown in Fig. 3(a) of high concentrations (0.125 mg/mL ~ 1.5 mg/mL) and 3(b) of low concentrations (2.5 μg/mL ~ 25 μg/mL). The linear correlation (R2) reached 0.9418 and 0.9510 in high and low concentration ranges, respectively. It was comparative to the results obtained by the lab instrument (R2 = 0.9287 at high concentration region and R2 = 0.9649 at low concentration region). Usually, quantifying low concentrations of protein is more challenging than determining the high concentrations of protein because of the requirement for higher sensitivity of detector. Our SOS successfully demonstrated the capability of full-range detecting quantification. The overall agreement with both instruments in Fig. 3(c) illustrated that the SOS achieved very high accuracy of up to 99.11% (R2 = 0.9911). The intensity of the self-guided illuminator in the SOS was assessed to be about half (0.57~0.61 fold) of the light intensity of the compared lab instrument in Fig. 3(a) and 3(b). It presents that lower energy consumption of self-illuminator in the SOS than the commercial instrument is sufficient to achieve comparable performance. This benefit is highly useful and necessary in low-resource and rural areas.
Fig. 3.
The linear regression of serial diluted BSA standards in (a) the high concentration ranges (0.125 mg/mL ~ 1.5 mg/mL) and (b) the low concentration ranges (2.5 μg/mL ~ 25 μg/mL) read by both the SOS and the laboratory reader. (c) The overall agreement between two instruments presented by the linear correlation.
3.2. Clinical validation of the SOS
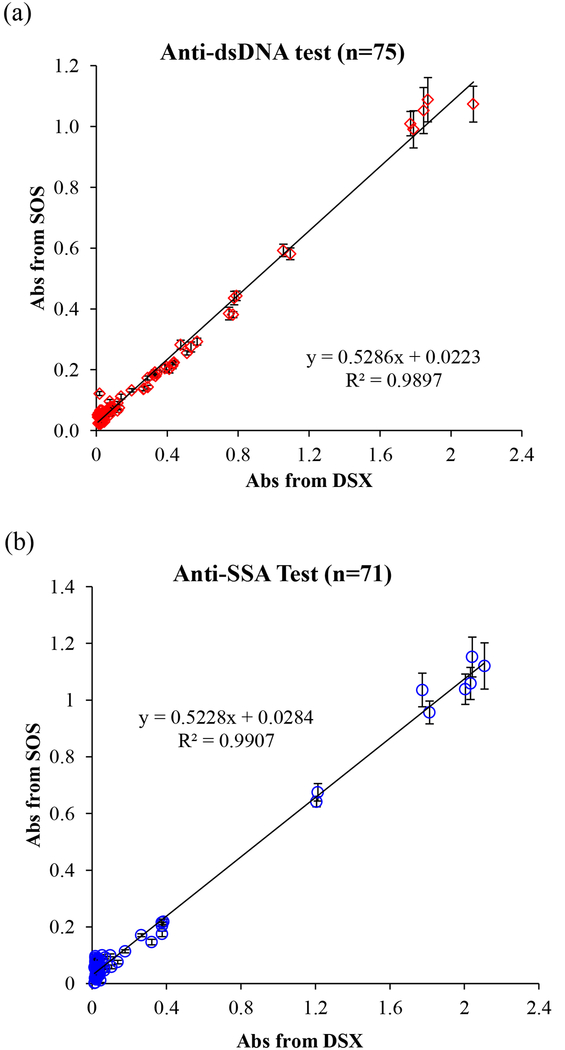
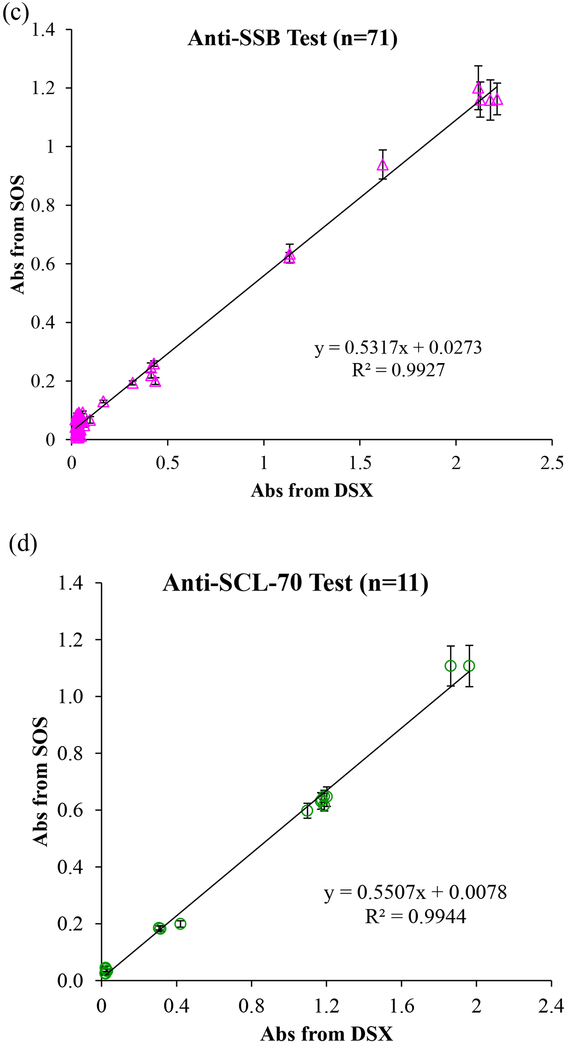
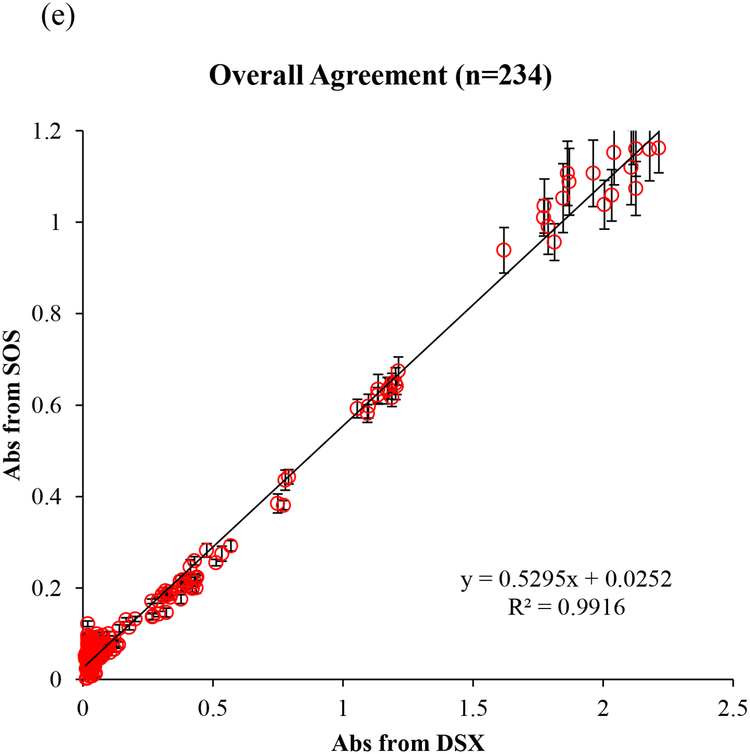
We blindly tested a total of 234 clinical samples including 180 de-identified patient samples with 4 types of autoantibody and 54 controls/calibrators in the Immunology Laboratory at HUP. In this clinical validation study, 51 patient samples and 24 standards and controls (total 75 samples) were run for anti-dsDNA tests. A total of 71 samples, including 59 patient samples and 12 calibrators and controls were run for anti-SSA and anti-SSB tests, respectively. 17 samples (11 patient samples and 6 calibrators and controls) were run for anti-Scl-70 tests. All procedures strictly followed the lab’s standard operating procedures. All tests were parallel read by both the SOS and the FDA-approved instrument (DSX). As the mHealth diagnostic device, we first examined the optical sensing capability in a wide concentration range using kit-derived negative control to positive and in-house controls made from pooled patient positive serum. The linear correlation of absorbance values obtained from the SOS and DSX is presented in Fig. 4. The readout of anti-dsDNA, anti-SSA, anti-SSB, and anti-Scl-70 tests by the SOS achieved 98.97%, 99.07%, 99.27%, and 99.44% agreement to those by DSX, respectively, in the whole concentration range. The overall agreement percentage is up to 99.16% demonstrated the very strong agreement in the optical signals obtained by the SOS and the FDA-approved instrument and is reliable and accurate across the clinically reportable range. In addition, the self-illuminated light intensity of the SOS was 0.5295 fold of the intensity of DSX. This contributed to the smaller absorbance value readout by the SOS than the readout by DSX. With the high degree of correlation (R2=0.9916), we proved that about half light intensity of the SOS with well-fixed optical parameter settings is sufficient to obtain reliable readout values. The weaker illuminator with high reliability brings the benefit of energy saving in low-resource areas.
Fig. 4.
(a) The linear correlation between absorbance obtained from the SOS and from the FDA-approved instrument (DSX) for (a) anti-dsDNA test, (b) anti-SSA test, (c) anti-SSB test, (d) anti-SCL-70 tests, and (e) overall 234 tests.
Next, we analyzed the diagnostic accuracy of the SOS, referring to the extent of agreement between the outcomes of the SOS and the FDA-approved instrument. The interpretations of testing results were provided by the Immunology Laboratory at HUP. The results of anti-dsDNA testing were reported as anti-dsDNA antibody concentration (C) (IU/mL). The trichotomous outcomes in C < 80 IU/mL, C > 80 IU/mL, and 80 < C < 99 IU/mL are interpreted as negative, positive, and equivocal, respectively. Table S1 summarized the diagnostic accuracy in a 3 × 3 table with the positive percent agreement (PPA), negative percent agreement (NPA), equivocal percent agreement (EPA), and overall percent agreement (OPA), calculated by Equation (S1)–(S4). In Table S2, for detecting ds-DNA auto-antigen, the PPA (9/9 positive samples), NPA (41/41 negative samples), EPA (1/1 equivocal sample), and OPA between the SOS and DSX all achieved 100%.
On the other hand, the interpretation of the results of anti-SSA, anti-SSB, and anti-Scl-70 tests is based on the cut-off values in the ration results (R) calculated by equation (S1). R<1.0 and R≥1.0 are interpreted as negative and positive, respectively. To analyse dichotomous outcomes, Table S3 summarized the diagnostic accuracy in a 2×2 table with individual PPA, NPA, and OPA of each test type. The SOS performed 100% of PPA (Anti-SSA: 2/2 positive; Anti-SSB: 1/1 positive), 100% NPA of (Anti-SSA: 57/57 negative; Anti-SSB: 58/58 negative), and 100% of OPA in reading anti-SSA and anti-SSB, respectively. For detecting anti-Scl-70 autoantibodies, the SOS accomplished 100% of PPA (6/6 positive samples), 100% of NPA (5/5 negative samples), and 100% of OPA as well. Based on assessment of all four types of autoantibody tests with 180 patient samples, all of the PPA, NPA, EPA, and OPA achieving 100% proved the strong result comparability and high diagnostic accuracy regardless of the measurement procedure (test kit).
4. Conclusions
A smartphone octo-channel optosensor (SOS) was designed for low-cost low-volume lab tests. In a clinical validation study, we compared the diagnostic performance of the SOS to a gold-standard clinical laboratory spectrophotometer. ELISA results of 4 types of autoantibodies of 180 de-identified patient samples were blindly read. The high overall agreement (R2 = 0.9916) in optical signal between the SOS and the FDA-approved instrument showed that SOS achieved consistent accuracy across the clinically reportable range (from the using kit-derived negative control to positive and in-house controls made from pooled patient positive serum). The high diagnostic performance with 100% accuracy demonstrates the capability, usability and reliability of the SOS in clinical use. Such high performance was complemented by the low-energy-consumption illuminator (only requiring 0.5 fold of light intensity required by the FDA-approved instrument) facilitated by the microprism array to efficiently navigate light to each channel with minimum energy lost, and the micro-aperture arrays to avoid spectral crosstalk between channels. The low-cost SOS (< $20, excluding the smartphone) has been clinically validated as a highly reliable and accurate mHealth diagnostic tool. It fits the low-volume needs in immunoassay or other spectrometry-based assays in rural hospitals/clinics. Translating gold-standard but high cost tests from the central laboratory to rural hospitals using the SOS benefits both patients and clinical laboratories. The SOS is also expandable to integrate with point-of-care diagnostic systems for rapid multiplex readout and analysis with high accuracy and low cost.
Supplementary Material
Acknowledgments
The authors acknowledge the Gap Fund of the Washington State University for supporting. The authors acknowledge and thank Sara Abraham and Moon Kim for providing the laboratory testing results.
References
- [1].“mHealth New horizons for health through mobile technologies.” World Health Organization. [Google Scholar]
- [2].Kratzke C and Cox C, “Smartphone technology and apps: Rapidly changing health promotion,” Int Electron J Health Educ, vol. 15, pp. 72–82, 2012. [Google Scholar]
- [3].Martínez-Pérez B, de la Torre-Díez I, and López-Coronado M, “Mobile Health Applications for the Most Prevalent Conditions by the World Health Organization: Review and Analysis,” J. Med. Internet Res, vol. 15, no. 6, p. e120, Jun. 2013. [DOI] [PMC free article] [PubMed] [Google Scholar]
- [4].Free C et al. , “The Effectiveness of Mobile-Health Technologies to Improve Health Care Service Delivery Processes: A Systematic Review and Meta-Analysis,” PLoS Med, vol. 10, no. 1, p. e1001363, Jan. 2013. [DOI] [PMC free article] [PubMed] [Google Scholar]
- [5].Adibi S, Mobile health: a technology road map, 1st edition New York: Springer, 2014. [Google Scholar]
- [6].Berg B et al. , “Cellphone-Based Hand-Held Microplate Reader for Point-of-Care Testing of Enzyme-Linked Immunosorbent Assays,” ACS Nano, vol. 9, no. 8, pp. 7857–7866, Aug. 2015. [DOI] [PubMed] [Google Scholar]
- [7].Wang L-J, Sun R, Vasile T, Chang Y-C, and Li L, “High-Throughput Optical Sensing Immunoassays on Smartphone,” Anal. Chem, vol. 88, no. 16, pp. 8302–8308, Aug. 2016. [DOI] [PubMed] [Google Scholar]
- [8].Kong J, et al. , “Highly stable and sensitive nucleic acid amplification and cell-phone based readout,” ACS Nano DOI: 10.1021/acsnano.6b08274 (2017). [DOI] [PubMed] [Google Scholar]
- [9].Feng S, Tseng D, Di Carlo D, Garner OB, and Ozcan A, “High-throughput and automated diagnosis of antimicrobial resistance using a cost-effective cellphone-based micro-plate reader,” Sci. Rep, vol. 6, no. 1, Dec. 2016. [DOI] [PMC free article] [PubMed] [Google Scholar]
- [10].Wang L-J, Chang Y-C, Sun R, and Li L, “A multichannel smartphone optical biosensor for high-throughput point-of-care diagnostics,” Biosens. Bioelectron, vol. 87, pp. 686–692, Jan. 2017. [DOI] [PubMed] [Google Scholar]
- [11].Fairweather D and Rose NR, “Women and Autoimmune Diseases1,” Emerg. Infect. Dis, vol. 10, no. 11, pp. 2005–2011, Nov. 2004. [DOI] [PMC free article] [PubMed] [Google Scholar]
- [12].Ferlay J et al. , “Cancer incidence and mortality worldwide: Sources, methods and major patterns in GLOBOCAN 2012: Globocan 2012,” Int. J. Cancer, vol. 136, no. 5, pp. E359–E386, Mar. 2015. [DOI] [PubMed] [Google Scholar]
- [13].Autoimmune Diseases Coordinating Committee, “Autoimmune Diseases Coordinating Committee N.I.H. Progress in Autoimmune Diseases Research.” NIH Publication 05–5140, 2005. [Google Scholar]
- [14].Borgelt LM and American Society of Health-System Pharmacists, Eds., Women’s health across the lifespan: a pharmacotherapeutic approach. Bethesda, Md: American Society of Health-System Pharmacists, 2010. [Google Scholar]
- [15].Fairweather D, Frisancho-Kiss S, and Rose NR, “Sex Differences in Autoimmune Disease from a Pathological Perspective,” Am. J. Pathol, vol. 173, no. 3, pp. 600–609, Sep. 2008. [DOI] [PMC free article] [PubMed] [Google Scholar]
- [16].Jacobson DL, Gange SJ, Rose NR, and Graham NM, “Epidemiology and estimated population burden of selected autoimmune diseases in the United States,” Clin. Immunol. Immunopathol, vol. 84, no. 3, pp. 223–243, Sep. 1997. [DOI] [PubMed] [Google Scholar]
- [17].Khashan AS et al. , “Pregnancy and the Risk of Autoimmune Disease,” PLoS ONE, vol. 6, no. 5, p. e19658, May 2011. [DOI] [PMC free article] [PubMed] [Google Scholar]
- [18].Firestein GS and Kelley WN, Eds., Kelley’s textbook of rheumatology, 9th ed. Philadelphia, PA: Elsevier/Saunders, 2013. [Google Scholar]
- [19].National Institute of Environmental Health Sciences, “NIEHS Autoimmune Diseases fact sheet.” National Institute of Environmental Health Sciences. [Google Scholar]
- [20].Adams Waldorf KM and Nelson JL, “Autoimmune Disease During Pregnancy and the Microchimerism Legacy of Pregnancy,” Immunol. Invest, vol. 37, no. 5–6, pp. 631–644, Jan. 2008. [DOI] [PMC free article] [PubMed] [Google Scholar]
- [21].National Institute of Arthritis and Musculoskeletal and Skin Diseases, National Institute of Health, “UNDERSTANDING AUTOIMMUNE DISEASES.” NIH Publication 16–7582, 2016. [Google Scholar]
- [22].Tan EM, “Antinuclear antibodies: diagnostic markers for autoimmune diseases and probes for cell biology,” Adv. Immunol, vol. 44, pp. 93–151, 1989. [DOI] [PubMed] [Google Scholar]
- [23].Tan EM et al. , “Range of antinuclear antibodies in ‘healthy’ individuals,” Arthritis Rheum, vol. 40, no. 9, pp. 1601–1611, Sep. 1997. [DOI] [PubMed] [Google Scholar]
- [24].Reichlin M, “ANA negative systemic lupus erythematosus sera revisited serologically,” Lupus, vol. 9, no. 2, pp. 116–119, Feb. 2000. [DOI] [PubMed] [Google Scholar]
- [25].Kavanaugh A, Tomar R, Reveille J, Solomon DH, and Homburger HA, “Guidelines for clinical use of the antinuclear antibody test and tests for specific autoantibodies to nuclear antigens. American College of Pathologists,” Arch. Pathol. Lab. Med, vol. 124, no. 1, pp. 71–81, Jan. 2000. [DOI] [PubMed] [Google Scholar]
- [26].Swaak AJG, Aarden LA, Statius Eps LWV, and Feltkamp TEW, “Anti-dsdna and complement profiles as prognostic guides in systemic lupus erythematosus,” Arthritis Rheum, vol. 22, no. 3, pp. 226–235, Mar. 1979. [DOI] [PubMed] [Google Scholar]
- [27].Manson JJ et al. , “Relationship between anti-dsDNA, anti-nucleosome and anti-alpha-actinin antibodies and markers of renal disease in patients with lupus nephritis: a prospective longitudinal study,” Arthritis Res. Ther, vol. 11, no. 5, p. R154, 2009. [DOI] [PMC free article] [PubMed] [Google Scholar]
- [28].Sui M et al. , “Simultaneous Positivity for Anti-DNA, Anti-Nucleosome and Anti-Histone Antibodies is a Marker for More Severe Lupus Nephritis,” J. Clin. Immunol, vol. 33, no. 2, pp. 378–387, Feb. 2013. [DOI] [PubMed] [Google Scholar]
- [29].Fox PC, “Autoimmune diseases and Sjogren’s syndrome: an autoimmune exocrinopathy,” Ann. N. Y. Acad. Sci, vol. 1098, pp. 15–21, Mar. 2007. [DOI] [PubMed] [Google Scholar]
- [30].Sánchez-Guerrero J, Lew RA, Fossel AH, and Schur PH, “Utility of anti-Sm, anti-RNP, anti-Ro/SS-A, and anti-La/SS-B (extractable nuclear antigens) detected by enzyme-linked immunosorbent assay for the diagnosis of systemic lupus erythematosus,” Arthritis Rheum, vol. 39, no. 6, pp. 1055–1061, Jun. 1996. [DOI] [PubMed] [Google Scholar]
- [31].Gaudreau A, Amor B, Kahn MF, Ryckewaert A, Sany J, and Peltier AP, “Clinical significance of antibodies to soluble extractable nuclear antigens (anti-ENA).,” Ann. Rheum. Dis, vol. 37, no. 4, pp. 321–327, Aug. 1978. [DOI] [PMC free article] [PubMed] [Google Scholar]
- [32].Catoggio LJ, Bernstein RM, Black CM, Hughes GR, and Maddison PJ, “Serological markers in progressive systemic sclerosis: clinical correlations,” Ann. Rheum. Dis, vol. 42, no. 1, pp. 23–27, Feb. 1983. [DOI] [PMC free article] [PubMed] [Google Scholar]
- [33].McNeilage LJ, Whittingham S, McHugh N, and Barnett AJ, “A highly conserved 72,000 dalton centromeric antigen reactive with autoantibodies from patients with progressive systemic sclerosis.,” J. Immunol, vol. 137, no. 8, pp. 2541–2547, 1986. [PubMed] [Google Scholar]
- [34].Kuang T, Chang L, Peng X, Hu X, and Gallego-Perez D, “Molecular Beacon Nano-Sensors for Probing Living Cancer Cells,” Trends Biotechnol, vol. 35, no. 4, pp. 347–359, Apr. 2017. [DOI] [PubMed] [Google Scholar]
- [35].Chang L et al. , “Nanoscale bio-platforms for living cell interrogation: current status and future perspectives,” Nanoscale, vol. 8, no. 6, pp. 3181–3206. [DOI] [PubMed] [Google Scholar]
- [36].Wang L-J et al. , “Smartphone Optosensing Platform Using a DVD Grating to Detect Neurotoxins,” ACS Sens, vol. 1, no. 4, pp. 366–373, Apr. 2016. [Google Scholar]
Associated Data
This section collects any data citations, data availability statements, or supplementary materials included in this article.


