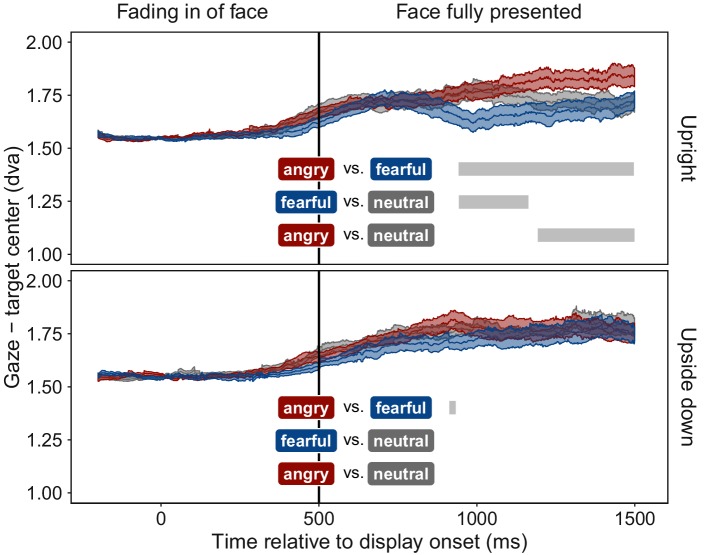
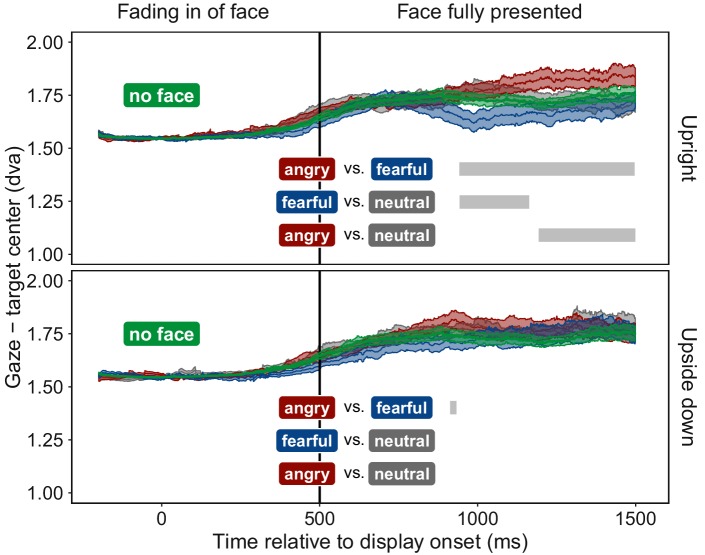
Figure 3. Time course of gaze distance from target.
Mean distance of gaze position from the center of the face stimulus is plotted for all time points (±1 SEM shaded area) separately for upright (top panel) and upside down (bottom panel) presented face stimuli displaying fearful (blue), angry (red), or neutral (grey) emotions. Gaze data were included only for trials in which faces were fully suppressed from awareness (see Figure 1). After the fixation period, mean gaze distance increased in all conditions, as participants moved their eyes freely, and most areas of the display were located further away from the target than the initially-fixated center point. After ~400 ms of full stimulus display, mean gaze distance to upright fearful faces decreased, indicating an orienting towards fearful faces. In contrast, mean gaze distance to upright angry faces increased, indicating gaze aversion from an angry face. Grey bars represent significant clusters (p < 0.001) of adjacent time points (1 ms temporal resolution). At all time points within a cluster, a significant difference in distance between the two respective emotional expressions (colored textboxes) emerged (p < 0.05, corrected for multiple comparisons).


