Abstract
Objective
To investigate the correlation between characteristics of lateralized periodic discharges (LPDs) and glucose metabolism measured by 18F-fluorodeoxyglucose (FDG)–PET.
Methods
We retrospectively reviewed medical records to identify patients who underwent FDG-PET during EEG monitoring with LPDs present during the FDG uptake period. Two blinded board-certified neurophysiologists independently interpreted EEGs. FDG uptake was measured using standardized uptake value (SUV). Structural images were fused with PET images to aid with localization of SUV. Two PET readers independently measured maximum SUV. Relative SUV values were obtained by normalization of the maximum SUV to the SUV of pons (SUVRpons). LPD frequency was analyzed both as a categorical variable and as a continuous measure. Other secondary variables included duration, amplitude, presence of structural lesion, and “plus” EEG features such as rhythmic or fast sharp activity.
Results
Nine patients were identified and 7 had a structural etiology for LPDs. Analysis using frequency as a categorical variable and continuous variable showed an association between increased LPD frequency and increased ipsilateral SUVRpons (p = 0.02). Metabolism associated with LPDs (0.5 Hz as a baseline) increased by a median of 100% at 1 Hz and for frequencies >1 Hz increased by a median of 309%. There were no statistically significant differences in SUVRpons for other factors including duration (p = 0.10), amplitude (p = 0.80), structural etiology (p = 0.55), or “plus” features such as rhythmic or fast sharp activity (p = 0.84).
Conclusions
Metabolic activity increases monotonically with LPD frequency. LPD frequency should be a measure of interest when developing neuroprotection strategies in critical neurologic illness.
Rising use of continuous EEG monitoring in intensive care has led to increased detection of EEG patterns of unclear significance. One such pattern is lateralized periodic discharges (LPDs), formerly periodic lateralized epileptiform discharges.1 LPDs are usually seen in acute neurologic injury and are occasionally associated with subtle motor signs,2 alteration in mental status,3 and epilepsia partialis continua,4 though they often have no clinically apparent accompaniments. There continues to be debate surrounding whether these patterns represent ictal or interictal phenomena, or whether they should simply be considered part of an ictal–interictal continuum.5
Studies measuring perfusion and metabolic biochemical markers have shown that LPDs can be associated with increased glucose metabolism and metabolic failure—similar to seizures—and in other cases show no increased metabolism.6,7 In this study, we investigate whether electrographic features of LPDs can be used to predict metabolic activity, as measured by 18F-fluorodeoxyglucose (FDG)–PET.
Method
Standard protocol approvals, registrations, and patient consents
Massachusetts General Hospital institutional review board approved of this study and a waiver of informed consent was granted.
Patients
We queried a hospital EEG database to identify inpatients from 2002–2014 with brain FDG-PET while on continuous EEG. Patients undergoing elective epilepsy admission were excluded.
FDG-PET acquisition
PET was performed with a standard clinical protocol. Images were obtained 45–60 minutes after injection of approximately 5.0 mCi of FDG. Scanning was performed on an ECAT HR+ (Siemens/CTI, Knoxville, TN). A 15.5 cm field of view with 63 planes acquired in 3D mode was used. A 68Ge transmission scan was used for attenuation correction. Maximum likelihood algorithm was used for image reconstruction giving 4.6 mm resolution at full width half maximum.
EEG review
Two board-certified neurophysiologists evaluated EEG during FDG uptake using American Clinical Neurophysiology Society critical care EEG terminology.1 Readers were blinded to clinical and PET data. EEG was rated for seizures, periodic discharges, and background. Modifiers included frequency, amplitude, and superimposed rhythmic or fast activity. Discrepancies were resolved by consensus.
PET evaluation
PET images were visualized using the clinical standard of standardized uptake value (SUV) evaluated using a 10-color scheme adjusted manually to achieve maximal contrast. The highest SUV (SUVmax) was obtained by finding the axial slice with highest cortical SUV measured using a circular region of interest (ROI) diameter of 4 cm. Contralateral SUVmax was measured on the same axial slice by manually placing the circular ROI on the homologous contralateral brain region. SUVmax of the pons was taken at the axial slice at the level of the middle cerebellar peduncle. Structural image MRI (8 cases) and CT (1 case) obtained in the same admission were fused to PET images using visual alignment and linear transforms. Relative SUV (SUVR) was obtained by normalizing to the SUVmax of the pons (SUVRpons) or to the contralateral homologous region (SUVRcontra). PET images were evaluated independently by 2 readers. One reader was blinded to all clinical and EEG information (except LPD laterality). Discrepancies >0.1 SUVmax were resolved by consensus.
Statistical analysis
The primary analysis was a comparison of mean SUVRpons for binned frequency levels (<1 Hz, 1 Hz, >1 Hz) using permutation equivalent to Kruskal-Wallis test (PERM8 R 2016). Secondary analysis included assessment of linear correlation of LPD frequency as a continuous variable and analysis of other categorical variables.
Data availability
Anonymized data will be shared by request from any qualified investigator.
Results
Patients
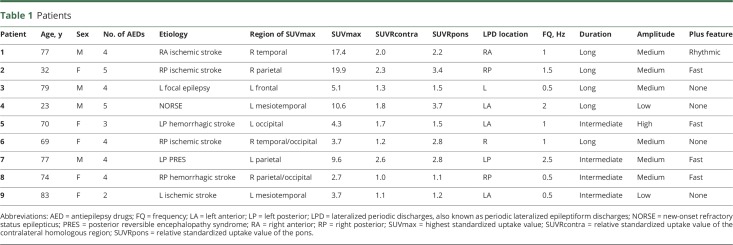
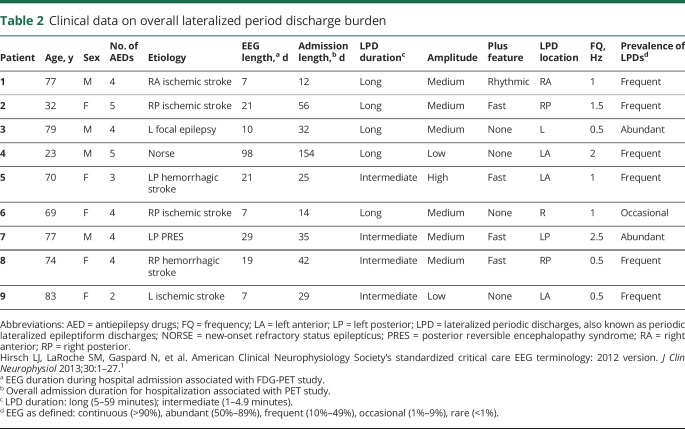
Nine patients with concurrent LPDs on continuous EEG and PET were found (tables 1 and 2). Most patients (7) had a structural etiology for LPDs; remote stroke (6) and posterior reversible encephalopathy syndrome (1). Nonstructural etiologies included focal epilepsy with unknown etiology (1) and new-onset refractory status epilepticus without an apparent etiology (1). The regions of SUVmax correlated with laterality and brain quadrant of the structural and electrographic findings in all cases.
Table 1.
Patients
Table 2.
Clinical data on overall lateralized period discharge burden
PET
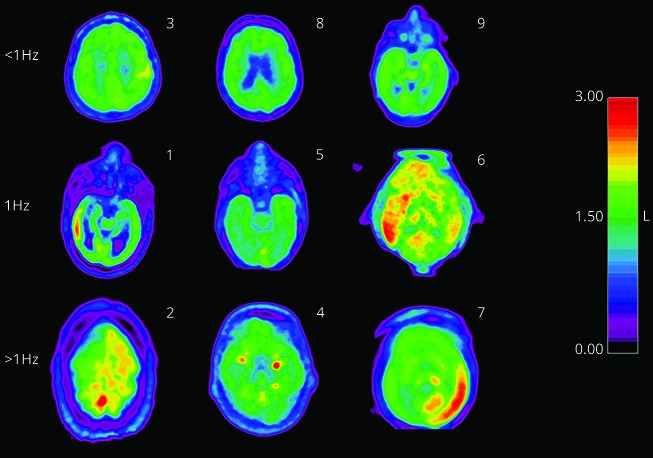
Twenty-seven SUVmax measurements were taken independently by 2 PET readers. Twenty-five out of 27 were within 0.1. The 2 discrepancies were 0.2 and 0.3; resolved by consensus. SUVR were calculated to address factors that could affect global SUV measurements (blood glucose, differing uptake periods). Two reference regions were used: pons and contralateral homologous region. SUVRpons (figure 1) and SUVRcontra were generated for each patient. No structural pathology was evident in MRI or CT review of reference regions. To ensure the results were robust to normalization method, analysis was performed with SUVRpons and SUVRcontra. SUVRpons was chosen for primary analysis as it is less likely to be to be affected by supratentorial pathology.
Figure 1. Axial PET slice at the region of maximal relative standardized uptake value of the pons (SUVRpons) for each of the 9 patients.
There is a 10-color scheme covering the range of 0–3 for the SUVRpons (shown on the scale to the right of the figure). The numbers in the right-hand corner correspond to subject number. The row headings reference the frequency of the lateralized periodic discharges corresponding to the EEG obtained during the FDG uptake period.
Analysis of predictive variables
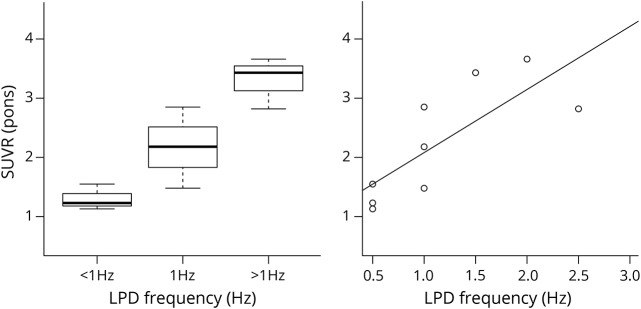
The primary endpoint was a comparison of SUVRpons between binned frequency groups <1 Hz, 1 Hz, >1 Hz with an exact permutation test (figure 2A); p value 0.02. Using frequency group <1 Hz as a baseline, metabolic activity increased by 100% at group 1 Hz and 309% at group >1 Hz. The test was also performed using SUVRcontra to ensure the result was not related to the normalization factor; p value 0.03. SUVRpons and SUVRcontra were also assessed with linear regression against frequency of LPDs (0.5, 1, 1.5, 2, 2.5 Hz) considered as a continuous variable. Both linear models were significant with p value of 0.01 and <0.01, respectively, demonstrating significant results independent of reference region. Correlation coefficient for SUVRpons was 1.1, suggesting that SUVRpons increases by 1.1 for every increase in frequency by 1 Hz. The effect size (R2) was 0.61 for SUVRpons (figure 2B) and 0.73 for SUVRcontra. Other EEG factors were assessed including amplitude (p = 0.80), sex (p = 0.49), presence of plus features including rhythmic or fast activity (p = 0.84), duration (p = 0.10), and presence of structural etiology (p = 0.55). Difference in number of antiepileptic drugs between frequency groups (<1 Hz, 1 Hz, >1 Hz) was not statistically significant (p = 0.27).
Figure 2. Boxplot and scatterplot.
(A) Boxplot of the binned frequencies with 3 patients in each category (<1 Hz, 1 Hz, >1 Hz).The overall p value for the permutation testing comparing multiple categories is significant at 0.02; tests between categories were not: p = 0.20 (<1 Hz|1 Hz), p = 0.22 (1 Hz|>1 Hz), and p = 0.10 (<1 Hz|1 Hz). Median (range) relative standardized uptake values (SUVR) (Pons) are <1 Hz: 1.1 (1.2–1.5), 1 Hz: 2.2 (1.5–2.8), >1 Hz: 3.4 (2.8–3.7). (B) Scatterplot with a regression line fitted with least square regression. F-statistic p value is significant at 0.013 with an R2 value of 0.61, coefficient 1.1. LPD = lateralized periodic discharges.
Discussion
In this study, we found that an increase in LPD frequency is associated with increased spatially colocalized metabolic activity. Previous studies using cerebral blood flow, oxygen consumption, and microdialysis have independently demonstrated temporally associated metabolic crisis occurring with LPDs that is frequency dependent.7,9 Our study confirms these prior reports and overcomes the spatial sampling bias inherent with these techniques, as FDG-PET measures whole brain metabolism, which allows measurement of spatial distribution as well as degree of metabolic activity.10 Indeed, in some cases, hypermetabolism was present in deep gray matter or in cortex not easily sampled by intracranial probes (figure 1). Other electrographic features of LPDs such as amplitude, presence of plus features, and duration were also assessed, with no significant correlation with metabolic activity. Use of antiseizure drugs and other EEG features including LPD duration was similar between groups, isolating LPD frequency as the primary mediator of hypermetabolism. Other EEG factors like total burden, duration, and prevalence of LPDs also are likely to contribute to degree of secondary damage. Correlation between LPD frequency and metabolism were significant for both reference regions, implying the findings cannot be attributed to variation in reference region uptake.
There are several limitations to this study, including its small sample size and retrospective nature, which creates a probable selection bias. Nevertheless, the large effect of LPD frequency on metabolism allowed for statistically significant results despite a modest sample size. Using 0.5 Hz as a baseline, median SUVRpons increased dramatically at 1 Hz (100%) and again over >1 Hz (309%), suggesting that frequency of LPDs is an important factor in the calculus of preventing secondary brain injury. Along with previous investigations,7,9 these results demonstrate that hypermetabolism related to LPDs exists on a continuum mediated at least in part by LPD frequency, warranting consideration of treatment of LPDs below the traditional seizure threshold of 3 Hz. In addition, we demonstrate that the region of maximum increase in metabolism is not confined to the superficial cortex, which makes whole brain imaging a relevant consideration in neurocritical care monitoring.
Acknowledgment
Mohammad Tabaeizadeh Fesharaki, MD, from Massachusetts General Hospital/Harvard Medical School, assisted in collection of study data.
Glossary
- FDG
18F-fluorodeoxyglucose
- LPD
lateralized periodic discharge
- ROI
region of interest
- SUV
standardized uptake value
- SUVmax
highest standardized uptake value
- SUVR
relative standardized uptake value
- SUVRcontra
relative standardized uptake value of the contralateral homologous region
- SUVRpons
relative standardized uptake value of the pons
Author contributions
T. Subramaniam is responsible for analysis and interpretation and critical revision of the manuscript for important intellectual content. A. Jain is responsible for acquisition of data and analysis and interpretation. L.T. Hall is responsible for analysis and interpretation and critical revision of the manuscript for important intellectual content. A.J. Cole is responsible for study concept and design and critical revision of the manuscript for important intellectual content. M.B. Westover is responsible for study concept and design, acquisition of data, analysis and interpretation, and critical revision of the manuscript for important intellectual content. E. Rosenthal is responsible for study concept and design, acquisition of data, analysis and interpretation, and critical revision of the manuscript for important intellectual content. A.F. Struck is responsible for study concept and design, acquisition of data, analysis and interpretation, critical revision of the manuscript for important intellectual content, and study supervision.
Study funding
No targeted funding reported.
Disclosure
T. Subramaniam, A. Jain, and L. Hall report no disclosures relevant to the manuscript. A. Cole is a consultant to Pfizer, Sage Therapeutics, and Biogen. M. Brandon Westover receives funding from NIH-NINDS (NIH-NINDS 1K23NS090900) and Sage Therapeutics. E. Rosenthal receives grant funding from NIH/NINDS (1K23NS105950), the Department of Defense (W81XWH-18-DMRDP-PTCRA), and through and Sage Therapeutics; received consulting revenue from Gerson Lehrman Group, Inc., Guidepoint Global, Inc., and Coleman Research Group regarding subarachnoid hemorrhage and epilepsy; and received compensation for expert witness consultation. A. Struck reports no disclosures relevant to the manuscript. Go to Neurology.org/N for full disclosures.
References
- 1.Hirsch LJ, LaRoche SM, Gaspard N, et al. American Clinical Neurophysiology Society's standardized critical care EEG terminology: 2012 version. J Clin Neurophysiol 2013;30:1–27. [DOI] [PubMed] [Google Scholar]
- 2.Hughes JR. Periodic lateralized epileptiform discharges: do they represent an ictal pattern requiring treatment? Epilepsy Behav 2010;18:162–165. [DOI] [PubMed] [Google Scholar]
- 3.Terzano MG, Parrino L, Mazzucchi A, Moretti G. Confusional states with periodic lateralized epileptiform discharges (PLEDs): a peculiar epileptic syndrome in the elderly. Epilepsia 1986;27:446–457. [DOI] [PubMed] [Google Scholar]
- 4.Handforth A, Cheng JT, Mandelkern MA, et al. Markedly increased mesiotemporal lobe metabolism in a case with PLEDs: further evidence that PLEDs are a manifestation of partial status epilepticus. Epilepsia 1994;35:876–881. [DOI] [PubMed] [Google Scholar]
- 5.Chong DJ, Hirsch LJ. Which EEG patterns warrant treatment in the critically ill? Reviewing the evidence for treatment of periodic epileptiform discharges and related patterns. J Clin Neurophysiol 2005;22:79–91. [DOI] [PubMed] [Google Scholar]
- 6.Struck AF, Westover MB, Hall LT, Cole AJ, Rosenthal ES. Metabolic correlates of the ictal-interictal continuum: FDG-PET during continuous EEG. Neurocrit Care 2016;24:324–331. [DOI] [PMC free article] [PubMed] [Google Scholar]
- 7.Witsch J, Frey HP, Schmidt JM, et al. Electroencephalographic periodic discharges and frequency-dependent brain tissue hypoxia in acute brain injury. JAMA Neurol 2017;74:301–309. [DOI] [PMC free article] [PubMed] [Google Scholar]
- 8.Fay MP, Shaw PA. Exact and asymptotic weighted logrank tests for interval censored data: the interval R package. J Stat Softw 2010;36:1–34. [DOI] [PMC free article] [PubMed] [Google Scholar]
- 9.Vespa P, Tubi M, Claassen J, et al. Metabolic crisis occurs with seizures and periodic discharges after brain trauma. Ann Neurol 2016;79:579–590. [DOI] [PubMed] [Google Scholar]
- 10.Sarikaya I. PET studies in epilepsy. Am J Nucl Med Mol Imaging 2015;5:416–430. [PMC free article] [PubMed] [Google Scholar]
Associated Data
This section collects any data citations, data availability statements, or supplementary materials included in this article.
Data Availability Statement
Anonymized data will be shared by request from any qualified investigator.


