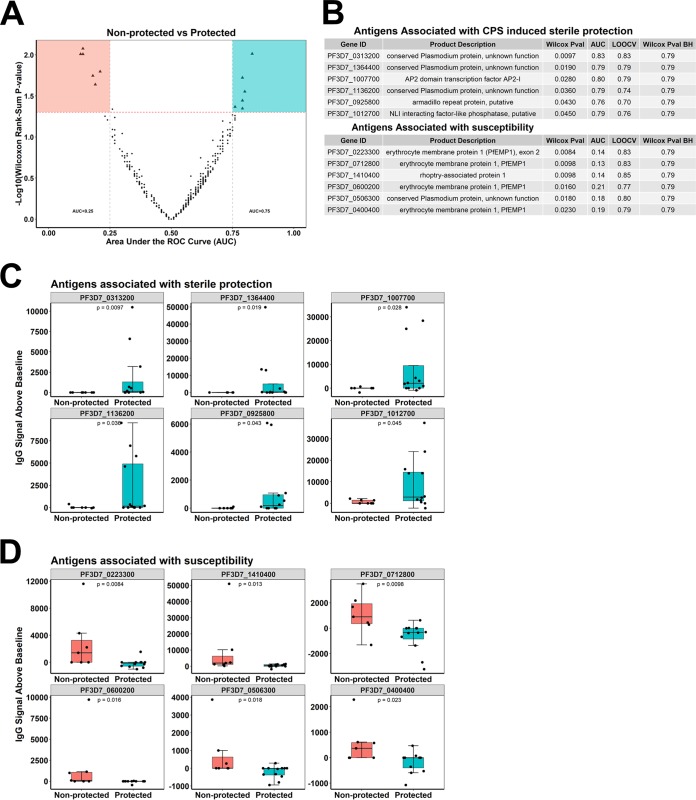
FIG 4.
Novel antigens associated with CPS immunization-induced sterile protection. (A) Differential signal intensities of 229 antigens at C-1 in plasma samples of protected (n = 7) and nonprotected (n = 12) medium responders. The red dotted line indicates the threshold P value of <0.05; dots in the green area and dots in the orange area represent antigens significantly more reactive in protected and nonprotected subjects, respectively. (B) Gene identifications of the antigens associated with protection and susceptibility in medium responders. Wilcoxon rank sum test P values (Wilcox Pval), Wilcoxon rank sum test P values with Benjamini-Hochberg correction for multiple comparisons (Wilcox Pval BH), area under the receiver operating characteristic curve (AUC) values, and leave-one-out cross-validation (LOOCV) AUC values for protected and nonprotected volunteers are shown. (C and D) Specific antigens associated with protection (C) or susceptibility (D). Boxes represent individual antigens in nonprotected (orange) (n = 7) and protected (green) (n = 12) subjects. Dots show individual data points, center lines show the medians, box limits indicate the 25th and 75th percentiles, and whiskers extend 1.5 times the IQR. Comparisons were tested by a Wilcoxon rank sum test.

