

Abstract
Adult zebrafish are being increasingly used as a model in cancer and stem cell research. Here we describe an integrated optical system that combines a laser scanning confocal microscope (LSCM) and an in vivo flow cytometer (IVFC) for simultaneous visualization and cell quantification. The system is set up specifically for non-invasive tracking of both stationary and circulating cells in adult zebrafish (casper) that have been engineered to be optically transparent. Confocal imaging in this instrument serves the dual purpose of visualizing fish tissue microstructure and an imaging-based guide to locate a suitable vessel for quantitative analysis of circulating cells by IVFC. We demonstrate initial testing of this novel instrument by imaging the transparent adult zebrafish casper vasculature and tracking circulating cells in CD41-GFP/Gata1-DsRed transgenic fish whose thrombocytes/erythrocytes express the green and red fluorescent proteins. In vivo measurements allow cells to be tracked under physiological conditions in the same fish over time, without drawing blood samples or sacrificing animals. We also discuss the potential applications of this instrument in biomedical research.
Keywords: In vivo flow cytometry (IVFC), in vivo confocal microscopy, circulating cells, adult zebrafish
INTRODUCTION
Zebrafish have become a powerful vertebrate model organism for both genetic and chemical screens because of its high degree of genetic conservation to human, its rapid development, small size and cost-effectiveness[1]. In particular, the zebrafish embryo is often used for studies of organ development because it is transparent and easy to image. The adult zebrafish, on the other hand, is commonly used in the studies of disease processes such as tumor growth, invasion, metastases, angiogenesis, and in stem cell and transplantation research as well. Up to date imaging studies have been limited to embryogenesis due to the opacity of the adult fish. Recently, a line of transparent adult zebrafish, named casper, have been created to facilitate in vivo visualization with fluorescence microscopy. This fish line is a double mutant that lacks both the pigmented melanocytes and reflective iridophores[2]. This new model of adult zebrafish brought forth a possibility to longitudinally visualize complex biological processes in vivo at an anatomic resolution not readily achievable in murine or other systems. With the creation of the casper model comes a new opportunity (and need) to develop more advanced in vivo imaging and quantitative techniques to study cellular processes in the fish with single cell resolution and sensitivity.
Standard flow cytometry has been used in quantitative analysis of isolated cell populations from zebrafish, which often requires the fish to be sacrificed or a large number of fish to be sampled. However, a technique to track hematopoietic stem cell proliferation and differentiation after marrow transplantation, or cancer cell engraftment, growth, and metastasis, in the same fish over time, is currently not available. Our group has previously developed optical methods for in vivo tracking of stem cells, cancer cells, and immune cells in live mice[3,4,5]. A video rate LSCM was optimized for live small animal imaging that is capable of imaging moving objects and searching for rare cells, as well as rapidly acquiring 3D data sets for assessing large tissue volumes[6]. Complementing in vivo imaging, an IVFC was developed for real-time detection and enumeration of circulating fluorescent cells in mouse circulation[7,8], in which an excitation laser beam is focused to a slit across a blood vessel. Each time a fluorescently labeled cell crosses the laser slit, an emission is detected and counted. If applicable to zebrafish, these techniques allow comprehensive optical examination of live zebrafish over time without sacrifice or phlebotomy, therefore reducing the variations between individuals and reducing the overall number of zebrafish.
The typical fish circulation is a single circuit: heart-gills-body-heart. In contrast to mammals, the low-pressure circulatory system of the fish does not have strong pulsation associated with the heartbeat, and the difference in flow rates between arteries and veins is relatively small. However, unlike the flat part of the mouse ear commonly used for the IVFC measurements, the fish body has a dense 3D vascular network. Therefore a confocal microscope is necessary to locate an appropriate vessel in the fish body with precise and consistent 3D positioning accuracy required for IVFC measurement. Here, we report the development of a dedicated system combining confocal microscopy and flow cytometry functionalities, so that both stationary and circulating cell populations can be tracked in transparent adult zebrafish in a single setting. Initial experiments to evaluate the two integrated techniques were undertaken in transgenic CD41-GFP casper fish whose circulating thrombocytes express the GFP, or in CD41-GFP/Gata1-DsRed transgenic casper fish whose red blood cells additionally express the DsRed. The vasculature was imaged after labeling with fluorescent dextrans.
MATERIALS AND METHODS
This new system, for simultaneous confocal imaging and IVFC measurement in adult casper (Figure 1), integrates two subsystems: a video rate LSCM (Figure 1, path A), and an IVFC (Figure 1, path B). The two paths share three continuous-wave lasers at 488 nm, (JDSU: FCD488-020) 561 nm (Cobolt Jive 561nm: 04-01), and 632.8 nm (Melles Griot: 05LHP991) for single-photon fluorescence excitation. A beamsplitter BS1 transmits 30% of the laser power to the microscope and reflects 70% to the flow cytometer. The imaging beam is directed to a scanner comprising a spinning polygon (Lincoln Laser: DT-36-290-025) and a galvanometer mirror (Cambridge Technology: 6240H) that together form the raster scan. A 40× objective lens (Olympus, LUCPlanF1; 0.6NA; dry) focuses the excitation beam onto the sample and collects fluorescence photons emitted from the sample. On return, the fluorescence collected from the microscope is descanned, and reflected (70%) by BS1 onto the imaging confocal detectors, with 100 µm pinholes (corresponding to 4.54 times the airy disc) in front of the PMTs (Hamamatsu R3896) (PMT 1–3 in Figure 1). The IVFC path is characterized by a cylindrical lens focusing the laser beam to a narrow slit (~5 µm wide at the sample). The length of the optical slit is controlled by an adjustable mechanical slit to match the diameter of the blood vessel to be measured. Photons emitted from fluorescent cells crossing the laser slit are collected by the same objective and reflected by BS3 and a 70R/30T beamsplitter BS2 to the IVFC confocal detectors, with 200 µm × 2 mm slit apertures in front of the PMTs (PMT 4–6 in Figure 1). The size of the slit aperture corresponds to 5 µm × 50 µm when imaged onto the sample plane. The key component of this hybrid system is the interchangeable dichroic beamsplitter BS3, which integrates the microscope and the IVFC beam paths by combining the different wavelengths. When the slot is empty, the system is set up for confocal imaging where up to three colors can be imaged simultaneously. By selecting dichroic beam splitters specific to the desired experiments, multicolor confocal imaging and multichannel IVFC are achievable. Thus, the system is highly adaptable to individual experimental needs. The laser power at the sample is 200 µW for the IVFC beams and less than 1 mW for the imaging beams.
Figure 1. Schematic of the integrated system.
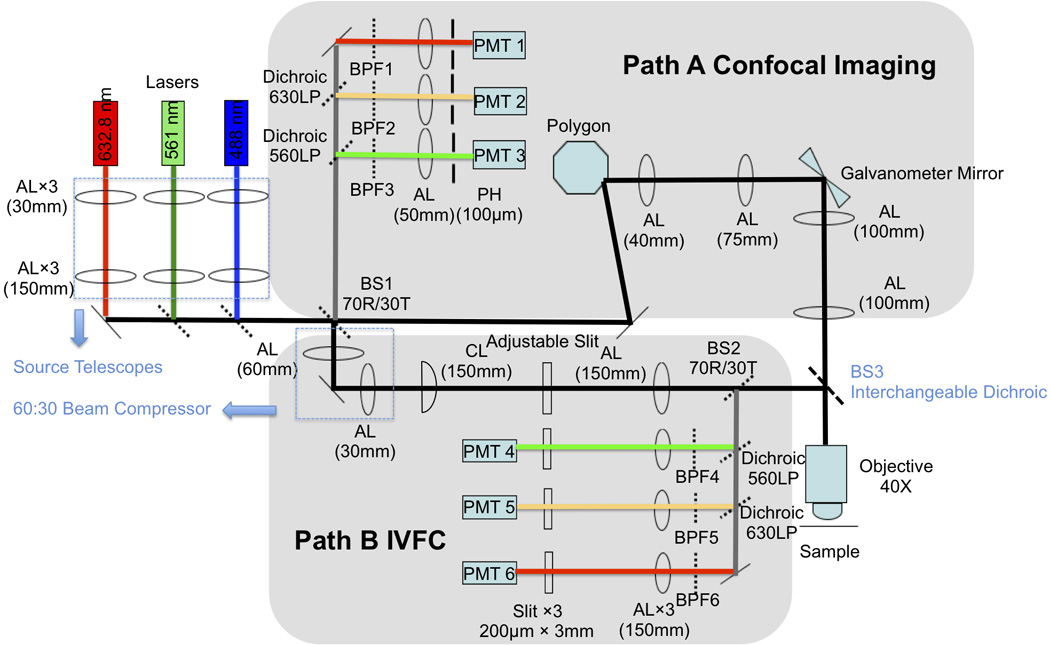
BS1, BS2, 70R/30T beam splitters; BS3, interchangeable dichroic (see Materials and Methods for specific dichroic for different experimental settings); AL, achromatic lens; CL, cylindrical lens; BPF, band pass filters; PH, pinhole; PMT, photomultiplier tube.
The diameters of the laser beams were carefully adjusted at the back aperture of the microscope objective in order to fulfill the diverging requirements of the two optical modalities. For confocal imaging, over-filling the back aperture of the objective is desired to maximize numerical aperture (NA) and improve optical resolution and confocal sectioning. The beam diameter was adjusted to the desired size and divergence with a source telescope at each laser. For IVFC, NA is reduced by underfilling the back focal plane of the objective, accomplished with a 60:30 beam compressor that reduces the beam diameter of the beam incident on the objective back aperture. The result is a longer depth of focus that provides an excitation slit of uniform intensity over a depth of the maximum diameter of the blood vessel (≈ 40 µm).
To focus the three excitation lasers at the same focal point, the 561 nm laser was chosen as the reference beam. A beam propagation analyzer (Mode Master, Coherent, St. Clara, CA, USA) was used up to minimize the divergence and times-diffraction-limit factor (M2) of the reference laser beam entering the confocal imaging system. Subsequently, the focal plane of the other two lasers (488 nm and 632.8 nm) was matched to the focal plane of the reference laser by slightly adjusting each respective source telescope, thus introducing beam divergence that minimizes chromatic aberrations. The alignment of the microscope was then verified and optimized in three dimensions using FocalCheck™ fluorescence microscope test slide #1 (Invitrogen: F36909). Focal alignment is achieved simultaneously in three colors by aligning the red, blue, and green rings of the FocalCheck™ microspheres containing fluorescent red, blue and green stains. Next, to ensure that the IVFC beams focus at the same focal plane as the imaging beams (even though the IVFC system had a longer depth of focus), the surface of a microscope slide was imaged using the 561 nm reflectance LSCM and brought into focus. Then, the 60:30 beam compressor in the IVFC beam path was adjusted until the image of the IVFC slit was sharpest and brightest on the slide surface. The alignment was verified by measuring the axial response function of both the LSCM and IVFC subsystems (plotting the two PMT output signals as the z position of the slide was translated +/−50 µm through the focus).
Animals
Adult zebrafish (2 months old) of the transparent casper line were used throughout the experiments. Preliminary low magnification imaging of the vasculature was performed using Fli-GFP transgenic casper in which all vascular endothelial cells express the green fluorescent protein (GFP). Subsequent LSCM and IVFC experiments were performed on the new system using CD41-GFP transgenic casper adults in which thrombocytes (nucleated equivalent of platelets in nonmammalian vertebrates[9]) were CD41+ (GFP+), and the vasculature was labeled by retro-orbital injection of 3 µl of a 70kDa dextran conjugated to Texas Red[10]. Additional experiments were performed using the CD41-GFP Gata1-DsRed double transgenic casper adults in which thrombocytes were GFP+ and a portion of the red blood cells were DsRed+. The vasculature of the double transgenic fish was labeled by injection of 2 µl of a 70kDa dextran conjugated to Alexa Fluor 647. Zebrafish were maintained in E3 fish water under 28°C, pH 7.4 and salinity-controlled conditions. Zebrafish were anesthetized with tricaine in E3 fish water (4.2 ml (4 mg/ml) tricaine/100 ml fish water) before procedure. For imaging and IVFC experiments, they were anesthetized and placed in glass-bottom culture dishes. Fish were kept alive and returned into the tank within 15 minutes after the completion of the imaging and IVFC measurements.
In vivo multicolor confocal Imaging
For confocal imaging experiments without in vivo flow cytometry, the interchangeable beam splitter (BS3) was removed. To image thrombocytes in CD41-GFP casper along with the vasculature, 488 nm and 561 nm lasers were used to excite GFP and Texas Red, respectively. GFP fluorescence was detected through a 525/50 nm band pass filter. Texas Red fluorescence was detected through a 610/60 nm band pass filter. Confocal images and movies were acquired with our custom iPhoton software at video rate (30 frames per second). The images were saved by averaging over 15 frames.
In vivo flow cytometry
For counting GFP+ thrombocytes in casper, a 552 nm edge dichroic beamsplitter (Semrock: FF552-Di02-25×36) was placed at BS3 to separate the wavelengths for vascular imaging (Texas Red; ex: 561 nm; em: 610/60 nm) from the wavelengths for IVFC cell counting (GFP; ex: 488 nm; em: 525/50 nm). The fish were placed on a rotating sample stage so that the selected blood vessel (seen from imaging screen) could be oriented perpendicularly to the laser slit, which excites individual fluorescently labeled cells as they flow though the laser focus. Thus, each cell generates a burst of fluorescent photons that can be detected as cell peaks. The IVFC trace was recorded in DT Measure Foundry and cell peaks were analyzed and counted by a custom Matlab program. Vessel images were overlaid with the image of excitation slit by ImageJ.
For simultaneous LSCM and two color IVFC measurement, BS3 was changed to a 605 nm edge dichroic beamsplitter (Semrock: FF605-Di02-25×36), which passes the 632.8 nm laser beam to excite the dextran-conjugated Alexa Fluor 647 (vasculature imaging), and reflects the 488 nm and 561 nm lasers beams to excite CD41-GFP and Gata1-DsRed circulating cells (IVFC measurement).
RESULTS
To confirm that the two optical subsystems focus at the same focal plane, their respective axial response was measured. The light power was evenly split between the two subsystems by placing a 50R/50T beamsplitter at BS3. The confocal PMT signals from both the imaging and IVFC paths were recorded while a glass slide placed in the object plane was translated by ±50 µm through the focal plane. Figure 2 shows the axial response of the two subsystems using 3 lasers. Both the imaging beam and the IVFC beam have maximum axial response at z=0, which has been defined as the location where the sharpest image was obtained. As designed, the imaging subsystem has a sharper axial response (FWHM = 8 µm) for optical sectioning than the IVFC subsystem. The axial response of the IVFC beam has a FWHM of about 40 µm around the focal plane, therefore can probe the maximum diameter of a blood vessel that would be chosen for IVFC measurement.
Figure 2. Axial response of LSCM and IVFC subsystems.
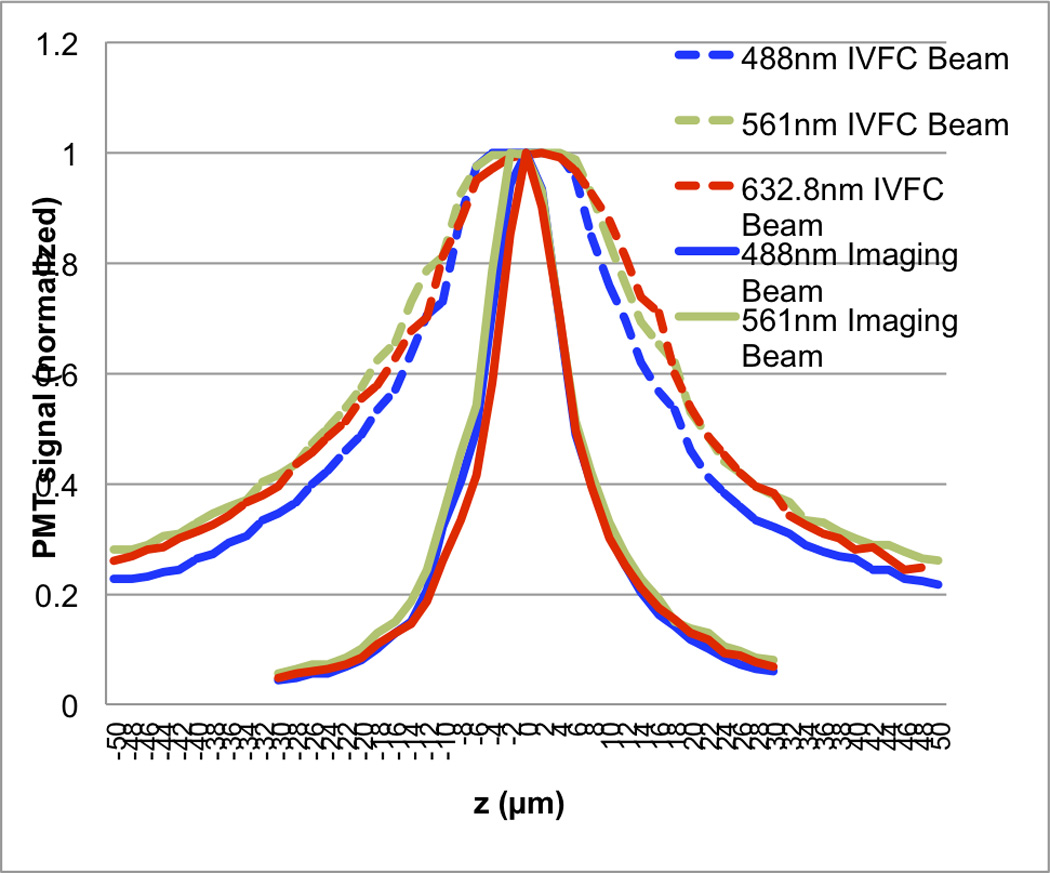
The two subsystems were aligned to focus at the same plane. The system was designed so that the imaging subsystem had high axial resolution (solid lines, FWHM about 8 µm) while the IVFC subsystem had long depth of focus (dashed lines, FWHM about 40 µm).
Preliminary survey of the fish vasculature was performed at low resolution using a fli-GFP transgenic casper zebrafish whose entire vasculature was labeled with the GFP (Figure 3). To demonstrate the in vivo multicolor confocal imaging of vasculature with stationary and circulating cells in the adult zebrafish, we acquired both static images and real-time videos using the CD41-GFP casper fish whose thrombocytes express GFP; its vasculature was labeled with Texas Red (Figure 4). We were able to visualize those thrombocytes that were sticking to the endothelium of blood vessel walls, as well as circulating thrombocytes in the blood stream. Individual GFP+ cells were observed flowing in the vessels in the skin and the muscle, and in inter-segmental vessels. Many GFP+ cells were also observed in the gills due to their rich vasculature, but a much smaller number of cells were seen circulating in the fin. Single inter-segmental arteries and veins were parallelly distributed at each transverse septum along the ventral side of the fish at depths of 120–200 µm underneath the surface of the fish skin (Figure 4 E), but the arteries and veins are not strictly arranged in alternating patterns. Intersegmental vessels were branches of a central artery or vein (Figure 4 F). Circulating thrombocytes were visible in the supplementary movies.
Figure 3. Image of vasculature of a fli:GFP casper where all blood vessel endothelial cells express the GFP.
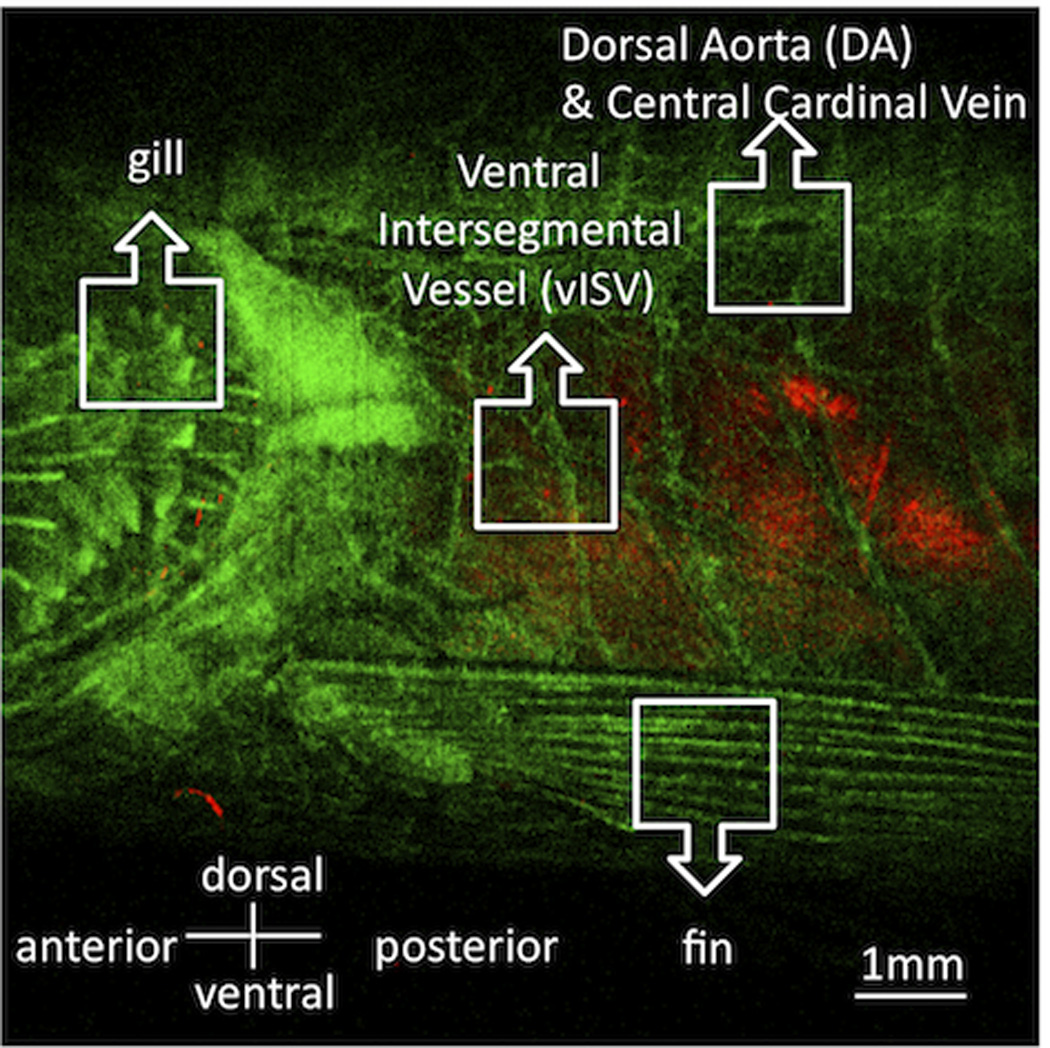
This image has been taken with an existing confocal microscope in our laboratory at low magnification and long depth of field, to provide orientation. Because of the complex vascular network of the fish, it is necessitates to perform IVFC under the guidance of 3D vasculature imaging using LSCM. Red is reflectance.
Figure 4. Images of vessels (Texas Red, red) and thrombocytes (GFP, green) at various regions and depths in a CD41-GFP casper.
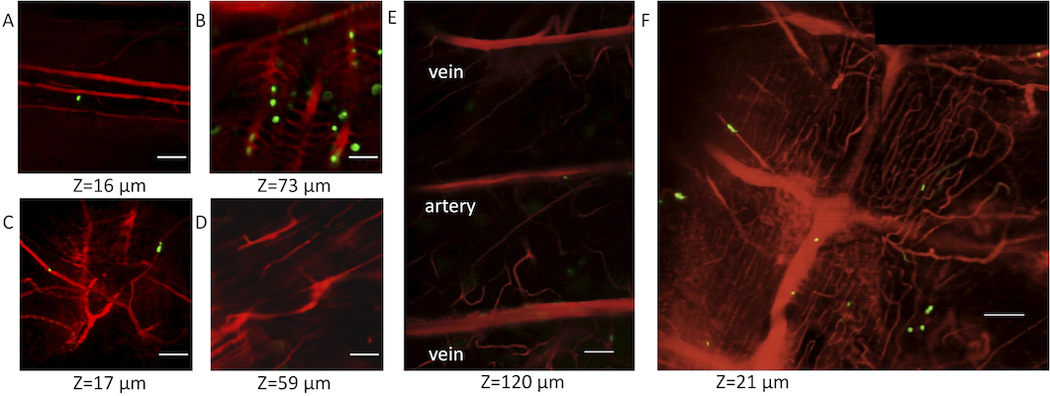
The imaging depth for each panel is indicated, relative to the surface of the fish (at z=0). Images of vessels in (A) fin, (B) gills, (C) skin, (D) muscle, (E) inter-segmental vessels of parallel distribution, (F) Caudal vein with inter-segmental veins. (C–E) were taken at different depth of the same location on the ventral side of the fish body. (E–F) are montages of several images. Scale bars are 50 µm.
To demonstrate the in vivo cell quantification capability with our new system in the adult casper model, we used the same CD41-GFP fish with Texas Red labeled vasculature. With the guidence of 3D vascular imaging navigation, multiple vessels were located for IVFC test measurements (Figure 5, A–C). An overlaid image of the slit (blue) indicated the position of the IVFC excitation slit that was oriented perpendicularly to the vessels. Figure 5 D–F show 2s traces sampled from 60s traces recorded with the slit on the corresponding vessel in Figure 5 A–C. GFP+ cells were detected in skin vessels, (Figure 5 D) but the cell count was low. In the same fish, the cell count was much higher in the inter-segmental vessels (Figure 5 E–F). Comparing the inter-segmental arteries and veins, the former had narrower signal peaks and more uniform pulse width distributions, resulting in fewer overlapping peaks, making it easier to distinguish individual peaks in the arteries. The peak width histogram was computed and shown in Figure 5 G.
Figure 5. IVFC measurement with vessel imaging in transgenic casper.
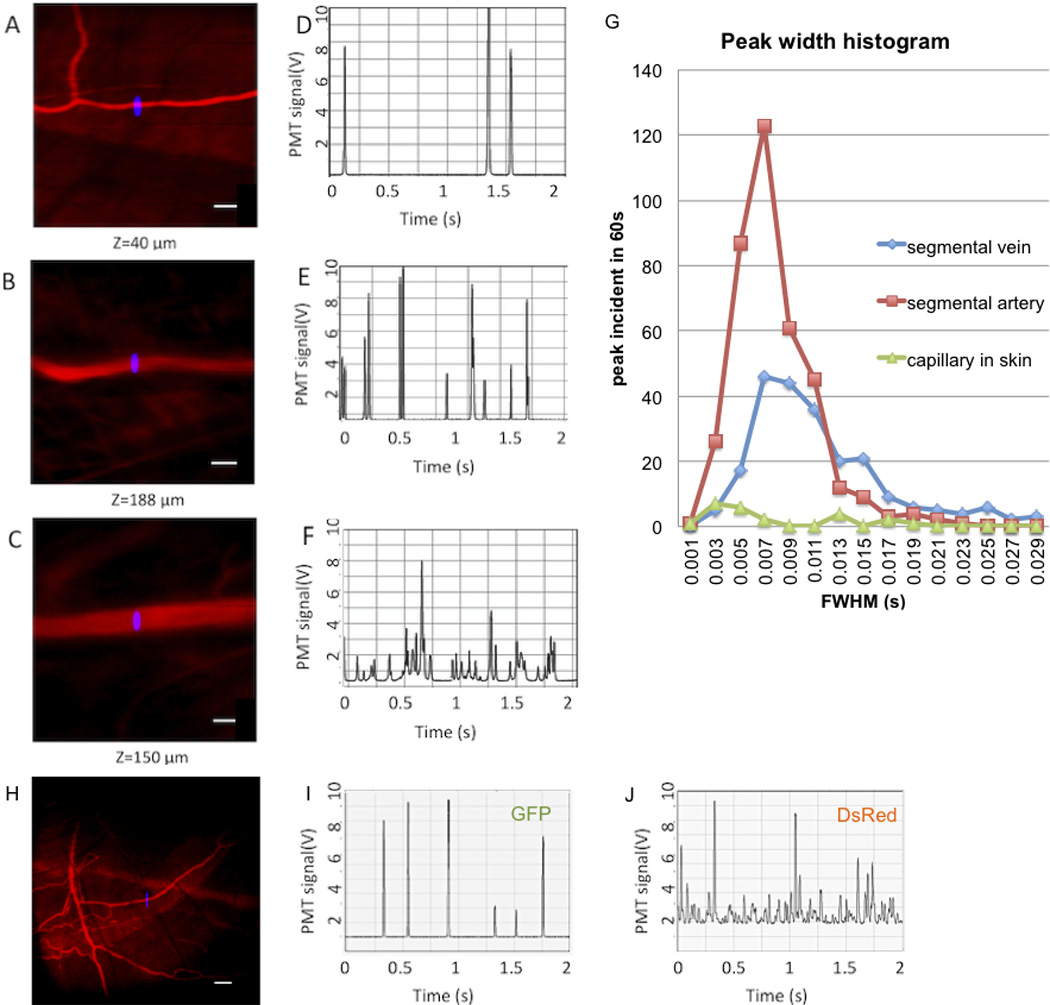
(A–G) IVFC and vessel imaging (Texas Red, red) in a CD41-GFP casper. An overlaid image of the slit indicated the position of IVFC excitation (blue). Images of (A) skin vessel, (B) inter-segmental artery, (C) inter-segmental vein, (D–F) corresponding IVFC traces. The x-axis denotes time in seconds, and y-axis is GFP fluorescence signal intensity in volts. For clarity only 2s of the 60s recorded traces are shown. (G) IVFC peak width histogram of the 60s traces for the three vessels. (H–J) Simultaneous vasculature imaging (dextran conjugated Alexa Fluor 647) and two color IVFC traces (I, DsRed cells; J, GFP cells) in a CD41-GFP Gata1-DsRed casper. Scale bars are 50 µm.
To further demonstrate the multicolor capability of the combined LSCM and IVFC system, CD41-GFP/Gata1-DsRed double transgenic fish were used for counting two fluorescent cell populations (GFP+ thrombocytes and DsRed+ erythrocytes) while imaging the vasculature, labeled with a fluorescent dextran (Figure 5 H). Since DsRed+ red blood cells were much more abundant than GFP+ thrombocytes (about 40% of the whole blood was DsRed+), a small vessel near the skin surface was chosen for circulating cell counting to avoid frequently overlapping cell peaks. The two right panels in Figure 5 H show example 2s traces taken from 60s recorded traces and show the difference in counting frequency and fluorescence intensity of the two circulating cell types.
The reproducibility of IVFC measurement in zebrafish is demonstrated in Figure 6 by measuring GFP+ thrombocytes in the same vascular locations of the same fish at three separate timepoints. The fish was anesthesized and recovered fully after each measurement (2 hours apart), therefore the three time points shown in Figure 6 can be considered individual experiment. We were able to locate the same vessels each time by looking for the same vascular pattern and compared to previously stored images. IVFC data were recorded on two locations as shown in Figure 6 A and B. The corresponding cell counts are shown in Figure 6 C. The cell count for site A is the average of three 60s traces while at site B a single 60s trace was recorded for each measurement. Site B was a smaller vessel branch downstream of site A and gave a lower cell count. The cell count numbers at each site remained relatively constant.
Figure 6. IVFC Reproducibility experiment.
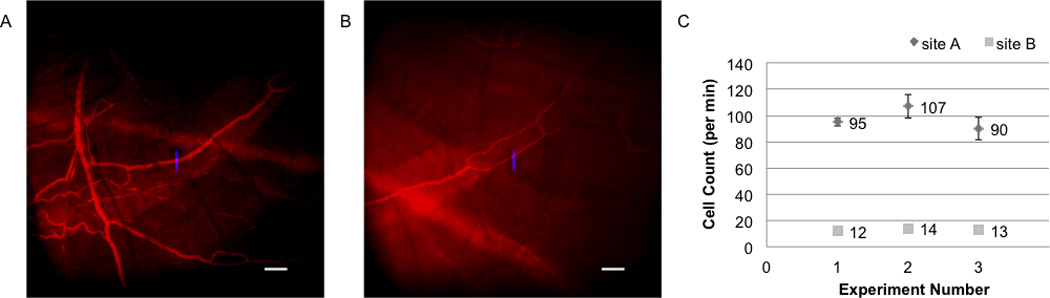
IVFC measuremnts of CD41-GFP thrombocytes performed at the same vascular locations of the same fish at three separate time points. The fish was allowed to recover in between the measurements. Site A was a small vessel and site B was a downstream branch. Vascular imaging was performed with the injection of 70 KDs dextran conjugated to Alex Fluor 647.
DISSCUSSION
We have developed an integrated optical platform that combines a LSCM with IVFC, enabling real-time 3D image capture and quantitative analysis of circulating cells in the adult zebrafish in vivo. The system can image to a depth of ~180 µm with single cell resolution. To choose an optimal blood vessel for the IVFC measurement in the adult zebrafish model, the selected vessel should allow the cells of the population of interest to traverse the laser focus one at a time, with consistent flow rate, reasonable sample volume, and repeatable location. For these reasons, we do not use vessels in the fin or tail, even though these vessels are easy to visualize, because the flow rate is low and susceptible to external variables such as temperature and anesthesia. The vessels in skin and muscle have bright fluorescence signals and occasional high flow rates, but these vessels are small (<15 µm) and the cell counts are too low to obtain statistically meaningful results and to probe rare cells of interest (Figure 5 G). Moreover the passage of single cells through the small vessels can cause large variations in the flow rates. The inter-segmental vessels on the ventral side that are 120–200 µm underneath the skin, have diameters of 30–50 µm, and are regularly distributed, have constant flow during anesthesia, and it is easy to locate the same vessel repeatedly. Inter-segmental arteries provide the right combination of high cell count with individual and distinguishable signal spikes. In inter-segmental veins, on the other hand, signal peaks frequently overlap, indicating that multiple cells passed through the slit. Therefore, inter-segmental arteries are the optimal choice for IVFC measurement at least in this CD41-GFP casper case. The optimum vessel size depends on how many cells of the population of interest are expected in the circulation. For counting rare cells, such as circulating tumor cells or transplanted stem cells and their progeny, a larger vessel such as the dorsal aorta or caudal artery may be needed.
The ventral inter-segmental arteries that we located in zebrafish for IVFC measurement have similar diameters as the ear arteries that were selected for IFVC measurements in mice[7]. The peak width equals the time that a cell travels through the excitation slit, which is inversely porpotional to the blood flow speed. Comparison of the peak width histogram (Figure 5 G) with previous mouse data[7] shows that the flow velocity in the fish is ~3 times slower in the artery and ~1.5 time slower in the vein because of its low pressure circulatory system. For a flow velocity of ~1 mm/s, the examed blood volume is about 0.06 µl/min in a 30 µm diameter vessel. Since an adult zebrafish has a total blood volume of ~20 µl (compared to ~2 ml for an adult mouse), the porportion of sampled volume in a 60s trace relative to the whole blood volume is about 30 fold higher in zebrafish than in mice, implying that it will be more likely to detect a very small number of cells circulating in a fish than in a mouse.
Our current imaging depth in the casper fish is approximately 180 µm for the LSCM. Deeper tissue imaging will be needed to access different organs such as the kidney (site of marrow engraftment) and liver (site of frequent metastasis)[11]. We plan to add two-photon microscopy and adaptive optics to improve image depth in the future.
We observed that the dye injection and the laser powers used (200 µW for the IVFC beams and less than 1 mW for the imaging beams) appear well-tolerated by the fish. All fish were viable and recover fully after the experment. We envision that as more fluorescent protein-based reporter fish become available, there will be less need for dye injection. Already the vasculature can be visualized without dye injection in the fli-GFP fish whose endothelial cells express the GFP, or in the Gata1-DsRed fish whose red blood cells (~40%) are DsRed+. Double- or triple-transgenic fish involving one of these strains are now being generated for simultaneous vascular imaging and monitoring of other cell populations of interest. Compared with current approaches to investigate adult zebrafish (phlebotomy or histological examination), the live imaging and IVFC methods enables longitudinal studies of cells within their natural environment with minimal invasiveness.
By applying imaging and quantitative techniques to transparent adult zebrafish casper model, our new system help meet the needs for cancer and stem cell research using this emerging model. The combined LSCM and IVFC will enable both stationary and circulating cells to be tracked non-invasively over time. This system can be applied to monitor tumor growth and metastases, and hematopoietic stem cell engraftment after transplantation, and follow up the same cohort of fish over time without affecting physiology of the fish. It can be used for identifying modifiers of tumor engraftment in genetic and chemical based screens in adult zebrafish casper model as well[12].
Supplementary Material
Acknowledgments
We thank Joel Spencer for technical help and discussion, Alicia Calson for help with image acquisition, and Mark Cronin-Golomb of Tufts University for the loan of the beam propagation analyzer. Li Zhang thanks China Scholarship Council (CSC) for financial support (No. 2008610061). This work was supported by NIH grant HL97794.
References
- 1.Tamplin OJ, Zon LI. Fishing at the cellular level. Nat. Method. 2010;7:600–601. doi: 10.1038/nmeth0810-600. [DOI] [PMC free article] [PubMed] [Google Scholar]
- 2.White RM, Sessa A, Burke C, Bowman T, LeBlanc J, Ceol C, Bourque C, Dovey M, Goessling W, Burns CE, Zon LI. Transparent adult zebrafish as a tool for in vivo transplantation analysis. Cell Stem Cell. 2008;2:183–189. doi: 10.1016/j.stem.2007.11.002. [DOI] [PMC free article] [PubMed] [Google Scholar]
- 3.Sipkins DA, Wei X, Wu JW, Runnels JM, Cote D, Means TK, Luster AD, Scadden DT, Lin CP. In vivo imaging of specialized bone marrow endothelial microdomains for tumour engraftment. Nature. 2005;435:969–973. doi: 10.1038/nature03703. [DOI] [PMC free article] [PubMed] [Google Scholar]
- 4.Lo Celso C, Fleming HE, Wu JW, Zhao CX, Miake-Lye S, Fujisaki J, Côté D, Rowe DW, Lin CP, Scadden DT. Live-animal tracking of individual haematopoietic stem/progenitor cells in their niche. Nature. 2009;457:92–96. doi: 10.1038/nature07434. [DOI] [PMC free article] [PubMed] [Google Scholar]
- 5.Fan Z, Spencer JA, Lu Y, Pitsillides CP, Singh G, Kim P, Yun SH, Toxavidis V, Strom TB, Lin CP, Koulmanda M. In vivo tracking of ‘color-coded’ effector, natural and induced regulatory T cells in the allograft response. Nature Medicine. 2010;16:718–723. doi: 10.1038/nm.2155. [DOI] [PMC free article] [PubMed] [Google Scholar]
- 6.Veilleux I, Spencer JA, Biss DP, Côté D, Lin CP. In vivo Cell tracking with Video Rate Multimodality Laser Scanning Microscopy. IEEE J. Sel. Top. Quantum Electron. 2008;14(1):10–18. [Google Scholar]
- 7.Novak J, Georgakoudi I, Wei X, Prossin A, Lin CP. In vivo flow cytometer for real-time detection and quantification of circulating cells. Opt. Lett. 2004;29:77–79. doi: 10.1364/ol.29.000077. [DOI] [PMC free article] [PubMed] [Google Scholar]
- 8.Georgakoudi I, Solban N, Novak J, Rice WL, Wei X, Hasan T, Lin CP. In vivo flow cytometry: a new method for enumerating circulating cancer cells. Cancer Res. 2004;64:5044–5504. doi: 10.1158/0008-5472.CAN-04-1058. [DOI] [PubMed] [Google Scholar]
- 9.Lin HF, Traver D, Zhu H, Dooley K, Paw BH, Zon LI, Handin RI. Analysis of thrombocyte development in CD41-GFP transgenic zebrafish. Blood. 2005;106:3803–3810. doi: 10.1182/blood-2005-01-0179. [DOI] [PMC free article] [PubMed] [Google Scholar]
- 10.Pugach EK, Li P, White RM, Zon LM. Retro-orbital Injection in Adult Zebrafish. JoVE. 2009;34 doi: 10.3791/1645. [DOI] [PMC free article] [PubMed] [Google Scholar]
- 11.Kissa K, Murayama E, Zapata A, Cortes A, Perret E, Machu C, Herbomel P. Live imaging of emerging hematopoietic stem cells and early thymus colonization. Blood. 2008;111:1147–1156. doi: 10.1182/blood-2007-07-099499. [DOI] [PubMed] [Google Scholar]
- 12.Martin CP, Chang TY, Koo BK, Gilleland CL, Wasserman SC, Yanik MF. High-throughput in vivo vertebrate screening. Nature Methods. 2010;7:634–636. doi: 10.1038/nmeth.1481. [DOI] [PMC free article] [PubMed] [Google Scholar]
Associated Data
This section collects any data citations, data availability statements, or supplementary materials included in this article.